
Abstract
For this report, we analyzed protein secondary structures in relation to the statistics of three nucleotide codon positions. The purpose of this investigation was to find which properties of the ribosome, tRNA or protein level, could explain the purine bias (Rrr) as it is observed in coding DNA. We found that the Rrr pattern is the consequence of a regularity (the codon structure) resulting from physicochemical constraints on proteins and thermodynamic constraints on ribosomal machinery. The physicochemical constraints on proteins mainly come from the hydropathy and molecular weight (MW) of secondary structures as well as the energy cost of amino acid synthesis. These constraints appear through a network of statistical correlations, such as (i) the cost of amino acid synthesis, which is in favor of a higher level of guanine in the first codon position, (ii) the constructive contribution of hydropathy alternation in proteins, (iii) the spatial organization of secondary structure in proteins according to solvent accessibility, (iv) the spatial organization of secondary structure according to amino acid hydropathy, (v) the statistical correlation of MW with protein secondary structures and their overall hydropathy, (vi) the statistical correlation of thymine in the second codon position with hydropathy and the energy cost of amino acid synthesis, and (vii) the statistical correlation of adenine in the second codon position with amino acid complexity and the MW of secondary protein structures. Amino acid physicochemical properties and functional constraints on proteins constitute a code that is translated into a purine bias within the coding DNA via tRNAs. In that sense, the Rrr pattern within coding DNA is the effect of information transfer on nucleotide composition from protein to DNA by selection according to the codon positions. Thus, coding DNA structure and ribosomal machinery co-evolved to minimize the energy cost of protein coding given the functional constraints on proteins.
Keywords
Introduction
Previous base composition investigations using codon positions showed that the frequency of purine is higher in the first than in the second and third codon positions.
1
6
Because this bias demonstrates statistical regularity across codons, it is called the purine bias.
4
The purine bias is a primary determinant of coding sequences (CDSs) and is universal to the biosphere. It was first described under the acronym
The characterization of the purine bias in CDSs is important because it is the only sufficiently robust signal for assisting in gene searches and annotations within genome investigations. Three variables are necessary to describe a CDS as follows: the stop codon frequency, the purine bias, and the gene expression level. 6 This is why gene tagging of transcriptome sequences is easier than direct tagging of genome sequences. 6 Exons can be easily detected via homology searches by using coding open reading frames (ORFs) identified in transcriptome sequences and comparing the results to genome sequences. Introns are often discovered as a consequence of exon searches using EST homologies.7,8 Similarly, the likelihood of detecting the promoter region increases when it is close to a CDS. 9 In addition, because the base composition of introns and intergenic sequences is correlated to those of CDSs, 10 one can conclude that the mechanism acting on the base composition of CDSs as a consequence of their evolution also affects the base composition of other genome structures functionally linked to CDSs. 11 Because genome organization appears to be a consequence of CDS evolution and because purine bias is conserved across the whole biosphere, it is natural to conclude that purine bias is among the main determinants of genome structure and evolution. A consequence of this observation is that purine bias results from a process that is maintained from the very beginning of cellular life on earth. Because purine bias is not observed in introns, one may exclude any polymerase involvement in its genesis. As a consequence, purine bias may result in some specificity related to ribosome machinery or some functional constraints at the protein level.
The ribosome machinery is a huge (2.5 MDa) enzymatic ribonucleoprotein complex that uses mRNA as a template and aminoacyl-transfer RNAs (aminoacyl-tRNAs) as substrates for catalyzing protein synthesis. Prokaryotic ribosomes consist of a large (50S) and a small (30S) subunit, which together make up the 70S particle; when considered together, their eukaryotic counterparts are the 60S and 40S subunits or the 80S ribosome. The 50S subunit consists of 23S RNA, 5S RNA, and approximately 30 proteins; the 30S subunit consists of 16S RNA and approximately 20 proteins. The interface between the 30S and 50S subunits consists mainly of RNA. The mRNA binds in a cleft of the 30S subunit, where its codons interact with the tRNA anticodons.
There are three binding sites in the 50S subunit for tRNA, that is, the A-site that binds the incoming aminoacyl-tRNA, the P-site that attaches the peptidyl-tRNA to the nascent polypeptide chain, and the E-site to which the deacylated P-site tRNA moves after peptide-bond formation before its ejection from ribosome.
12
14
Among the factors that affect ribosome performance in bacteria is the efficiency—accuracy trade-off in mRNA translation in which the overall codon reading accuracy competes with the growth rate. As a result, mutants with hyper-accurate and error-prone ribosomes grow more slowly than wild type. The second codon position seems to be more tightly controlled than the other two codon positions for the same type of mismatch, which is expected from the fact that the second codon position plays the most important role in determining the chemical properties of incorporated amino acids.
15
The 30S ribosomal subunit has a decoding center where it “inspects” the codon—anticodon pairing in much the same way that an enzyme senses the precise pairing of its substrate.
16
Aminoacyl-tRNA (which is made up of the tRNA and its cognate amino acid) is initially brought into the ribosome in a complex with EF-Tu and GTP. Incorrect tRNAs can dissociate before and after they are released by EF-Tu, with the overall selectivity being just as high as the product of both selection steps.
17
The experimental evidence for proofreading was revealed with the finding that near-cognate tRNAs (which contain a single subtle mismatch between the codon and anticodon) require more hydrolyzed GTPs per amino acid to be incorporated relative to the cognate case. Pre-steady-state kinetic experiments that dissected the various steps in tRNA selection showed that the forward rates of GTPase activation and accommodation (movement of tRNA into the peptidyl transferase center) were dramatically higher for the cognate than for the near-cognate tRNA. This finding suggested that cognate tRNA more efficiently induced conformational changes into a productive form that accelerated GTPase activation or accommodation in the ribosome.
13
In particular, these conformational changes involve three universally conserved bases (A1492, A1493, and G530 in the case of
Considering the functional constraints on proteins, the physicochemical properties associated with protein structures have been shown to be strongly dependent on the amino acid composition and particularly on amino acid alternation according to their hydropathy. 20 24 The alternation of hydropathy values along protein sequences is correlated with specific choices in the second codon position in corresponding CDSs,21,25 which means that the codon structure reflects the physicochemical properties of protein secondary structures. Actually, it has been proposed that the genetic code originated from the interactions between codons or anticodons and amino acids, which themselves depend on the physicochemical properties of amino acids and anticodons. 25 In addition, the hydrophilic amino acids tend to be rich in A in the second codon position (A2) and the hydrophobic amino acids tend to be rich in T in the second codon position (T2), 26 which is expected to influence the protein folding pattern. 24
Among the hypotheses that were proposed to explain CDS nucleotide periodicity, there are (i) rDNA periodicity, 27 (ii) codon—anticodon stability, 28 (iii) selection for translation efficiency,29,30 and (iv) protein secondary structures.21,24,25
Here, we use a statistical description of secondary protein structures in relation to codon composition to show that the correct assumption is that the RNY pattern, as it occurs in CDSs, is the consequence of periodicity introduced by the constructive contribution of hydropathy alternation to secondary protein structure within proteins, the molecular weight (MW) of secondary structures, and the energy cost of amino acid synthesis. The purine bias conservation throughout the biosphere suggests that a negative selection (purifying) mechanism is exerted over ribosomal machinery thermodynamics to maintain its function despite the codon and anticodon mutation rate.
Materials and Methods
Before any further development, let us note that (i) the regression lines of this study are
Sequence Dataset
The dataset used in this work consisted of a set of 10,731 CDSs from non-redundant proteins for which the three-dimensional (3D) structures have been experimentally determined. This set of proteins was selected from RCSB Protein Data Bank (PDB, release 3.2). 34 For each PDB entry, we used UniProtKB (release 14.0) to map the corresponding EMBL or GenBank identifier (ID) to retrieve the corresponding DNA sequence. However, the relationship between the structures reported in PDB and their corresponding DNA sequence is not straightforward for many cases. This situation is explained by a number of factors; for instance, many protein structures were either determined before or independent of their corresponding DNA sequences, implying a retrospective search among many alternative candidate genes that encode very similar proteins. In many cases, the ID reported by UniProtKB corresponded to an entire genome, forcing a careful ID list inspection to extract the CDS that matched the correct amino acid sequence reported in the PDB entry.
Removing Redundancy from Sequence Dataset
PDB contains many entries that correspond to the same or very similar proteins. For instance, in some cases one entry contains only a fragment of a protein and another entry contains the complete version of the same protein. However, the most common source of redundancy comes from the presence of homologous protein structures from closely related species. The first step in the preparation of our data set consisted of identifying this redundancy and choosing an item from each group containing the many redundant entries from the best and most informative (normally the longest) candidate. To this end, we first built the sequence homolog clusters and closely related proteins by using BLASTClust 35 with an identity threshold of 90%, which means that two sequences with more than 90% amino acid identities were assigned to the same cluster. Following this procedure, we obtained 18,827 clusters from an initial dataset of 143,373 entries (downloaded from http://www.rcsb.org/pdb/files/ss.tx). From each one of these clusters, we kept the longest sequence.
Mapping Secondary Structures to DNA Sequences
This process was conducted in two steps. The first one consisted of identifying the DNA sequence that most likely encoded the protein structure reported in PDB. To do this, we used the cross-reference database developed by Martin 36 that relates each PDB entry with one or more protein sequences from UniProtKB. In turn, each UniProtKB entry has links to the DNA repositories of GenBank (Release 175) or EMBL (Release 100). We discarded the CDSs that could not be retrieved through their GenBank ID. In most cases, the DNA sequence retrieved from a DNA repository matched the expected CDS, but in some cases, the GenBank (or EMBL) ID given by UniProtKB corresponded to a whole genome or to an entire chromosome. In such cases, all CDSs had to be extracted from their corresponding genomic DNA sequences and compared to the amino acid sequence from the PDB entry of interest to determine which sequence encoded the desired protein.
In general, additional processing was required to obtain an exact match between the translated CDS and the protein sequence from PDB. Often, it was necessary to trim the sequence of a translated CDS to obtain a DNA sequence that exactly matched a multiple of three for the sequence size corresponding to the PDB entry. Such discrepancies could occur when the structure of a protein reported in PDB was only partially available, and the information available in GenBank was a complete protein sequence. To reconcile this issue, each translated CDS was aligned to the amino acid sequence provided by PDB using the Smith—Waterman algorithm. 37 Owing to these difficulties, the final dataset was further reduced from 18,827 clusters to 10,731 entries for which an unambiguous determination of the DNA sequence was possible.
The second mapping step consisted of assigning each amino acid in the PDB to its associated codon in the corresponding DNA sequences. It was then easy to determine the codon and base frequencies for each type of secondary structure, providing that each individual amino acid in the PDB was assigned to a specific secondary structure category.
Codon Frequency and Secondary Structures
The nucleotide composition for each type of secondary structure, ie, the α-helix (
Results
Statistics of Secondary Structures
We found that, on average, half of the amino acids in protein sequences are dedicated to encoding secondary structures with a clear 3D periodic pattern, ie, α-helix (
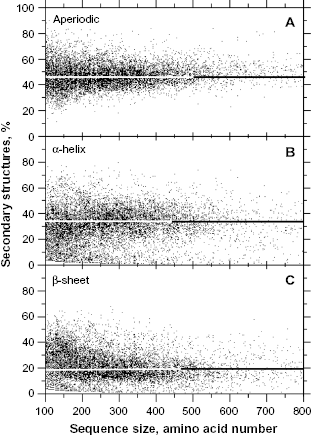
Relative frequency of secondary structures according to the protein size. The sample size for each structure is n = 10,731.
The frequencies of

Relationships between the
Relative frequency of amino acids per periodic (

Weighted average is (0.45 ×
The amino acid frequency maxima differ among the three secondary structures ie, (i)
Each secondary structure forms a network of statistical correlations among amino acids: in
Table S5 shows that purines are over-expected (∼60% of the cases) in the first codon position (R1) regardless of the secondary structure type ie,
A closer look at the data in Table S5 shows that purines (seven codons for A1 and five codons for G1) are more frequent in the first codon position than pyrimidines (six codons for T1 and five codons for C1), which is obvious from the fact that three codons from T1 are used as stop codons (not including the coding information). Similarly, the stop codon removes purine availability for the second and third codon positions. The A1, G1, C1, and T1 codons are approximately equifrequent in the
The statistics of basic physicochemical properties in amino acids given at Table S6 shows that again similar rates are found among structures for a given parameter, but the weighted averages may change significantly according to whether the first codon base is a purine or a pyrimidine (Tables S7–S9). The weighted average MW of amino acids increases regularly between 110 and 160 (Fig. 3A) according to the series G1 < A1 <C1 <T1 of codons as well as its correlated parameters for (i) the number of chemical bonds in their lateral chain (Fig. 3B and Table S5, “Bnd” with
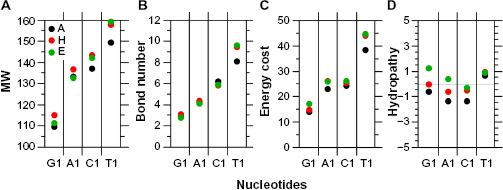
Average features of amino acids encoded by the G1, A1, C1, and T1 codons weighted by relative frequencies per structure. In A, codons in G1, A1, C1, and T1 account for 37, 27, 21, and 15%, respectively. In H, codons in G1, A1, C1, and T1 account for 36, 26, 22, and 16%, respectively. In E, codons in G1, A1, C1, and T1 account for 33, 29, 18, and 20%, respectively (see Tables S7–S9).
The largest amino acid frequencies in Table S6 are associated with Ala, Val, and Gly (all G1 codons), which confirms the links between the G1 > G2 rule and the high frequencies of low complexity amino acids in
We also found that the amino acids with the lowest MWs (or the smallest lateral chains) are also the most frequent (Fig. 4A), which is expected because these amino acids are less costly to synthesize, in terms of energy. This statistical correlation between amino acid frequency and protein MW is consistent in
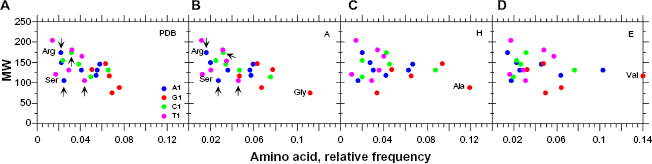
Average frequencies of amino acids with A1, G1, C1, and T1 codons (see Tables S6–S9) according to MW.
Purine Bias and Protein Secondary Structures
Considering the relationships between protein secondary structures and nucleotide distribution according to the codon positions, Figure 5 shows that compositional constraints act on the first and second codon positions while the third codon position follows the regional trend for intergenic DNA (see Bernardi
11
) as can be deduced from its larger standard deviation. Globally, (i)
Relationships between purines in the three codon positions according to periodic and aperiodic structures from PDB. The sample size for each structure is
The most significant relationship between purines and pyrimidines occurs in the second codon position through A and T (Fig. 6A) because these two nucleotides are almost sufficient for classification as periodic and aperiodic secondary protein structures. Figure 6A shows that, roughly speaking, in
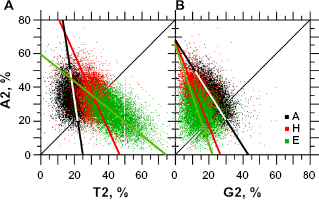
Relationships between A, G, and T in the second codon position according to periodic and aperiodic structures. The sample size for each structure is
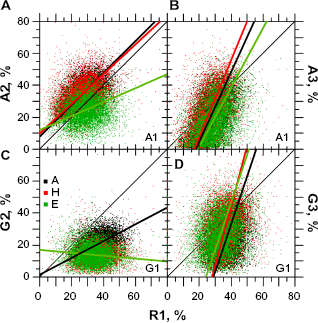
Taken together, the purine constraints are such that R1 > R2 and R1 > R3, which makes the purine bias orientation change from the first to third codon positions (Fig. 7) regardless of the secondary structure under consideration. However, periodic structures (especially

Relationships between purines in the three codon positions according to periodic and aperiodic structures. The sample size for each structure is
Interestingly, Figure 8 shows that

Relationships between GC2 and GC3 according to periodic and aperiodic structures. The sample size for each structure is n = 10,731.

Scatter plot of G3 versus C3. The sample size for each structure is n = 10,731.
Secondary Structures and Protein Physicochemical Constraints
Considering the relationship between protein secondary structures and their physicochemical constraints, we found that the range of average surface accessibility (ASA) for (i)

Relationships between hydropathy, ASA, average MW, and the energy cost of amino acid synthesis in protein secondary structures. The sample size for each structure is
Interestingly, all three structures are distributed, on average, on a line corresponding to MW = 10 × hydropathy + 130 (Fig. 10B). Thus, one can say that the contribution of
In view of the general relationships shown in Figure 10B (confirmatory of Chiusano et al. 25 ), the compensation trend between MW and hydropathy is similar among secondary structures. When the three structures are considered separately, the larger the MW, the lower the hydropathy (the larger the level of hydrophily) and vice versa. This common relationship between MW and hydropathy among the three structures means that if the contribution of one structure to the whole protein size is low (low MW), its relative contribution to the average hydrophobicity of this protein will be comparatively larger, but the two other structures will compensate for the MW and hydrophobicity at the whole protein level.
The energy cost of the amino acid synthesis associated with
As expected from their chemistry, heteroatoms were found to have fewer

Relationships between the number of heteroatoms (NOS), hydropathy, and ASA. The sample size for each structure is
From Figure 10B and C, one would expect a positive relationship between the MW and energy cost. In fact, this relationship is illustrated in Figure 12A. We also found consistent statistical correlations between MW and A2 (Fig. 12B) or G1 (Fig. 12C), which is an expected consequence of the fact that G1 is associated with small amino acids of low complexity (Fig. 3A and B). However, the statistical correlations between A2 and G1 were small (

Relationships between MW, the energy cost of amino acid synthesis, A2, and G1. The sample size for each structure is n = 10,731.
The physicochemical relationships between the secondary structures and their hydropathy, ASA, and energy cost are all encoded by T2 (Fig. 13). The statistical correlation coefficient of T2 with ASA (<0) and hydropathy (>0) is ∼0.9 and confirms that

Relationships between T2, ASA, hydropathy, and the energy cost of amino acid synthesis. The sample size for each structure is n = 10,731.
Relationships between Secondary Protein Structures and Codons
As shown above, the hydropathy and MW of secondary structures are negatively correlated. In addition, these factors are linked to the second codon position, which is dominated by A2 versus T2 compensation (explaining the low G2 contribution). To better understand how codons are involved with this relationship, we divided datasets of
Focusing on
Distribution of amino acids in secondary structures of proteins according to codon structure, hydropathy, and MW.

Aperiodic structures are hydrophilic in 99.2% of cases. The amino acids that are most affected in frequency between light and heavy MW (Table 2, column “H-L”) are Lys, Ala, and Gly. Ala and Val decrease from light to heavy MW and Lys increases, which is in line with the fact that Ala and Gly are small and Lys is large (interestingly, Lys is A2). The amino acids that contribute to hydrophilicity are Lys (AAR, weight: 3.9 × 6.18 = 24.1), Asn (AAY, weight: 3.5 × 5.61 = 19.6), Gln (CAR, weighted average: 3.5 × 3.44 = 12.0), His (CAY, weighted average: 3.2 × 2.46 = 7.9), Glu (GAR, weighted average: 3.5 × 6.56 = 23.0), Asp (GAY, weighted average: 3.5 × 7.84 = 27.4), Tyr (TAY, weighted average: 1.3 × 2.73 = 3.5), Tnr (ACN, weighted average: 0.7 × 5.68 = 4.0), Pro (CCN, weighted average: 1.6 × 7.39 = 11.8), Arg (CGN|AGR, weighted average: 4.5 × 4.76 = 21.4), Ser (TCN|AGY, weighted average: 0.8 × 7.35 = 5.9), Gly (GGN, weighted average: 0.4 × 11.18 = 4.5), and Trp (TGG, weighted average: 0.9 × 0.99 = 0.9). The amino acid contribution to aperiodic structure series in terms of hydrophilicity is GAY > AAR > GAR > CGN|AGR > AAY > CAR > CCN > CAY > T CN|AGY>GGN∼ACN∼TAY>TGG. Again, as expected from Figures 6 and 13B, one can see that the pattern of amino acid contribution to hydrophilicity is dominated by A2 in
Helix structures are more difficult to analyze because their contribution is balanced among hydrophilicity and hydrophobicity (amphipathy). The division in light and heavy subgroups by MW roughly corresponds to an equivalent division by hydropathy because the average MW matches the average hydropathy (zero) in the case of
The amino acids that most vary in relation to MW and hydrophobicity according to the secondary structure under consideration deserve additional comments. Interestingly, the general trends of GRN (Glu, Asp, and Gly) and GYN (Ala, Val) are hydrophilic and hydrophobic, respectively. As expected from their low complexity level, the frequency of Ala and Gly increases when the MW of a secondary structure diminishes or when the hydrophobicity increases. Thus, in the case of these amino acids the important contribution seems not to be the hydropathy score, but rather the absence (or quasi-absence) of a lateral chain (the small steric size).
Interestingly, Ala and Gly also show that all codons starting with G do not necessarily show the same trend because GAR (Glu) and GAY (Asp) increase with MW. This is consistent with constraints on steric size because both amino acids have a rather large lateral chain (five to six chemical bonds). Because all A2 amino acids are hydrophilic and have a rather large size (≥5 bonds), one may understand why the hydropathy diminishes with increased MW.
In
In
Interestingly, the alphabetical order for first and second codon positions in Table 2 approximately follows the hydropathy score for amino acids. The largest variations between low and high MWs in
Discussion
The general picture of our statistical analysis is consistent with previous reports. The large set of concatenated secondary structures from the entire non-redundant PDB database analyzed here reveals a proportion of
The purine bias observed in CDSs is not trivial because purine and pyrimidine distribution have the same probability of occurrence in the three codon positions according to the genetic code. The question is to identify the features that positively contribute to this bias. Any contribution from polymerase can be ruled out because the purine bias is not present in introns. 5 The consequence of this finding is that the purine bias occurs because of a selective process induced (i) by the protein function 40 or (ii) by ribosome machinery. 41
Actually, our statistical analysis of the base composition according to the three codon positions and the protein secondary structures shows that the contribution of the amino acid synthesis, energy cost, and physicochemical constraints to secondary protein structures are the principal determinants. We showed that the purine bias results from the optimization of protein sequences through competition between (i) the information encoded by nucleotides, (ii) the secondary structure of proteins, (iii) the MW and hydropathy of secondary structures, and (iv) the energy cost of amino acid synthesis. The first codon position is optimized according to the energy cost of amino acid synthesis and amino acid MW or complexity, which are in favor of G1-rich codons. In contrast, in the second codon position, T2 is driven by physicochemical constraints on secondary structures, and A2 is driven by the MW. The periodicity that is needed for secondary protein structures induces a specific amino acid use whose consequence is a low purine rate in the second codon position.
It is the is structures that most contribute to the purine bias in the second codon position, followed by
It has been shown that nucleotide mutations may occur in the anticodon; however, these mutations can be compensated by matching mutations in their corresponding codon to maintain the amino acid association to a given codon. This adaptive process shows that a constant codon composition reshuffling should occur 41 without a selective process to maintain the purine bias as it is universally observed today throughout the biosphere. Interestingly, according to Ogle et al. 16 and Almlöf et al., 42 G1 may promote larger H-bond interactions between A1493, mRNA, and tRNA than A1 in the ribosomal decoding center of the 30S subunit. Actually, the internal selectivity for codon recognition is enhanced by the stereospecific component provided by the ribosome, mainly A1492, A1493, and G530,42,43 and the ribosome contribution to the mRNA—tRNA complex stabilization by interacting with the minor groove of the Watson—Crick base pairs is general and essential for ribosome accuracy. 16 Thus, the stability of the mRNA—tRNA complex in the ribosome A-site may be a selected process that promotes a specific codon preference in agreement with a larger R1. This hypothesis is in line with the observation that there is a general efficiency—accuracy trade-off in mRNA translation, and it has therefore been suggested that the bacterial ribosome has evolved to an overall accuracy of codon reading that maximizes the growth rate rather than the current accuracy. The maximal accuracy is highest for the second codon position and lowest for the third. 15 Factors increasing mRNA—tRNA stability in the A-site are expected to promote such a trade-off. 44 In reality, the codons believed to induce a “correct geometry” with their cognate tRNA according to the conformational changes in the three universally conserved 16S rRNA bases (A1492, A1493, and G530) could also correspond to the codons with larger R1 simply because they provide higher stability to the mRNA—tRNA complex in the A-site. Given the arguments above, the ribosome could contribute by proofreading to lower the energy cost of protein synthesis.
Many tRNAs can translate more than one codon, but with variable abilities. The codon best recognized by the anticodon is preferred in highly expressed genes and may be translated faster than non-optimal codons with the consequence that ribosomes move faster along a mRNA molecule containing more optimal codons. The difference in optimal codons among species most likely reflects variation to the extent of which natural selection is effective in shaping codon usage. 45 Following Sharp et al., 45 (i) the frequency of optimal codons in genes potentially under strong selection is given by the highly expressed genes, and alternatively, when genes are expressed at low levels and (ii) the codon usage of the genome as a whole is an estimate of the pattern of codon usage when selection is weak. The application of this reasoning to the purine bias tells us that the codons ending in A or G are not optimal in a global sense when compared to those ending in C or T because Y3 is preferred to R3. Thus, larger G or A levels in the first anticodon position are expected to be the optimal situation for cell growth. Actually, C3 occurs more frequently than G3 in GC-rich organisms, with the consequence that G of the first anticodon position will be preferred. G would promote larger tRNA—mRNA stability because it would involve three hydrogen bonds (in place of two if considering a pyrimidine) with U3 (T3 for DNA) or C3 in the corresponding mRNA codon. In GC-poor organisms, A3 is less frequent than T3 according to the purine bias. Thus, the preferred base in the first anticodon position is an A. Therefore, this configuration is expected to occur in organisms in which tRNA—mRNA stability is less critical. However, even in the case of a gene with strong selection pressure (see Sharp et al. 45 for a discussion of selection pressure on codon usage), the first anticodon position will be a C in a GC-poor context. 46 However, the reasoning just outlined must be considered with care. It is also true that in the case of human, C3-rich CDSs are expected to use more rare codons than G3-rich ones. Actually, several (seven) tRNA genes for the decoding of C3 codons seem to be missing in the human genome. 47 A similar situation occurs for T3 because several (six) tRNA genes for the decoding of T3 codons seem also to be missing, which may argue in favor of considering the codon bias more as Rrr than RNY. Thus, in the human genome, Y3-rich genes are expected to use more rare codons with the consequence that the ribosome machinery is expected to pause more in these CDSs than in R3-rich ones because of the necessity to use cognate tRNA, and thus, their expression level should be lower. Therefore, Y3-rich CDSs are expected to be under different selective pressures compared to R3-rich CDSs. 48 If C3-rich CDSs are effectively expressed at a low rate, more or less rare codons in these genes could possibly be without much consequence for cells; if this is true, it would justify why C3 may reach higher levels than G3 in the context of a compositional transition toward GC.
In addition to warm-blood vertebrates, several genomes from other eventually distant eukaryote families, such as those of rice and
The ribosome is especially equipped with a proofreading mechanism that improves the translation accuracy according to the first and second codon positions that warrant acceptable fidelity and functionality between the versions of a protein and their mold, that is, the CDSs. The third position satisfies this need with the thermodynamic stability of the codon—anticodon complex. Thus, one may conclude that the purine bias is the best compromise concerning (i) the constraints on the amino acid choice by secondary protein structures to match their global physicochemical properties and (ii) the optimization of tRNA—mRNA complex stability as well as ribosomal processing and accuracy. 49 As a consequence, one can say that the backwards effect from protein to DNA base composition is the purine bias, which is also the reverse of the central dogma of biology ie, the coding information flows from DNA to protein. In other words, the purine bias is the imprinting in the DNA from the selective pressure on the functional necessities of proteins. In that sense, one can also say that proteins exert a selective process on the base composition of DNA at the CDS level and that this selective process may affect the genome organization according to the mutational bias toward GC or AT and other selective processes according to the functional necessities of coding DNA in relation to non-coding DNA (see Bernardi 11 and Kudla et al. 50 ). Because proteins exert universal constraints on DNA at the CDS level, this finding also explains why purine bias contributes to their universal classification.4,5
The purine bias described above as Rrr or Ggg is reminiscent of the GNC hypothesis on the origin of the genetic code. 51 The GNC code could have originated from a four amino acid system encoded by GNC codons. This GNC code (G for guanine, N for any of the four nucleotides, and C for cytosine) is able to encode GADV-proteins (G for Gly, A for Ala, D for aspartic acid, and V for Val) with appropriate 3D structures, which would be water-soluble globular proteins (hydropathy, α-helix, β-sheet, and β-turn) and would also have catalytic activities. 52 According to Ikehara et al., 51 this primitive code would have evolved first in a code with 16 codons and 10 amino acids, the so-called SNS (S for strong: G or C), and then in the RNY ancestral codon suggested by Shepherd. 1 Thus, the primitive code would have first been optimized for the G1 codons that encode the simplest and most frequent amino acids, and would have evolved further to encode amino acids of higher complexity and energy cost. The conservation of this hierarchy warrants that the assembly of modern proteins is optimized for the lowest overall energy cost.
From a practical point of view, (i) the purine bias, (ii) MW = 10 × hydropathy + 130 relationship, (iii) the fact that the larger the MW, the lower the hydropathy of a structure (and vice versa), (iv) the statistical correlation of T2 with solvent access, hydropathy, and energy cost, (v) the statistical correlation between A2 and MW, and (vi) the association of low MW with G1 will have important consequences for synthetic biology and automatic screening of artificial sequences (synthetic genes 53 ) for new functional properties. According to this view, the whole process of genetic variability and purifying selection can be simulated in silico. This finding opens the way for in silico investigation by the following sequence of steps: (i) sequence genesis according to random process inside a functional domain whose parameters are purine bias, MW, hydropathy, and energy cost of amino acid synthesis, (ii) 3D structure determination by ab initio process, (iii) false positive filtering through Ramachandran constraints, 54 (iv) biosynthesis according to a biological system compatible for the GC level and codon bias, and (v) experimental testing in biological conditions. This pipeline would also allow the evolutionary inference of given proteins for resistant drug inhibitors in agriculture and medical sciences.
Author Contributions
Conceived and designed the experiments: NC, MPL. Analyzed the data: NC, MPL. Wrote the first draft of the manuscript: NC. Contributed to the writing of the manuscript: NC, FAV. Agree with manuscript results and conclusions: NC, FAV. Jointly developed the structure and arguments for the paper: NC. Made critical revisions and approved final version: NC, FAV. Funding: ABM, FAV. All authors reviewed and approved of the final manuscript.
Supplementary Data
Supplementary Table 1
Statistic analysis of frequency differences of amino acids (AA) among secondary structures of proteins.
Supplementary Table 2
Correlations between amino acids in the
Supplementary Table 3
Similar table to Table S2, according to
Supplementary Table 4
Similar table to Table S2 and S3, according to
Supplementary Table 5
Relative frequency of codons in secondary structures of non-redundant proteins from PDB.
Supplementary Table 6
Basic physico-chemical features of amino acids associated with purines and pyrimidines in the first codon position.
Supplementary Table 7
Weighted averages of some physico-chemical properties of amino acids shown in Figure 3 calculated from Table S5 according to
Supplementary Table 8
Similar table to Table S7, according to
Supplementary Table 9
Similar table to Table S7 and S8, according to
Footnotes
As a requirement of publication the authors have provided signed confirmation of their compliance with ethical and legal obligations including but not limited to compliance with ICMJE authorship and competing interests guidelines, that the article is neither under consideration for publication nor published elsewhere, of their compliance with legal and ethical guidelines concerning human and animal research participants (if applicable), and that permission has been obtained for reproduction of any copyrighted material. This article was subject to blind, independent, expert peer review. The reviewers reported no competing interests.