
Abstract
Omics technologies enable unbiased investigation of biological systems through massively parallel sequence acquisition or molecular measurements, bringing the life sciences into the era of Big Data. A central challenge posed by such omics datasets is how to transform these data into biological knowledge, for example, how to use these data to answer questions such as: Which functional pathways are involved in cell differentiation? Which genes should we target to stop cancer? Network analysis is a powerful and general approach to solve this problem consisting of two fundamental stages, network reconstruction, and network interrogation. Here we provide an overview of network analysis including a step-by-step guide on how to perform and use this approach to investigate a biological question. In this guide, we also include the software packages that we and others employ for each of the steps of a network analysis workflow.
Keywords
Introduction
In saying that we understand a biological process, we usually mean that we are able to predict future events and manipulate the process into a desired direction. Thus, biological inquiry could be viewed as an attempt to understand how a biological system transits from one state to another. Such transitions underlie a wide range of biological phenomena from cell differentiation to recovery from disease. In attempting to understand these transitions, a simple and frequently used approach is to compare two states of a system (eg, before and after stimulus, with and without mutation, or healthy and diseased). Although more sophisticated approaches with time-series data, dose-effect data, or three or more sample groups can be also used, here we discuss analysis of data from a two-class study design. Furthermore, most of the methods that we describe can, with slight modifications, be used for other study designs. Today, omics technologies enable unbiased investigation of biological systems through massively parallel sequence acquisition or molecular measurements, bringing the life sciences into the era of Big Data. A central challenge posed by such omics datasets is how to navigate through the
Network analysis is a powerful and general approach to this problem, in which the biological system is modeled as a network whose nodes represent dynamical units (eg, genes, proteins, metabolites, etc) and edges stand for links between them. Network analysis consists of two fundamental stages: network reconstruction and network interrogation. For omics molecular measurements such as gene expression, a particular type of network analysis called covariation network analysis has become a dominant approach. In such networks, a node represents the expression of the gene being measured, and an edge indicates that the expressions of two genes are correlated. Multiple groups including ours have been successfully using such methods to gain a systems-level understanding of biological processes and to reveal mechanisms of different diseases.1–3 Several recent discoveries ranging from genes that drive progression of different cancers4,5 to microbes and microbial genes that cause a human illness 6 became possible because of the predictive power of network analysis. In particular, such insights would be very difficult to achieve if analysis is limited to finding differentially expressed genes and follow-up data mining of those genes. Due to the rapid pace of evolution of techniques and omics technologies, the practical application of network analysis has usually required a dedicated computational biologist. This requirement has limited the extent to which the larger biological sciences community has benefited from network analysis. Here we provide an overview of covariation network reconstruction and interrogation, including a step-by-step guide on how to perform and use network analysis to investigate a biological question (Fig. 1). In this guide, we include the software packages that we employ (and specific pointers to the methods or software used by other groups) for each of the steps of a model network analysis workflow. Although in this guide we mostly focus on covariation networks, the analysis steps related to network interrogation are applicable to other types of networks such as semantic networks or molecular interaction networks.

Workflow of network analysis. (
In general, the types of omics measurements that are amenable to network analysis include microarrays, next-generation sequencing (for genotyping, transcriptome profiling, or microbiome analysis), and mass spectrometry-based proteomics and metabolomics data. While network analysis is usually and most straightforwardly applied to one type of omics data at a time (ie, to a homogeneous dataset), integrative networks are becoming more popular under the premise that the resulting networks more comprehensively describe the underlying biology.7,8 Each type of
Network Reconstruction
The first stage of network analysis is network reconstruction, which is the data-driven discovery or inference of the entities/nodes (transcripts, proteins, genes, metabolites, or microbes) and relationships or edges between these entities that together constitute the biological network. Here, we describe the steps involved in network reconstruction starting from entity abundance or frequency data.
Normalization (Data Preprocessing)
Customarily, abundance data are normalized in order to correct for sample-to-sample variation in the overall distribution of abundance values (or more generally, to normalize specific quantities that depend on the distribution). Measurements of gene expression levels (as well as other types of omics data) can be affected by a variety of non-biological factors including unequal amount of starting RNA, different extents of labeling, or different efficiencies of detection between samples. Before normalization, data are often log-transformed in order to stabilize variances when measurements span orders of magnitude. Frequently used normalization schemes include median normalization, quantile normalization, LOWESS normalization 13 for RNA microarray data, reads per kilobase per million mapped reads (RPKM), 14 and trimmed mean of M-values 15 for RNA-seq data. In practice, we use normalization procedures available in the software package BRB ArrayTools 16 for normalization of microarray data (Table 1). In addition, most normalization procedures are available as software packages in the Bioconductor toolkit. 17 Systematic evaluations of transcriptome normalization methods have been reported for both microarrays 18 and RNA-seq19; however, evaluations using large numbers of sample groups are needed in order to determine which normalization method is most appropriate for covariance network inference. Selection of an appropriate normalization method is clearly important, given that selection of a suboptimal normalization scheme can lead to overestimation of gene-gene correlation coefficients. 18 Beyond transcriptome profiling, different omics data types may benefit from different types of normalization. For example, new methods have been proposed for normalization of metabolomics 20 and microbiome 21 data. Although there is no consensus about the best methods for many types of data, in the experience of the authors,22–26 simple methods such as quantile, LOWESS, or even median normalization perform reasonably well for class comparison and correlation if there are no major biases in the data such as batch effects.
Tools for network reconstruction and interrogation.

Discovery of Differentially Expressed Genes (Selecting Nodes)
A crucial step in network reconstruction is the identification of the relevant subset of variables/genes that will constitute the
Correlation Analysis for Network Reconstruction (Finding Links between Nodes)
The central biological principles underlying correlation network analysis are 1) that DEGs reflect functional changes, and 2) that DEGs do not work individually but interact (eg, at the protein or pathway level) to functionally alter the biological system. In gene expression networks, nodes represent genes and edges represent significant pairwise associations between gene expression profiles. The central mathematical/statistical principle that allows us to use correlation networks for analysis of biological systems is that the correlation between two variables, if statistically significant, is always a result of causation. Specifically, correlation results from regulatory relations between the two variables, or from a common causal regulator to the two variables, or both, as in the case of a feed-forward loop.
32
To reconstruct the network, the Pearson or Spearman correlation coefficient can be used to obtain an association (similarity) measure for each possible pair of DEGs, with a cutoff for statistical significance (an FDR cutoff of 10% for the
Discriminating between Direct and Indirect Links
Covariation gene networks in general consist of connections that result from a combination of direct and indirect effects between genes. For example, if a gene Y strongly depends on gene X and gene Z also depends on X, it is likely that a high association (eg, correlation) will exist between Y and Z even if there is no direct dependence between them (Fig. 2). Moreover, even if a true dependence exists between a pair of genes/nodes, its strength estimation can be biased by additional indirect relationships. 33 For this reason, correlation networks in general have many edges that reflect indirect relationships between pairs of genes, where no direct relationship exists. Finding direct relationships between genes is important when one attempts to identify causal gene regulators of a given biological process.
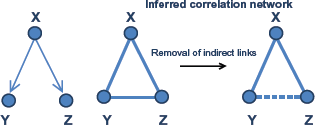
Removal of indirect links. As a demonstration, gene X can regulate the expression of both gene Y and Z. But there is no direct regulatory relationship between gene Y and Z. From the calculation of correlation of expression levels of three genes, correlations between gene X and Y, Z are observed as expected. However, genes Y and Z are also significantly correlated since they are both directly regulated by gene X. This correlation from common cause is called
Mathematically, direct effects can be defined as the association between two genes, holding the remaining genes constant.
34
An effect that is not direct is called an
To infer direct links between DEGs, we have been using the partial correlation coefficient.35,36 To calculate partial correlations, we use a method called the
Several other methods have been proposed to discriminate between direct and indirect links in covariation net-works.38–41 For example, a variant of the partial correlation, which we call the
Proportion of Unexpected Correlations (Improvement of Reconstruction and Error Evaluation)
A fundamental problem of the standard correlation network approach is that practical limitations in the numbers of sample measurements can lead to an unacceptably high error rate. Recently, our group has proposed a method called
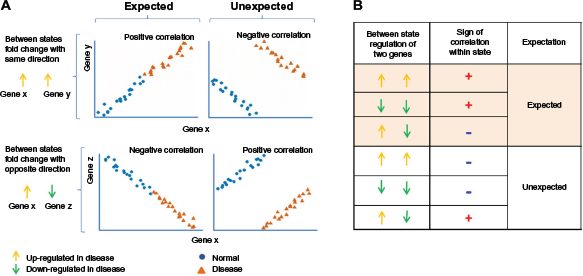
Illustration of expected and unexpected correlations. (
Meta-Analysis (Improvement of Reconstruction and Error Evaluation)
In omics-based network reconstruction, because of the large number of genes or variables measured (up to tens of thousands) and the limited number of samples (typically tens or hundreds), it is critical to assess the reproducibility of results. Although widely used methods (eg, FDR 44 ) enable accounting for multiple hypothesis tests, the discrepancy between the number of samples and variables inherent to omics datasets limits the sensitivity and specificity for detecting edges through network reconstruction.
In order to overcome this problem and to augment the statistical significance for the nodes and links in a network, meta-analysis can be employed. This statistical approach combines results from different studies in order to achieve reproducibility.
The studies can be obtained from standardized omics data repositories. Good examples of such repositories are the Gene Expression Omnibus (GEO) 45 and Array Express 46 (for transcriptomics and epigenomics datasets); PRIDE 47 (for proteomics datasets), the Human Metabolome Database 48 (for metabolomics datasets), and lipid MAPS 49 (for lipidomics datasets). Additionally, molecular interaction data from the BioGRID 50 or BioCyc databases 51 can be used as a prior for edge reconstruction.
In meta-analysis of multiple datasets - whether from publicly available datasets or experiments produced in the same lab - the strategy is usually the same. The datasets to be co-analyzed in a meta-analysis should be selected on the basis of their congruence with the central biological question of interest, and they should pass some predefined sample size and quality requirements (eg, number of measured/detected genes). After choosing the datasets, as a first step for meta-analysis we apply two filters: 1) the same sign of statistic (mean, covariance, or correlation) throughout all datasets (ie, if gene A is upregulated in case over control in dataset 1, it should have the same direction of regulation in all other datasets to pass the filter); 2) 
Differentially Coexpressed Gene Pairs (Evaluating Network Changes)
The networks discussed above model

(
In order to search for differentially coexpressed gene pairs, our group adapted a simple approach called differentially associated pairs (DAPs). 26 The DAPs algorithm is described in Supplementary File. In addition to DAPs, multiple methods/software have been developed to find the changing edges in gene expression networks (Table 1).26,56
Integrating Heterogeneous Omics Data Types: Inter-Omics Networks
The integration of different omics data types holds great promise for enabling more robust network reconstruction and detection of causal interactions in a particular biological context. For example, genome-wide measurements of epigenetic marks and transcriptome data can be combined to elucidate mechanisms of gene regulation.57–59 In cancer bioinformatics, integration of gene copy number data (chromosomal aberrations) and gene expression measurements has enabled the discovery of key drivers.4,60 And integration of metage-nomics data from gut microbiota with intestinal gene expression can reveal new mechanisms of crosstalk between microbes and their hosts. 6
Approaches for omics data integration generally fall into one of two modalities: first (and most prevalent) is integrating different types of data generated for a given gene/gene product. 61 In other words, a given node pertains to more than one network (eg, measurements of the copy numbers of gene A and transcript levels of gene A pertain to genomic and transcriptomic networks, respectively) (Fig. 5A).

Data integration for inter-omics network. (
The other type of integration makes an edge/link between two nodes from different omics networks. We call the result of such integration an
Network Interrogation
To gain maximal insights from a biological network that has been reconstructed as described above, systematic analysis of the network
Revealing Potential Mechanisms of a Biological Process or Disease
This goal is achieved by identification of pathways involved in the process, key regulatory nodes of those pathways, and interactions between identified pathways (including identification of nodes in network responsible for the interaction).
Which Functional Pathways are Involved?
Finding dense subnetworks (ie, modules or clusters) Figure 6A. From a functional standpoint, subsets of genes that are highly interconnected in the correlation network (modules 63 ) are often involved in similar biological processes. Tools for identification of modules include MCODE, 64 cfinder, 65 and graph clustering (MCL). 66 A key advantage of network module analysis (vs direct clustering of genes from the data) is that, while modules would include genes up- and downregulated that correspond to potential stimulatory and inhibitory relations within a given functional pathway, traditional clustering approaches would group genes with similar behavior, thus separating up- and downregulated genes from the same pathway into different clusters. In addition, network reconstruction has an advantage over traditional gene-level clustering analysis in that the network provides insight into which subnetworks interact with each other and which nodes/genes might mediate such interactions. 67

Network interrogation. (
Enrichment Analysis with External Data
(eg, Gene Ontology) Figure 6A. Once genes that work together (modules) are identified, the next step is to infer their biological functions. This is usually performed by using literature-curated, gene-centric biological knowledge bases that connect genes to functional categories (
Key Regulators of Pathways/Modules
Identifying the key molecular regulators of the biological response or system under study is often a primary goal in omics studies, especially those with a tractable cellular model where molecular or genetic perturbations can be introduced. There are two major complementary strategies for finding key regulators in covariation networks: 1) using network topological properties, and 2) incorporating additional data into networks that provides information about causes of regulation for some nodes in a network Figure 6D.
Topological properties that have been described to date as pointing to key regulators mostly define different measures of the connectivity of a node. Those properties are the degree and centrality measures, such as betweenness centrality, closeness centrality, and eigenvector centrality. Nodes with high betweenness centrality (the so-called bottlenecks) have been shown to be predictive of gene essentiality.
72
For example, such topological characteristics have been found to be associated with genes that are critical for pathogen virulence
73
and with genes that are targets for hepatitis C virus.
74
The estimation of these parameters is a straightforward and be easily accomplished using the Cytoscape plug-in called
Integrating Additional Information in Order to Find Causes of Regulation
It is axiomatic that a gene-gene network that has been reconstructed based on correlation analysis does not discriminate between direct regulation and
Integration of information about binding sites (or computationally predicted binding sites) of transcription factors into covariation networks is a particularly powerful approach, 77 because the direction of causality for a connection between a transcription factor and a target gene is presumed to be known. While computational analysis of transcription factor binding site (TFBS) databases (such as TRANSFAC) can suggest the possibility of regulation by a given transcription factor, omics approaches for identification transcription factor binding sites such as ChIP-Seq provide more definitive genome-wide location information for the transcription factor in an investigated sample. The directionality information provided by those methods can be incorporated into network interrogation to generate more accurate prediction of key regulators. 78 miRNAs are another important class of gene expression regulators that modulate (primarily downregulate) expression of target genes either by inhibiting translation or promoting mRNA degradation. In the past few years, ~1,881 miRNA genes have been identified in humans (according to miRBase, http://www.mirbase.org/cgi-bin/mirna_summary.pl?org=hsa), and knowledge of miRNA-target interactions is accumulating both by experimental validation and computational prediction.79,80 More accurate genome-wide miRNA target sequence location information allows the possibility of generating an miRNA-mRNA regulatory network, which could provide a more complete view of regulatory relationship in biological process. In a recent work, Sumazin et al integrated gene and miRNA expression data from sample-matched datasets and constructed a comprehensive miRNA-gene interaction network, inferring that phosphatase and tensin homolog (PTEN) is a key regulator of gliomagenesis. 2
Integrating multiple types of data simultaneously can increase the precision of computational predictions. For example, one of us has reported that “using motif scanning and Histone acetylation local minima, improves the sensitivity for TF binding site prediction by approximately 50% over a model based on motif scanning alone”. 57 In another work, Yang et al integrated gene expression with gene copy number alternation, DNA methylation, associated miRNA expression, and miRNA target prediction to identify key regulatory miRNA genes that regulate ovarian cancer development and then experimentally validated the function of one predicted miRNA gene. 3 In practice, multiple tools have been developed for the integration of different resources of information to infer network and/or identification of key regulators (Table 1).
How the Pathways Interact
As networks represent models of global changes in biological system, they usually contain several groups of genes exerting specific biological functions. Cooperation of these functions/pathways plays an important role in regulating biological processes. Thus, a transcriptional network can be viewed as a group of interacting pathways/modules (meta-modules) rather than interacting individual genes. 81 Studying the interaction between modules, thus, will provide us with a higher order view of biological system (see forest, not just trees) and understanding of causal relationship between functions.
In order to investigate the behavior of the pathways, a dimension reduction procedure can be used that transforms expression values of all genes in a given module into one representative value for each sample. One such procedure is to reduce the expression profiles of all of the genes within a module into a single
As an alternative to the eigengene approach, multiple methods have been proposed to calculate enrichment of links between members of separate pathways to identify cross-talking pathways based on diverse types of interactions such as protein interactions, coexpression, etc.83–85 Once a relationship between modules has been established, the next question is which nodes or genes are responsible for the interaction. Although multiple genes could act as mediators of interaction between two pathways, their relative importance can be different. Few approaches have been developed to find which nodes are critical for crosstalk between different modules in a network. Multiple sources of data are integrated to identify interactions between cancer-related pathways, and key regulators are identified (genes that are significantly altered for at least one molecular level) mediating those interactions. We have developed an approach that identifies nodes in a network responsible for interactions between modules that potentially correspond to genes regulating crosstalk between pathways represented by these modules. The approach is based on the idea that the genes that are in the shortest paths between modules should be more important in controlling perturbation from one pathway to another, mediating intermodule signaling or regulation. Several centrality measures have been proposed to evaluate the importance of nodes in a network.
86
Among those, betweenness centrality measures the importance of a node in acting as a bridge between any nodes within a network.
74
We modified standard betweenness centrality
87
to adapt to the case of interaction between two defined subnetworks and to specifically address the question of which nodes belonging to 
Revealing Function of Individual Node in the Network
While most of our knowledge about gene functions is based on detailed and thorough gene-centered laboratory research, there are still genes whose functions have been less studied; network biology offers a novel way to infer functions for such genes. It uses an idea that genes that are located closely in a network may share a function. This principle is frequently called
Besides identifying functions of individual nodes, generations of new ontology systems based on networks or pair-wise similarities were proposed Figure 6C. 93 Interestingly, besides demonstrating a high level of consistency with existing ontologies, they provide solutions for situations when standard approaches (ie, knowledge-based approaches) fail to reflect comprehensive biology. 94 Indeed, some terms/categories that were missing in the standard GO and inferred by a network approach were submitted to the GO Consortium and incorporated into the ontology.93,95
Network Cross-Species Conservation
An important facet of network interrogation is the assessment of evidence for network function. Just as cross-species comparison is a core strategy for elucidating novel protein function (eg, BLAST), cross-species comparison of network structure can reveal functions for network subgraphs that might not have been evident from sequence-level conservation of individual network components. In practice, subgraphs of the novel network (and in some approaches, constituent protein sequences) are used as keys to search for structural and component-sequence similarity to subgraphs in another species by searching for parsimonious subgraph-to-subgraph mappings (called a local network
Different Biological Problems and Some Perspectives
Some biological questions that can be addressed within the framework of network analysis remained beyond of the scope of this review. For example, one can try to evaluate the number of nodes needed to be perturbed in order to achieve a transition from one state of biological system to another. This measure of network controllability 101 (number of needed nodes), although seemingly theoretical, can have very practical implications. On one hand, if a few nodes can govern a regulatory network modeling a disease, a gene perturbation/gene silencing approach can be a good strategy for treatment. On the other hand, if a large proportion of nodes in a network have to be modified in order to achieve recovery, then a different pharmaceutical strategy using compounds that can simultaneously affect multiple molecular targets should be followed.
Furthermore, some mathematical properties observed in biological networks such as
Biological Example: Transkingdom Network for Interrogation of Host-Microbe Interactions
In our recent work, 6 by applying network analysis we studied the effects of antibiotics on the gut microbial community (microbiota) and on the host (mouse). The major outcome of this study - which was based on network analysis - was the identification of specific mammalian processes that are affected by antibiotics (ABx) and the identification of the microbes (including some microbial genes) that contributed to these effects. Importantly, a big part of the critical findings of mechanisms of effects of ABx was revealed using network analysis and could not be predicted based on existent knowledge in the field.
Below we have outlined step by step the analysis employed in this study, which consisted in the reconstruction of mammalian transcriptomic and microbial genomics networks, integration of these two networks into one transkingdom network, and its interrogation that led to biological insights that have been validated experimentally.
The gene expression raw data were normalized using BRB Array Tools using the LOWESS smother. Next we compared gene expression between control and ABx-treated mice on two genetic backgrounds and found 1,583 differentially expressed genes with an FDR cutoff of 10% (see section Discovery of differentially expressed genes).
Reconstruction of Gene Expression Network
To reconstruct the transcriptomic network, we calculated correlations in four groups of control mice. We performed meta-analysis (see section Meta-analysis) of gene-gene correlations and removed unexpected correlations (see section Proportion of unexpected correlations) and obtained a network of 1,275 nodes and 13,714 links with an FDR cutoff of 5%.
Identification of Subnetworks
MCODE network clustering identified two major subnetworks: one (631 genes) that was dependent on ABx-resistant microbes, and the other (77 genes) dependent on microbiota. 6
Data Mining of Gene Expression Subnetworks
Functional annotation enrichment analysis using the web tool DAVID revealed that the first subnetwork was enriched for mitochondrial functions including genes coding for electron transport chain, oxidation-reduction, ATP biosynthesis, and cellular and mitochondrial ribosomes, while second one was enriched for annotations related to immune function.
Finding Microbial Genes Enriched by Antibiotics
We have compared copy numbers of microbial genes (annotated in SEED 104 ) between control ABx-treated mice and found 4,523 bacterial genes with differential abundance between ABx and controls.
Reconstruction of Microbial Gene Network
In order to identify the ABx-resistant microbes or microbial genes that influence the host, a covariance network was constructed for the 1,689 microbial genes that were enriched by antibiotics in two mouse strains (Swiss Webster, C57BL6/J). This analysis resulted in a network with 1,143 nodes connected by 23,429 edges (combined FDR < 0.0001).
Reconstruction of Transkingdom Network
In order to reveal ABx-resistant microbes and their genes that affect the host, we reconstructed transkingdom network. For this, we calculated the correlations between microbial genes that were part of the microbial network with mouse gene expression from the second subnetwork (steps 3, 4). The correlation was calculated using measurements in the two ABx-treated groups of mice separately (C57BL6/J and Swiss Webster) and the resulting

Transkingdom network resulting from network analysis. Transkingdom network includes microbial genes (red) and host (mouse) genes (green). A key regulator is identified as a gene within top 1% of bipartite betweenness centrality is LasR (yellow). Two microbial gene subnetworks, indicated by blue circles, are enriched with genes from
Using MCODE, we found two major microbial subnetworks (101 and 60 nodes) linked to the host part of the transkingdom network. The genomes enrichment analysis (see Materials and Methods of REF for details)
6
indicated that two microbes (
Finding Bottleneck Microbial Genes(Betweenness Centrality)
By applying bipartite betweenness centrality analysis, 105 we have revealed five top microbial genes as potentially critical for ability of microbes to affect the host.
Note: One of the microbes (
Conclusion
In this review, we have described how network analysis can help us to answer different questions commonly asked in biological research. We have also provided a detailed algorithm for this analysis, including approaches employed by our group as well as frequently used by the network-biology community (Table 1).
Author Contributions
NS and AM contributed to the conception of the work. XD AY, SR, LT, AM contributed to the design of the work. XD, AY, SR, LT and AM contributed to the acquisition, analysis, and interpretation of data for the work. XD, AY, SR, LT and AM drafted the work. XD, AY, SR, LT, NS and AM revised the paper. XD, AY, SR, LT, NS and AM approved the final version to be published.
Footnotes
Acknowledgment
We thank Khiem Lam for editing this paper.
Supplementary Material