
Abstract
Metal distributions in lakes surrounding Kostomuksha iron mine and ore dressing mill were explored to study the effects of the mill on the state of the lakes. Both surface water and 10 cm sediment core samples were taken from six lakes in the Russian side and another two in the Finnish side at a maximum distance of 70 kilometres from the plant. Concentrations of thirteen metals, phosphorus and sulphur were determined in waters and sediments by ICP-MS after filtration of the water samples and acid digestion of the sediment samples. No increase of these elements was observed in lakes in southwestern direction towards Finland where air transport was the only pathway. In the northwestern direction where there are also water releases from a waste pond of the plant increasing concentrations of Ca, Mn, S, Fe and As towards the plant were seen both in water and sediments phases. This was also the trend for Na, K and Mg in water and for Zn, Pb, Cd and Hg in the sediment. No systematic change was seen in case of Al, P and Ni. It is likely that elevated water concentrations of at least K, S and As are due to water releases from the waste pond but for other elements the source is not quite evident.
Keywords
Introduction
Kostomuksha iron mine and ore dressing mill are located in northwestern Russia 40 kilometres to the east of Finnish border. Mining and refining activities at the plant started in 1982. The magnetite ore initially contained approximately 1200 million tonnes of iron, 510 million tons of which has been used so far. Annually over 7 million tonnes of pellets containing 65% of iron are produced. In 1985-1990 the SO2 emissions of the mine and mill were over 60 000 t/year, but they have decreased being now approximately 30 000 t/year. Dust emissions have been rather stable from 1984; approximately 7000-8000 t/year. In addition to sulphur the mill has released metals to the environment both through air and water pathways 1 .
The purpose on this study was to find out the effects of metal releases from the Kostomuksha iron mine and ore-dressing mill on the pollution of lakes in the Kostomuksha area in northwestern Russia and in the Kuhmo area in northeastern Finland. Both air and water transport of metals was explored. Surface water and bottom sediment samples were collected in 2007 from eight lakes at a maximum distance of 70 kilometres from the plant. Samples were taken from two directions. The first direction, representing air transport only, was to the southwest where samples were taken from two lakes on the Russian side and from another two on the Finnish side. The second direction, representing both air and water transport, was to northeast of the mill in the Kentti River (p. Kenti in Russian) system; a series of lakes and rivers leading to Lake Keski-Kuittijärvi, some 60 kilometres northeast of Kostomuksha. The start of this stream is Lake Kostamusjärvi that has been used as a dumping site for waste effluents from the mill for the last 30 years. In addition, the waters pumped from the quarry are directed into the lake. Lake Kostamusjärvi (area 34 km2) has been blocked with dams but annually 2 million cubic metres of water have migrated through the dams into the Kentti water system. Due to filling of the lake in 1994 annually 10-20 million cubic metres of water has been passed from the lake into the Kentti river system. 2 Effects of the water releases from the plant have been studied in the 1990s by Lozovik et al.2,3 These studies, however, included only a few metals and only surface sediments were collected which did not allow conclusions to be drawn of the long-term accumulation of metals in sediments in this area. In our study, concentrations Al, As, Ca, Cd, Cu, Fe, Hg, K, Mg, Mn, Na, Ni, P, Pb, S, V and Zn in water and sediment cores were determined. Of these, Na, K, Ca and Mg are common nontoxic metals both in waters and sediments. Al, Fe and Mn are prevailing metals in soils and sediments and are not known as toxic metals at ordinary concentrations. Most toxic of these metals are As, Ni, Cd, Pb and Hg while Cu and Zn are toxic only at relatively high concentrations. The maximum permissible concentration in the EU directive 98/83/EC for drinking water is 1 μg/l for Hg, 5 μg/l for Cd, 10 μg/l for Pb and As, 20 μg/l for Ni and 2000 μg/l for Cu.
Experimental
Sampling sites
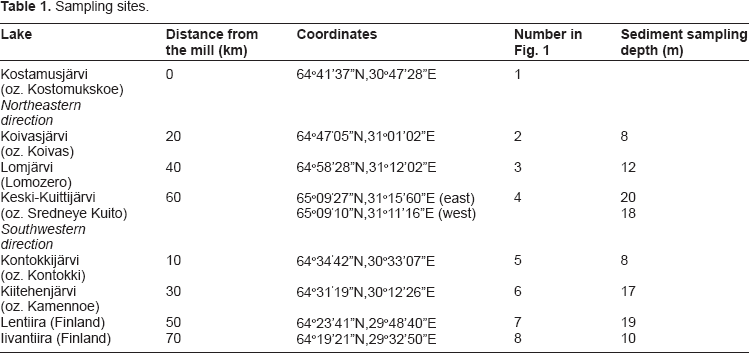
Water and sediment samples were taken from eight lakes (Table 1, Fig. 1). Only water samples were taken from Kostamusjärvi. From each site, two parallel samples were taken close to each other. At Keski-Kuittijärvi, the sampling sites were not parallel but samples were taken from both sides of an island in front of town Kalevala. The western side was expected to be nonaccessible to water transport of metals via the Kentti stream since the stream comes to Keski-Kuittijärvi on the eastern side of the island and water flows from this point to the east towards the Kemi River. In this paper the Finnish names of the lakes and rivers in both countries are used and the Russian names of the lakes located on the Russian side are given in Table 1.

Water and sediment sampling sites. 1 Kostamusjärvi, 2 Koivasjärvi, 3 Lomjärvi, 4 Keski-Kuittijärvi, 5 Kontokkijärvi, 6 Kiitehenjärvi, 7 Lentiira, 8 Iivantiira.
Sampling sites.
Sampling and Sample treatment
Two 100 ml parallel samples of surface water were taken into plastic bottles and they were immediately acidified with 1 ml of 2M nitric acid. In the laboratory at the University of Helsinki the water samples were filtered through a 0.45 μm filter for metal analysis. Bottom sediment cores were taken with Limnos corer. For sediment sampling the sediment accumulation basin in each lake was identified with an echo sounder. The diameter of the corer was 9.3 cm. The upper 10 cm parts of the cores were sliced into 1-cm vertical sub-samples and placed into plastic containers. In the laboratory at the University of Helsinki the samples were weighed and dried with a freeze-drier and reweighed to calculate the water contents. Dried samples were wet-digested according to EPA 3051A standard using CEM Mars 5 microwave oven and Romil Superpure HNO3 (67%). Prior to microwave leaching of the sediment samples, their 137Cs activity concentrations were measured with a gamma spectrometry using a Na(I) detector.
Elemental Analyses and Quality control
Leachates from the micro wave digestion of sediments were diluted to 5% HNO3 (v/v) and analyzed according to ISO 17294-2 standard using an Agilent 7500ce ICP-MS. Analyzed elements included Al, As, Ca, Cd, Cu, Fe, Hg, K, Mg, Mn, Na, Ni, P, Pb, S, V and Zn. As a quality control 8% of the samples were replicates and blanks and a certified lake sediment reference LKSD-4 was analyzed along with samples. Results from the sediment reference are given in Table 2. Regression analysis between the replicate samples gave R 2 values in the range of 0,955-0,999, only Hg gave R 2 value 0,530.
Quality control results of the sediment analyses.

Water analyses were performed according to ISO 17294-2 standard with Agilent 7500ce ICP-MS. Analyzed elements included Al, As, Ca, Cd, Cu, Fe, K, Mg, Mn, Na, Ni, P, Pb, S, V and Zn. VKI QC Metal LL1 (batch VKI-12-2-0398) and VKI QC Metal LL2 (batch VKI13-2-1296) and blanks were used for quality control of the trace analysis with the results given in Table 3.
Quality control results of the water analyses. All values are in ppb.

Results
137Cs Profiles in Sediment Cores–-Sedimentation rates
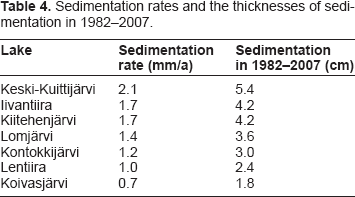
Activity concentration profiles of 137Cs in sediment cores were determined to get information on the sedimentation rates. There are two sources of 137Cs in this area: global nuclear weapons test fallout in the 1950s and 1960s and the fallout from Chernobyl accident in 1986. The former consists of approximately 1 kBq/m2 in this area. The total amount of 137Cs in the sediment cores averaged 3.9 kBq/m2 (range 2.1-5.9), which is clearly higher than the amount originating from the nuclear weapons test fallout. Based on this it is assumed that the peak values are from the Chernobyl fallout and thus the depths where they are found represent year 1986. The sedimentation rates (mm/a) derived from the peak values and the thicknesses of sedimentation after commissioning of the mill in 1982 are listed in Table 4.
Sedimentation rates and the thicknesses of sedimentation in 1982-2007.
Metal Concentrations in water
Metal Concentrations in Water in Kentti stream
Metal concentrations in lake waters of the Kentti system are shown in Table 5. The distances from Kostamusjärvi represent Koivasjärvi (20 km), Lomjärvi (40 km) and Keski-Kuittijärvi (60 km). There is a strong negative correlation (correlation coefficient -0.974 to -0.995) between the distance and water concentration of Na, K, Mg, Ca, Mn and S. Their concentrations are systematically decreasing when going farther away from Kostamusjärvi, which suggests that the effluent releases from Kostamusjärvi are responsible for the elevated concentrations of these elements in Koivasjärvi and in Lomjärvi. The correlations for Fe, As and Ni are not quite as strong (correlation coefficient -0.860 to -0.903) but also in their case the effect of increased metal concentrations in Koivasjärvi and Lomjärvi are rather clear.
Metal concentrations in water in Kentti water stream.
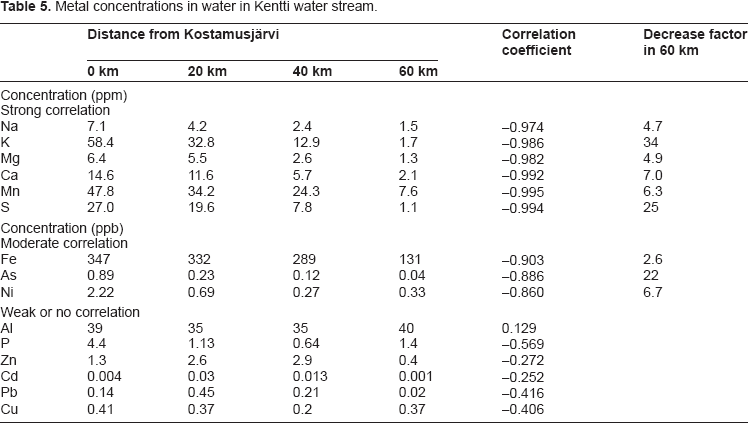
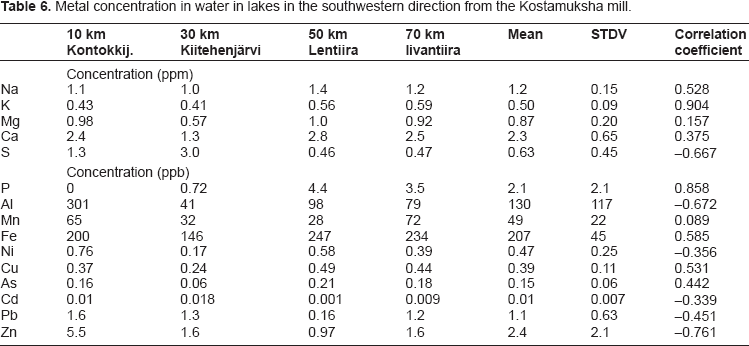
The metal concentrations in Keski-Kuittijärvi are not elevated compared to lakes in the other studied direction to southwest (see Table 6). The levels of Al are more or less identical in all studied lakes. For P, Zn, Cd, Pb and Cu the correlation coefficients are weak and the decrease of their concentrations with distance is not evident. The concentrations of Zn, Cd and Pb, however, are clearly lower in Keski-Kuittijärvi than in lakes closer to the release source. Decreases in concentrations from the Kostamusjärvi to the Keski-Kuittijärvi is highest for potassium, sulphur and arsenic being 34-times, 25-times and 22-times higher in the former compared to the latter. For sodium, magnesium, calcium, manganese, iron and nickel the decrease is lower, 2.6-7.0-fold. In earlier studies2,3 similar values have been reported for K, Ca, Mg, S and Ni but no data for other metals were given. Concentrations of Cd, Zn, Cu, Ni, As and Pb in Lomjärvi and in Keski-Kuittijärvi are more or less identical with the values in lakes in northern Finland while As and Ni concentrations are clearly elevated in Kostamusjärvi and Koivasjärvi.4,5
Metal concentration in water in lakes in the southwestern direction from the Kostamuksha mill.
Metal Concentrations in Water in the Southwestern direction
Table 6 shows the water concentrations of metals in the southwestern direction where air transport from the plant is the only pathway to these lakes. The results indicate that the air releases from the mill do not result in any systematic increase in metal concentrations in lakes. Only in case of sulphur the concentrations are higher in lakes in the Russian side compared to their concentrations further away in the Finnish side. An earlier study also did not observe any elevated metal concentrations in lakes in this direction from the mill. 3 Compared to the lakes in northern Finland, concentrations of Cd, Zn, Cu, Ni and As were more or less the same in this direction but Pb concentration was somewhat higher than in northern Finland.4,5
Metal Concentrations in sediments
Metal Concentrations in Sediments in Kentti stream
In the water transport route from Kostamusjärvi to Keski-Kuittijärvi there is a very clear decreasing trend in sediments in case of Zn, As, Pb, Cd and Hg and somewhat weaker trends in case of Fe, Mn and S (Table 7) which indicate that the Kentti stream has transported these metals at least to Koivasjärvi and Lomjärvi where they have deposited to the bottom sediments. Also, in case of Na, Mg and K there was seen a clear increasing trend in sediment concentration with distance. This will be discussed later. Earlier in 1999, surface sediment (0-2 cm) was studied in all lakes in Kentti river system but only concentrations of Fe and Mn are given. 2 In Koivasjärvi and Keski-Kuittijärvi the concentration of iron was 183000 ppm and 81000 ppm, respectively, and those of manganese 8900 ppm and 3600 ppm, respectively, which are somewhat different from our study but in the same order of magnitude.
Metal concentrations in sediments in Kentti water stream. Concentrations (ppm) are mean concentrations in the upper 10 cm layer.

Metal concentrations in the two sediment samples taken from different locations at Keski-Kuittijärvi did not differ practically at all from each other. The mean ratio of the metal concentrations of the sediment profile taken from eastern side of the island compared to those of the profile from western side was 0.93 ± 0.19 (standard deviation). This gives further indication that no water transport of metals from Kostamusjärvi to Keski-Kuittijärvi has taken place. The only exception in Keski-Kuittijärvi was manganese, the concentration of which was 13-times higher on the eastern side of the island which probably was caused by natural processes. Manganese was excluded from calculation of the mean value given above.
Metal Concentrations in Sediments in the Southwestern direction
In the air transport route to the southwestern direction there are no decreasing trends in case of any metals studied (Table 8). Not even the closest lake to Kostomuksha plant, Kontokkijärvi, shows any elevated metal concentrations compared to lakes further away from the plant. This indicates that the aerosol particles do not contaminate the lakes with respect to metals at distances higher than ten kilometres at most. In both studied directions the metal concentrations in sediments were fairly low compared to lake sediments in Kola Peninsula, Russia, close to the Nikel and Monchegorsk Cu/Ni-smelters.6,7 In the Kostomuksha area, the metal concentrations in sediments are at the same level as in sediments in Lake Umbozero, some 60 kilometres east of Monchegorsk, with the exception that in Umbozero sediments there is a clear increasing trend in the upper few centimetre layer 8 while no increasing trend was seen in Kostomuskha area sediments as will be seen in the next section.
Metal concentrations in sediments in southwestern direction. Concentrations (ppm) are mean concentrations in the upper 10 cm layer.

Temporal Development of Metal Concentrations in sediments
Figure 2 shows the vertical distribution of metals in sediment cores of two lakes Koivasjärvi and Kiitehenjärvi. Data for other lakes are given in reference. 9 In addition, Table 9 shows the ratios of mean metal concentrations in the upper layer representing the time period of Kostomuksha plant operation 1982-2007 to those in the preceding layer representing the 25 years’ time period before the commissioning of the plant. Thus the table gives information on possible metal contamination in sediments due to discharges from the plant. As can be seen both from Figures 2 and Table 9, there is no systematic increase of metal concentrations towards the sediment surface. For manganese, however, there is clear increase towards the surface layer, which probably was caused by natural manganese cycling.

Metal distribution in sediment cores from Kiitehenjärvi and Koivasjärvi.
Ratios on metal concentrations in the sediment layers from years 1982-2007 to those in the layer from years 1957-1982.

Cd, Hg and Pb behaved in similar manners to each other in sediments in all lakes (Fig. 3). Their concentrations increase from the bottom of the cores up to 3-4 cm depth where they either level off or start to decrease. The origin of these metals is probably long-distance air transport from the use of leaded petrol (Pb), from coal power production (Hg) and from production of metals other than iron (Cd). Due to the decline of their emissions in Europe their concentrations in sediment have started to decrease accordingly. There were some exceptions in this trend: concentration of lead in Lentiira and Keski-Kuittijärvi and concentration of mercury in Kontokkijärvi were highest in the surface sediment layers.

Depth profiles of Cd, Pb and Hg in sediments. The three curves at the bottom show the mean concentrations of Cd, Pb and Hg in all seven lakes.
The lack of increase in metal concentrations in the upper sediment layer suggests that the Kostomuksha plant has not resulted in a dramatic, if any increasing metal load to the bottom sediments. This is somewhat contradictory to the clear increasing trends of water and sediment concentrations of many metals in Kentti river towards the plant. A possible explanation is that the metal load to the Kentti river system is in most cases of natural origin being higher in upstream lakes compared to lakes further downstream.
Comparison of Metal Concentration Trends in Water and Sediment in the Kentti River system
Table 10 compares the trends of metals concentrations in Kentti river system both in water and sediment phases. Metals can be classified in four categories.
Trends of metal concentrations in water and in sediments in Kentti river system. Negative correlation: decreasing trend with the distance from Kostamusjärvi. Positive correlation: increasing trend. Strong correlation: Spearman correlation coefficient 0.90-1.00 (positive or negative); moderate correlation: 0.60-0.90 (positive or negative); weak correlation: 0.20-0.60 (positive or negative); no correlation -0.2-0.2.

The first category is formed by the soluble matrix elements of Na, K and Mg, the concentrations of which in water are systematically decreasing with distance from Kostamusjärvi but the situation vice versa in the sediment phase. Decrease of water phase concentrations is rather evident: releases from waste pond and subsequent dilution. Concentration increase in the sediment phase is, however, not that clear. It is rather improbable that these highly soluble elements would enrich in the downstream sediments. It looks more probable that changes in the upstream chemistry prevent their attachment on the particles and ensuing deposition into bottom sediments.
The second category is Ca, Mn, S, Fe and As, the concentrations of which are systematically decreasing with the distance from the waste pond in both phases. It is reasonable to assume that these elements are released from Kostamusjärvi and/or its surroundings and deposited in the upstream lakes.
The third category is formed by Zn, Pb, Cd and Hg the concentrations of which in the water phase is more or less constant in all studied lakes but their concentrations in the sediment phase decreases with distance from the source. Decrease in sediment phase indicates that their source is in the upstream. These elements are all highly insoluble and readily adsorbed on particles present in waters and thus it is assumed that their water phase concentrations are saturation values.
The fourth category is Al, P and Ni in case of which no systematic changes were observed.
Conclusions
Results of this study show that there is no indication of increased metal concentrations in water nor in sediment in lakes affected by air emissions of the Kostomuksha ore dressing mill, at least not in the distance more than ten kilometres. The Kentti River system where there have been effluent releases from the waste pond of the plant is clearly contaminated with metals up to the distance of forty kilometres. Concentrations of Na, K, Mg, Ca, Mn, S and probably also those of Fe, As and Ni in water are clearly elevated in the lakes closer to the plant. All metal concentrations are clearly below maximum permissible drinking water levels. In sediment, the increasing trend towards the plant is clear for Zn, As, Pb, Cd and Hg and somewhat weaker for Fe, Mn and S. No systematic increase of most metals in the Kentti river lake sediments towards the surface was observed which questions the role of effluent releases from Kostamusjärvi as a source of metals in the lake sediment. Based on these two observations, decrease of Zn, As, Pb, Cd, Hg, Fe, Mn and S concentrations in the sediment with distance from the plant and the fact that no increase towards the sediment surface was seen, it looks more reasonable to assume that leaching from upstream lands is the source for most metals. In case of K, As and S the source, however, is most likely the waste pond. In all lakes the concentrations of Zn, Pb and Hg have a maximum in sediments at the depth of 3-4 cm, which reflects reductions in their emissions into the atmosphere from various long distance sources.
Disclosure
This manuscript has been read and approved by all authors. This paper is unique and is not under consideration by any other publication and has not been published elsewhere. The authors and peer reviewers of this paper report no conflicts of interest. The authors confirm that they have permission to reproduce any copyrighted material.