
Abstract
A stability-indicating assay by reversed-phase high performance liquid chromatography method was developed and validated for the determination of sulthiame (STM). The chromatographic separation was achieved on a reversed-phase NovaPack C18 column and an isocratic mobile phase consisting of deionized watenmethanol (70:30, v/v). The flow rate was 1.0 mL/min (ultraviolet detection at 210 nm). The STM was separated within 2.83 min. The linearity of the method was demonstrated in the range of 20.0-200.0 μg/mL and a coefficient of determination of
Introduction
Sulthiame (STM) is a sulfonamide and a central carbonic anhydrase inhibitor found to be effective for both partial and generalized seizures. It is widely used as an antiepileptic drug in some European countries and Israel for drug-refractory patients.
1
3
STM has been reported to reduce seizure activity and electroencephalographic discharges in patients with centrotemporal spikes, partial epilepsy of childhood including atypical forms, and refractory epilepsy of adults.
1
4
Some publications have reported adverse effects, such as impaired memory and attention skills, respiratory and metabolic acidosis, crystalluria, hyperpnea, and acroparesthesia.
5
8
Some studies have suggested that STM acts as a membrane-permeant carbonic anhydrase inhibitor whose beneficial effect on epileptiform activity results in part from a modest intracellular acidosis in central neurons.
9
STM (Fig. 1) occurs as white crystals or crystalline powder and is highly soluble in
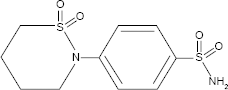
Chemical structure of sulthiame.
Methods
Reagents and solutions
STM standard powder was supplied by LGC GmbH (Luckenwalde, Germany; lot 66872). The pharmaceutical dosage tablets were purchased from Inresa (Ospolot® 50 mg; Barthenheim, France, lot 14005783). Methanol (HPLC grade) was obtained from Merck (Darmstadt, Germany). Deionized water was purchased from Fresenius (Sèvres, France; Versylene®). Sodium hydroxide (NaOH) and hydrochloric acid (HCl) were obtained from VWR (Fontenay-sous-Bois, France). Hydrogen peroxide was obtained from Gifrer (Decines, France).
STM stock standard solution
The STM stock solution (1000 μg/mL) was prepared by accurately weighing 10 mg of STM in a 10 mL volumetric flask. The volume was made up to the mark with methanol. The stock solution was stored at 2-8°C. Working solutions for HPLC injections were prepared on a daily basis from the stock solution.
HPLC instrumentation and conditions
The HPLC Dionex Ultimate 3000 system (Thermo Scientific, Villebon sur Yvette, France) contained an integrated solvent and degasser SRD-3200, an analytical pump HPG-3200SD, a thermostatted autosampler WPS-3000TSL, a thermostat-ted column compartment TCC-3000SD, and a diode array detector MWD-3000. Data acquisition (eg, peak time and area) was carried out using in-line Chromeleon® software (V6.80 SP2; Thermo Scientific). The eluent was monitored at 210 nm. Chromatographic separation was achieved at 25°C using a reversed-phase Nova-Pak C18 column (60 Å, 4 μm, 4.6 mm × 150 mm; Waters, Guyancourt, France). The mobile phase was performed using deionized water and methanol (70:30, v/v). The overall run time was five minutes, and the flow rate was 1.0 mL/min. The injection volume was set at 25 μL.
Method validation
System suitability tests
To ensure that the complete testing system would be suitable for the STM assay, system suitability tests were used to verify the resolution and reproducibility of the chromatographic system. The components of system suitability consisted of system performance (eg, replicate injections of standard) and chromatographic suitability (eg, tailing factor, column efficiency, and resolution of peak).
Specificity
To evaluate the specificity of the method, the ingredients of a tablet were tested to the HPLC column (hypromellose, lactose, macrogol 4000, stearate magnesium, cornstarch, silica, talc, and titanium dioxide), and the specificity was checked with possible degradation impurities. A tablet was crushed to a fine powder and dissolved in methanol. The suspension was centrifuged at 5000 rpm and diluted in methanol to a 100 μg/mL final concentration. The sample was injected into the HPLC column and compared to a standard chromatogram. Spectra for samples were also compared.
Linearity
To establish the calibration curve, appropriate volumes of the stock solution were diluted with deionized water to yield 20, 40, 60, 100, 150, and 200 μg/mL. Six replicates of each concentration were independently prepared and injected into the chromatograph. The peak area of the chro-matograms was recorded. The calibration curve was plotted by measuring the concentration on the
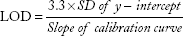
Limit of detection and limit of quantification
The limit of detection (LOD) and limit of quantification (LOQ) of the STM assay were determined by calibration curve method. LOD and LOQ were calculated by using the following equations:
Precision
The intraday precision was determined by measuring STM samples of 50, 80, and 120 μg/mL, injected five times on the same day. The interday precision was estimated by injecting STM samples prepared at the same concentrations on three different days by different operators. The relative standard deviation (RSD) of the assay values was calculated.
Accuracy
The accuracy of the assay method was evaluated at different levels (25%, 50%, 80%, and 100%) and the mean recovery of STM of the target concentration (100 Llg/mL) was calculated and accepted with 100% ± 2%.
Robustness
HPLC conditions were slightly modified to evaluate the robustness of the analytical method. These changes included the flow rate (0.8, 0.9, 1.1, 1.2, and 1.3 mL/min), the detection wavelength (209, 211, 212, and 213 nm), the column temperature (23, 27, and 30°C), and the methanol proportion in the mobile phase (28% and 32%). The robustness of the method was studied by using six replicates at a STM concentration level of 100 μg/mL.
Solution stability
The solution stability of STM in the assay method was achieved by leaving both the sample and reference standard solutions in capped volumetric flask at room temperature for five days.
Assay of tablet formulation
Two commercial tablets totaling 50 mg (Ospolot) were crushed by a glass mortar to a fine powder. Powder equivalent to 10 mg STM was accurately weighed and dissolved in methanol in a 10 mL volumetric flask. The content of the volumetric flask was vortexed for five minutes.
Forced degradation study
Forced degradation study was performed to evaluate the stability-indicating method according to the ICH guidelines. 18
Alkaline conditions
To 200 μL of the drug solution at 1 mg/mL, 80 μL of 1 M NaOH was added, and the solution stored at 50°C for one hour. Before analysis, the solution was cooled to room temperature and neutralized with HCL. The solution was diluted with deionized water to reach a targeted concentration of 100 μg/mL.
Acidic conditions
To 200 μL of the drug solution at 1 mg/mL, 80 μL of 1 M HCl was added, and the solution stored at 50°C for one hour. Before analysis, the solution was cooled to room temperature and neutralized with sodium hydroxide. The solution was diluted with deionized water to reach a targeted concentration of 100 μg/mL.
Oxidation conditions
To 200 μL of the drug solution at 1 mg/mL, 100 μL of 3% H2O2 was added, and the solution stored at 50°C for one hour. The solution was diluted with deionized water to reach a targeted concentration of 100 μg/mL.
Sunlight degradation
A drug solution at 1 mg/mL was directly exposed to sunlight for 15 days.
Thermal degradation
A drug solution at 1 mg/mL was heated at 50°C for 48 hours, cooled, and used.
Results and Discussion
Analytical development method
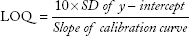
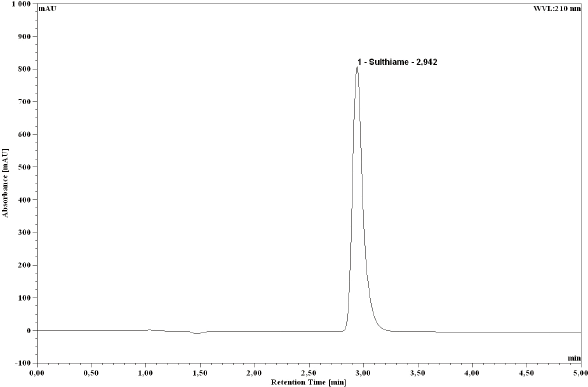
In order to achieve optimum separation, STM was injected into different mobile phase solutions mixing water and methanol at different proportions (50:50, 60:40, and 70:30) at a flow rate of 1.0 mL/min. Using the Nova-Pak C18 column, the optimum elution of STM was determined at 2.85 min with the mobile phase of 70% water and 30% methanol. The optimum ultraviolet absorption of the drug was obtained at 210 and 250 nm. The detector was set at 210 nm with a higher resolution than 250 nm detection. A typical chromato-gram obtained with the present method is depicted in Figure 2.
Typical chromatogram of sulthiame stock solution 100 μg/mL.
Method validation
System suitability
The system suitability tests were evaluated before performing the validation, and the calculated parameters are within the acceptance criteria. The tailing factor was 1.45, the capacity factor was 0.96, the number of theoretical plates was
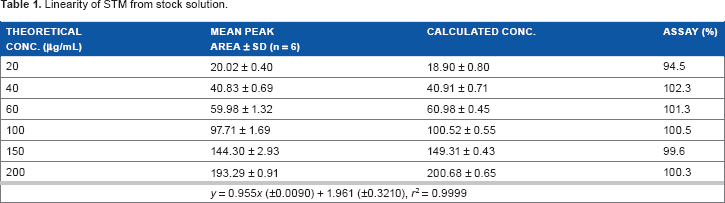
Linearity
The linearity range of STM was in the interval of 20-200 μg/mL. This was represented by a mean linear regression equation as follows:
Linearity of STM from stock solution.
LOD and LOQ
The determined values of LOD and LOQ were 4.15 and 9.47 μg/mL, respectively, calculated using slope and
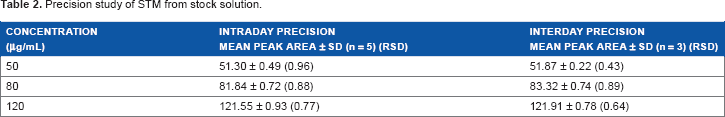
Precision
The results obtained for the intraday and interday precisions of the method were expressed as RSD values. The RSD ranges were obtained as 0.77%-0.96% and 0.43%-0.89% for intraday and interday precision studies, respectively (Table 2).
Precision study of STM from stock solution.
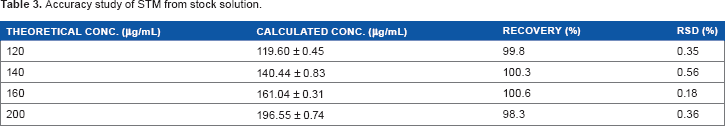
Accuracy
Known amounts of STM by volume were added to the solutions prepared from tablets and then diluted to yield the total concentrations of 120, 140, 160, and 200 μg/mL, as described in Table 3. The percentage recoveries were found to be 98.3%-100.7% with RSD ranges 0.18%-0.56%. The results of the recovery studies demonstrate accuracy of the proposed method.
Accuracy study of STM from stock solution.
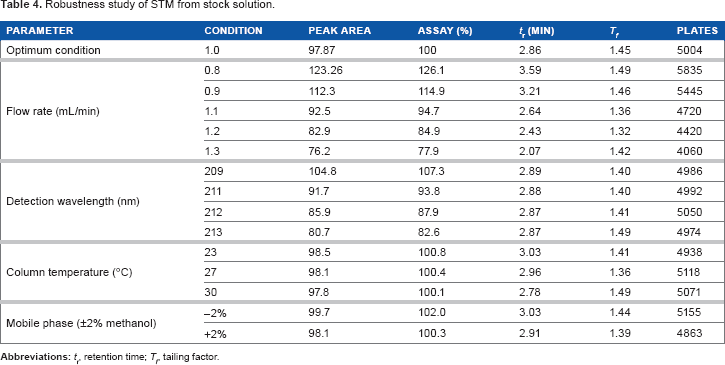
Robustness
Changes in mobile phase proportions and in column temperature did not affect the results from the assay of the test solutions. However, variations in flow rate and wavelength affected the percent recoveries of STM. These parameters need to be controlled. Variations in flow rate affected the number of plates of the column determining its performance and effectiveness. Variations in wavelength rapidly induced a decrease in the STM peak area. The results of the robustness study are presented in Table 4.
Robustness study of STM from stock solution.
Solution stability
No STM degradation occurred during the storage of the solution at room temperature for five days.
Forced degradation study
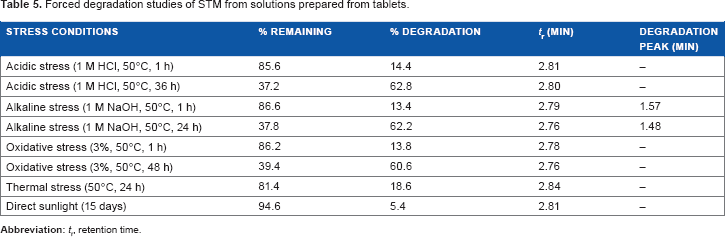
Forced degradation studies were performed to demonstrate the stability-indicating capability of the proposed HPLC method (Table 5). STM was found to be quite stable under exposure to direct sunlight exposition. Slight degradation of STM was observed upon exposure to acidic (14.4%), alkaline (13.4%), oxidative (13.8%), and thermal (18.6%) conditions. To evaluate STM degradation up to 50%, higher stress conditions were applied to the solutions prepared from tablet (Table 6). With these conditions, STM was strongly decomposed to 62.8% with acidic conditions (1 M HCl, 50°C, 36 hours), 62.2% with alkaline conditions (1 M NaOH, 50°C, 24 hours), and 60.6% with oxidative conditions (3%, 50°C, 48 hours). In alkaline stress conditions, products of degradation were observed at the retention times of 1.57 and 1.48 minutes without identification of them.
Forced degradation studies of STM from solutions prepared from tablets.
Conclusion
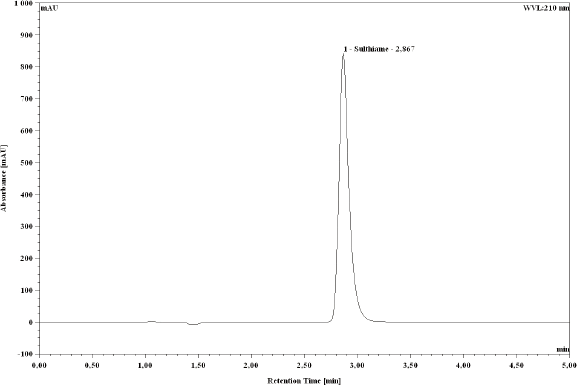
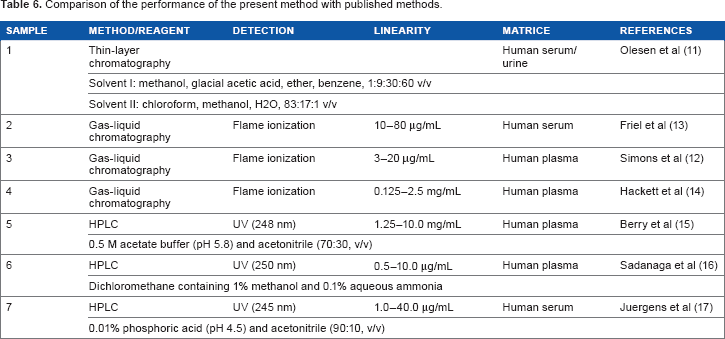
No stability-indicating HPLC method has been reported for STM. A detailed study comparing the previously published methods with the present method is discussed in Table 6. Satisfactory resolution was achieved with the use of a mixture of water and methanol (70:30, v/v), and a C18 column was adopted for the analysis with rapid run time. Ultraviolet detection was conducted at 210 nm. The present stability-indicating method for the assay of STM in tablets is specific and selective because the excipients and products of degradation did not interfere with the drug peak (Fig. 3). The complete separation of the analyte was obtained in less than five minutes. The method can successfully be applied to perform long-term and accelerated stability studies of STM formulations. The analytical method is precise, accurate, robust, and specific and can be applied to analyze the samples during studies.
Comparison of the performance of the present method with published methods.
Chromatogram of sulthiame solution 100 μg/mL from tablet.
Author Contributions
Conceived and designed the experiments: AH and JS. Analyzed the data: AH and JS. Wrote the first draft of the article: JS. Contributed to the writing of the article: SK, EM, I-BB, J-EF, and SC. Agreed with article results and conclusions: SK, EM, I-BB, J-EF, SC, and JS. Jointly developed the structure and arguments for the article: JS. Made critical revisions and approved the final version: SK, EM, I-BB, J-EF, and SC. All authors reviewed and approved the final article.