
Abstract
This study aimed to develop a solid-phase extraction gas chromatography-selected ion monitoring-mass spectrometry method for the determination of methadone (MDN) and 2-ethylidene-1,5-dimethyl-3,3-diphenylpyrrolidine (EDDP) in human plasma. The linear response was obtained over the concentration range from 10 to 2000 ng/mL for MDN and EDDP. The absolute recoveries of MDN and EDDP were 95.9%-98.9% and 94.8%-102.4%, with relative standard deviation (RSD) ranging from 1.8% to 2.7% and 1.8% to 3.9%, respectively. The intra- and interday precisions were found to be less than 5% for both analytes. The limits of detection of MDN and EDDP were 4 and 5 ng/mL, respectively. The presented method was convenient for therapeutic drug monitoring and pharmacokinetic studies in patients on heroin-assisted MDN therapy.
Keywords
Introduction
Methadone (6-dimethylamino-4,4-diphenyl-3-heptanone) is a synthetic analgesic that can inhibit the euphoric effects of heroin and provides relief of withdrawal symptoms because of its longer duration of action. 1 Therefore, oral methadone (MDN)-base maintenance treatment appears to be effective for illicit opiate addiction and it is widely used in some countries.2,3 Because MDN is given daily, its acceptance to heroin users may be limited. Additionally, MDN can induce respiratory depression and fatal overdose. 4 More recently, MDN is used in pain management with complexities of dosing and the number of adverse effects’ events have been described.5–8 Plasma concentrations of MDN can fluctuate individually and with the number of drugs.9–12 Quantification of MDN and its metabolite in plasma is effective to obtain maximum treatment efficacy, to prevent adverse effects, and to investigate the mechanisms of drug metabolism. Up to now, several methods for the determination of MDN in plasma or serum have been published using high-performance liquid chromatography (HPLC), gas chromatography (GC), gas chromatography-mass spectrometry (GC-MS), and principally liquid chromatography-mass spectrometry (LC-MS).13–38 The LC-MS methods may not be widely used in underdeveloped countries because of the inaccessibility and high costs of laboratory equipments. GC-MS method is more feasible because of its easy accessible and low cost. Few GC-MS methods in human plasma sample have been reported with high RSD precision, high LOD, or without metabolite.36–38 HPLC methods used principally liquid–liquid extraction procedure for stereoselectivity studies. For the GC methods, the principal metabolite was not determined and the RSD precisions were often >10%. In this study, we developed a suitable gas chromatography selected ion monitoring (SIM)-MS method for the determination of MDN and its principal metabolite 2-ethylidene-1,5-dimethyl-3,3-diphenylpyrrolidine (EDDP) in human plasma with high sensitivity and short analysis time per sample. The method was demonstrated to be sensitive, accurate, and reproducible for drug monitoring and pharmacokinetic studies in human plasma.
Experimental
Materials
MDN 1 mg/mL in methanol (purity, 99.9%), EDDP perchlorate 1 mg/mL in methanol (purity, 99.8%), methadone-d9 (MDN-D9) 1 mg/mL in methanol (purity, 99.2%), and EDDP-d3 perchlorate 0.1 mg/mL in methanol (purity, 99.8%) were obtained from Cerilliant Corporation. HPLC-grade acetonitrile and methanol, and sodium phosphate dibasic were obtained from Sigma-Aldrich.
Sterile water for irrigation was obtained from Fresenius Kabi. Acetic acid and ethyl acetate were obtained from Merck. Ammoniac solution was obtained from VWR. Clean Screen solid-phase extraction (SPE) columns (ZCDAU020, 200 mg) were purchased from UCT. The derivatizing agent utilized was bis(trimethylsilyl)trifluoroacetamide (BSTFA) + 1% trimethylchlorosilane (TMCS) (Sigma-Aldrich). Human plasma used for the preparation of controls and standards was obtained from the Etablissement Français du Sang.
Apparatus and chromatographic conditions
The Thermo Focus DSQ II GC/MS system was used for GC separation and detection. The system was equipped with an Uptibond® UB5 premium column (30 m × 0.25 mm id, 0.25 µm film thickness, Interchim). The column oven was held at 80°C for 0.5 minutes, and then programed from 80°C to 270°C at 20°C/minute for three minutes and programed from 270°C to 300°C at 40°C/minute for a total analysis time of 12 minutes. The transfer line temperature was maintained at 290°C. The injection port temperature was held at 250°C and operated in the pulsed splitless mode. Helium at a constant flow rate of 1.20 mL/minute was used as the carrier gas. The electron impact of 70 eV was used for the ionization of the compounds. One microliter of the derivatized extract was injected. Acquisition and integration of data were performed using the Xcalibur™ software (version 1.4.2, 2009, Thermo Electron Corporation). The instrument utilized electron impact ionization and was operated in the SIM mode. Ions with m/z 72 (MDN), m/z 277 (EDDP-TMS), m/z 78 (MDN-d9), and m/z 280 (EDDP-d3-TMS) were monitored.
Preparation of working standard solutions
MDN and EDDP working standard solutions 100 and 10 µg/mL were prepared in methanol from MDN and EDDP available standard solutions 1 mg/mL, and then stored at -20°C. These solutions were used for the construction of calibration samples and quality control (QC) samples. Combined internal standards solution was prepared in methanol by dilution of the stock solution of MDN-d9 and EDDP-d3 to a final concentration of 10 µg/mL for both analytes.
Preparation of assay standard solutions
Calibration standards of MDN and EDDP were prepared by diluting working standard solutions further with drug-free human plasma each day to obtain both analytes’ concentrations of 10, 20, 50, 100, 200, 500, 1000, and 2000 ng/mL. Sets of QC samples of MDN and EDDP were prepared separately by mixing appropriate amounts of working standard solutions and blank plasma to obtain concentrations of 30, 300, and 1500 ng/mL, and stored in batch at -20°C for the duration of the validation procedure. Precision and accuracy of the method was evaluated by analyzing the three QC samples, across linear range (30, 300, and 1500 ng/mL) for MDN and EDDP. Extraction efficiencies of MDN and EDDP were determined by comparing peak area ratios after extraction from the plasma with the peak area ratios of not extracted standards. Specificity was accomplished by analyzing a standard mixture of commonly used illicit and licit drugs (heroin, morphine, codeine, 6-acetyl-morphine, cocaine, benzoylecgonine, Δ 9 -tetrahydrocannabinol, methamphetamine, MDMA, diazepam, alprazolam).
Sample preparation
To 1 mL of plasma (calibrator, QC, or patient), 20 µL of the combined internal standards solution and 3 mL of 0.1 M phosphate buffer pH 6 were added and vortex mixed for 30 seconds. The SPE columns were conditioned with 3 mL of methanol, 3 mL of sterile water, and 1 mL of phosphate buffer 0.1 M pH 6 prior to sample loading. The samples were applied to the columns at a flow rate of ~1 mL/minute. Then, the columns were washed with 3 mL of sterile water, 3 mL of acetic acid 0.1 M, and 3 mL of methanol. They were dried for five minutes under nitrogen gas at a pressure of 100 psi. The analytes were eluted with 3 mL of freshly prepared mixture of ethyl acetate:acetonitrile:ammoniac (78:20:2, v/v/v). The eluates were collected in borosilicate tubes and evaporated to dryness under a stream of N2 at 35°C. The residue was reconstituted with 20 µL of ethyl acetate and 20 µL of derivatizing agent BSTFA/TMCS. Tubes were capped, mixed, and heated for 20 minutes at 70°C. After cooling, the samples were transferred to cap autosampler vials. An aliquot of 1 µL of the resulting solution was injected to the GC-MS system.
Results and Discussion
Chromatography
Representative SIM chromatograms of a blank plasma sample and a spiked plasma sample at low concentration (MDN, EDDP) are shown in Figure 1. The mean retention time of MDN and EDDP were 7.28 minutes and 6.82 minutes, respectively. The overall chromatographic run time for each sample was established at 14 minutes.

SIM chromatograms of an extracted blank plasma (A) and blank plasma spiked with MDN (B) and EDDP (C).
Validation characteristics
Linear calibration curves were obtained in concentration range from 10 to 2000 ng/mL of MDN and EDDP in plasma samples. Standard curves were fitted to a first-degree polynomial, y = ax + b, where y is the peak area of MDN/MDN-d9 or EDDP/EDDP-d3; a and b were constants, and x is the MDN or EDDP concentration (ng/mL). The analytical method was linear in the given concentration range for MDN (y = 0.0042x + 0.0361; r 2 = 0.9997) and EDDP (y = 0.0471x + 0.9967; r 2 = 0.9984). The limits of quantification of MDN and EDDP were expressed as the lowest concentration in the linear calibration curve (10 ng/mL). The limits of detection of MDN and EDDP (S/N ≥ 3) of the method were measured to be up to 4 and 5 ng/mL, respectively.
Precision and recovery
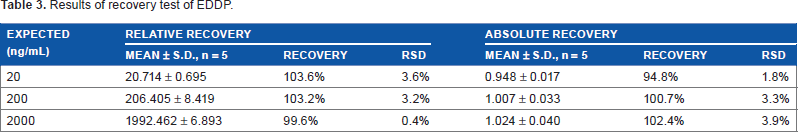
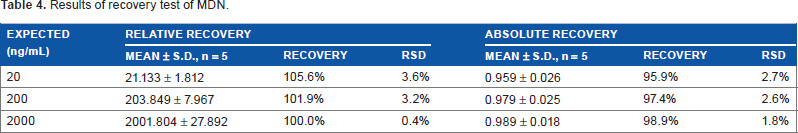
To evaluate the accuracy and precision of the method, three different concentrations of QC samples of MDN and EDDP (30, 300, and 1500 ng/mL) were prepared in blank human plasma and extracted as described above. Intraday accuracy and precision were determined from the analysis of six replicates independently samples at each concentration over the same day. Interday accuracy and precision were evaluated on five separate days, with 15 replicates at each aforementioned concentration (three replicates per day). Relative recovery was calculated by comparing the measured concentration according to regression equation with added concentration. Absolute recovery of analyte was determined by comparing the peak area ratio after extraction with those of nonextracted solutions containing the same concentrations of analyte as in plasma. The intra- and interday accuracy of MDN (%Bias) at three concentrations ranged from 0.0% to 0.3% and -1.7% to 1.03%, respectively (Tables 1 and 2). The intra- and interday accuracy of EDDP (%Bias) at three concentrations ranged from -2.1% to 4.6% and -3.3% to 2.6%, respectively. The intra- and interday precision of MDN (%CV) ranged from 2.9% to 4.3% and 1.8% to 4.9%, respectively. The intra- and interday precision of EDDP (%CV) ranged from 2.7% to 4.7% and 2.8% to 4.9%, respectively. These results are summarized in Tables 1 and 2. The relative recoveries of MDN and EDDP were 100.0%-105.6% and 99%-103.6%, with RSD ranging from 1.4% to 8.6% and 0.4% to 3.6%, respectively. The absolute recoveries of MDN and EDDP were 95.9%-98.9% and 94.8%-102.4%, with RSD ranging from 1.8% to 2.7% and 1.8% to 3.9%, respectively. These results are summarized in Tables 3 and 4.
Intraday accuracy and precision for the determination of MDN and EDDP in human plasma.
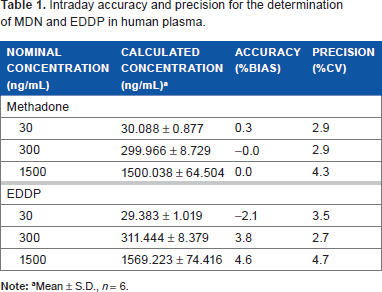
Note:
mean ± S.D., n = 6.
Interday accuracy and precision for the determination of MDN and EDDP in human plasma.
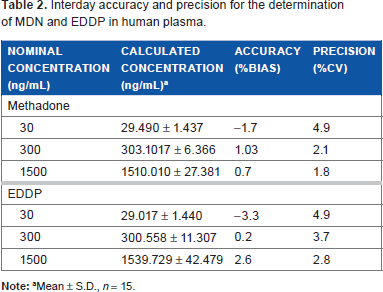
Note:
Mean ± S.D., n = 15.
Results of recovery test of EDDP.
Results of recovery test of MDN.
MDN and EDDP stability in human plasma
Previous studies reported the thermal stability of MDN and EDDP in human plasma at 25°C, 4°C, -20°C, and -70°C.26,36 Both analytes were found to be stable at room temperature for at least four hours, at 4°C for one day, while at -20°C for at least one month. In the present study, the MDN and EDDP in human plasma were stable at room temperature for at least five hours and at +4°C for at least three days, with the RSD of both analytes’ concentrations under 5% for the three concentrations (20, 200, and 2000 ng/mL). Taking into account these data, human plasma samples were stored at -20°C for a maximum of three days to be performed.
Selectivity
The analyzed spiked plasma samples with illicit and licit drugs as mentioned earlier did not overlap with peaks of any of the tested components.
Conclusion
MDN used in MDN maintenance treatment for heroin addicts reported large individual variability in response.39,40 This variability is likely to be because of both pharmacodynamic and pharmacokinetic factors and physiological, pathological, and pharmacological factors. 41 Consequently, MDN and EDDP determinations should be individually analyzed based on the data obtained from each patient. The GC-SIM-MS method for the quantitative analysis of MDN and EDDP in human plasma is described using a SPE pretreatment. Accuracy and precision for both analytes are under 5% for the wild range calibration levels. The method has been demonstrated to be reliable and suitable for therapeutic drug monitoring and pharmacokinetic studies in patients on heroin-assisted MDN therapy.
Author Contributions
Conceived and designed the experiments: FC, JS. Analyzed the data: FC, JS. Wrote the first draft of the manuscript: FC, JS. Contributed to the writing of the manuscript: FC, JS. Agree with manuscript results and conclusions: FC, JS. Jointly developed the structure and arguments for the paper: FC, JS. Made critical revisions and approved final version: FC, JS. Both authors reviewed and approved of the final manuscript.