
Abstract
Background:
The prevalence of Type 2 diabetes mellitus (T2DM) and depression has witnessed a steep rise. The relationship between these two conditions has been mostly studied in Western countries. The existing literature indicates that depression is more common in T2DM. However, data regarding its association with clinical profile of diabetes is conflicting. Despite the extensive occurrence of T2DM and depression in India, research on their association is limited.
Aims and Objectives:
To study the prevalence of depression and its association with complications of T2DM among inpatients of T2DM in a tertiary care center in Central India.
Materials and Methods:
Inpatients department of Medicine was taken as study site and 120 inpatients of T2DM aged 18 to 65 years were recruited after applying strict inclusion and exclusion criteria. They were assessed for depression using structured interview and ICD-10 criteria. The severity was assessed by HAMD-17 (Hamilton Rating Scale for Depression). The complications of diabetes were assessed.
Results:
The prevalence of depression in T2DM patients was 24.2% (29 cases) among which mild depression was present in 62.1% cases. There was a significant positive association (p<0.05) between depression and socio-demographic variables of age, female gender, rural habitat and lower socio-economic status. There was a significant positive association between depression and duration of diabetes, BMI, serum triglyceride, serum creatinine and a significant negative association with serum HDL. Depression had a significant positive association with nephropathy and Coronary Artery Disease (CAD).
Conclusion:
The prevalence of depression is higher in T2DM as compared to normal population and is significantly associated with nephropathy and coronary artery disease. The findings highlight the need for timely screening of depression and integrated management approach.
INTRODUCTION
Diabetes has been a rapidly growing cause of morbidity and mortality all over the world. The International Diabetes Federation (IDF) latest figures show that 537 million adults are now living with diabetes worldwide – a rise of 16% (74 million) since the previous IDF estimates in 2019.[1] The numbers are more alarming for Southeast Asia where the number of diabetics is 90 million currently. In 2020, a population of 88 million was estimated to be suffering from diabetes in the Southeast Asia region. India is a major contributor to this regional diabetes burden with 77 million patients.[2,3] The prevalence of diabetes in India is 8.9%, according to the IDF.
According to the Global Burden of Disease reports in 2015, both diabetes and depressive disorders were among the ten leading causes of disability.[4] The Chennai Urban Rural Epidemiology Study-102[5] estimated that 23.4% of the 847 T2DM patients had depression. The pooled prevalence of depression in T2DM patients was found to be 38% (95% confidence interval [CI]: 31%–45%).
Diabetes is associated with various microvascular complications such as nephropathy, neuropathy, and retinopathy and also macrovascular complications such as peripheral vascular disease (PVD), stroke, and coronary artery disease (CAD).
It is well known that depression is more prevalent in diabetes as compared to healthy population, but whether the presence of depression increases the likelihood of diabetes complications is not well researched. Depression and diabetes are both highly prevalent in our country and their association has been studied mostly in the Western population. Indian populations have different dietary habits and lifestyle, so we cannot extrapolate the Western data as such. Most of the previous studies were done in outpatient settings, and there is a lack of literature on depression and diabetes in inpatient settings where patients are expected to have more complications. Hence, our study focused on inpatient population of T2DM to better assess the association of depression and complications of T2DM.
METHODS
The study was conducted in the inpatient department of medicine of an urban tertiary care center. The study design was cross-sectional. The sample size was determined using a prevalence of depression in diabetes patients estimated at 20% from the literature, with a 90% CI.[6,7]
Sample size = Z2 × pq/l2
Z is the statistic corresponding to the level of confidence
P is expected prevalence (20%)
l is error of margin (10%).
The calculated sample size was 64, but the ample of diabetic patients was admitted and the study duration (10 calendar months) of participants’ recruitment was remain, and during the study period, 120 patients of T2DM aged 18–65 years undergoing inpatient care were recruited after applying strict inclusion and exclusion criteria. Stratified sampling method was used recruitment of study participants. The exclusion criteria included pregnant women, patients requiring intensive critical unit care, and patients with a history of known psychiatric illness. Patients were assessed for depression through clinical interview and diagnosis made according to the International Classification of Diseases-10 criteria. The severity of depression was assessed by the Hamilton Rating Scale for Depression-17 (HAMD-17). The internal consistency reliability for the HAMD-17 was Cronbach’s alpha = 0.829 in depression.[8] The permission was obtained from the Institutional Ethical Committee. Patients were assessed for complications of diabetes through clinical examinations, laboratory investigations, and specialists’ consultation.
Aim
The aim was to study depression and its association with complications of T2DM.
Objectives
The objectives of this study were as follows:
To study the sociodemographic and clinical profile of T2DM patients To study the prevalence of depression in T2DM patients To study the clinical profile and severity of depression in T2DM patients To study the association of depression with complications of T2DM.
Study design
This was a cross-sectional study.
Study site
The study was conducted at the Department of Medicine and Department of Psychiatry, Shyam Shah Medical College, Rewa, Madhya Pradesh, India.
Study duration
The study duration was 10 months.
Study population
Indoor patient department patients of T2DM were enrolled.
Sample size
The sample size was 120
Inclusion criteria
The inclusion criteria of this study were as follows:
Patients diagnosed with T2DM according to the American Diabetes Association criteria Patients or legally authorized relatives giving written informed consent Both males and females of age group 18–65 years.
Exclusion criteria
The exclusion criteria of this study were as follows:
Patients requiring critical intensive care unit care Pregnant patients Patients with known psychiatric illness.
Statistical analysis
The data were analyzed by using IBM SPSS Statistics (Version 26). The quantitative and qualitative variables were described as means, standard deviation, and P value. The Student’s t-test for parametric data and Chi-square test for nonparametric data were employed. The quantitative variables were compared with independent t-test. All statistical tests were two-sided and the level of statistical significance was 0.05.
RESULTS
Table 1 shows the comparison of sociodemographic variables between the depression and nondepression groups. The percentage of females in the depression group was 69%, which was significantly higher as compared to 29.7% in the nondepression group (P = 0.00). In the depression group, 82.8% belonged to the rural background which is higher than the nondepression group (62.6%, P = 0.044). There was also a statistically significant difference of socioeconomic class seen between the two groups (P = 0.025).
Comparison of sociodemographic characteristics between patients with depression and patients without depression

Table 2 shows that the prevalence of depression in T2DM patients in our study was 24.2%. Based on the HAMD-17 scores, the severity of depression was categorized as mild in 62.1% of cases, moderate in 34.5% of cases, and severe in 3.4% of cases [Table 3].
Prevalence of depression in the study population (n=120)

Severity of depression based on HAMD-17 score

Table 4 shows the comparison of age, duration of diabetes, body mass index (BMI), fasting blood sugar (FBS), and lipid parameters, i.e., serum cholesterol, serum triglycerides, high-density lipoprotein (HDL), and low-density lipoprotein cholesterol (LDL-C) between the depression group and the nondepression group. The mean age in the depression group was 56.62 ± 5.49 years, which was higher than the mean age of the nondepression group of 53.18 ± 7.22 (P = 0.020). The duration of diabetes in the depression group was 11.69 ± 5.41, which was significantly higher than that of 9.02 ± 5.85 in the nondepression group (P = 0.031). BMI in the depression group was significantly higher than the nondepression group (25.95 ± 2.61 vs. 23.99 ± 2.68, P = 0.001). The mean FBS was greater in the depression group 150.83 ± 48.00 mg%, but this difference was statistically insignificant. The mean serum triglyceride level was 274.85 ± 120.21 in the depression group as compared to 221.08 ± 108.92 in the nondepression group (P = 0.026). The difference in mean serum HDL level was also significant (P = 0.009). There was a statistically significant difference with respect to age, duration of diabetes, serum triglycerides, serum HDL, and serum creatinine. With respect to serum creatinine, there was a statistically significant difference between the two groups (P = 0.018) showing a positive association of depression with serum creatinine levels. There was no statistically significant difference between the depression group and the nondepression group with respect to FBS level, LDL-C level, and serum cholesterol level.
Comparison of continuous clinical variables between depression patients and nondepression patients
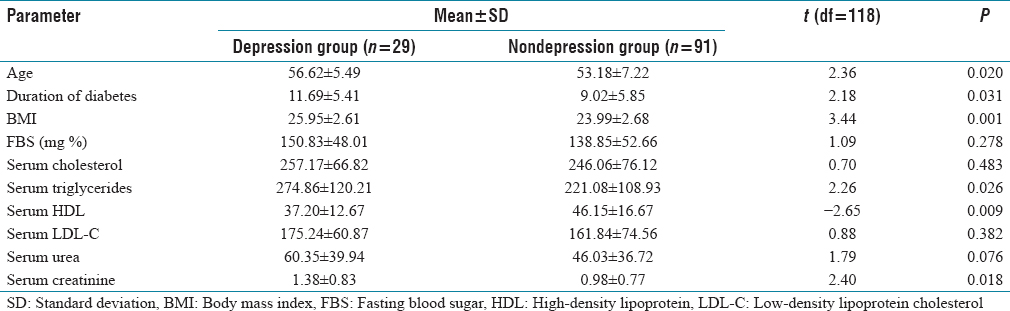
Table 5 shows the comparison of the presence of complications of diabetes, i.e., retinopathy, neuropathy, nephropathy, stroke/transient ischemic attack (TIA), CAD, and PVD between the depression and nondepression groups. The findings suggest a statistically significant difference with respect to the presence of nephropathy and CAD in both the groups.
Comparison of complications of diabetes between depression group and nondepression group

DISCUSSION
The study aimed to determine the prevalence of depression in type 2 diabetes mellitus, and it also investigated the relationship between depression and diabetes complications.
Sociodemographic characteristics
The mean age of the depression group was 56.63 ± 5.49 years, which was higher as compared to patients of the nondepression group, and this difference was statistically significant (P = 0.020). In a previous study, Kumar et al.[9] concluded that the prevalence rate of depression was higher in ages between 41 and 60 years (18.8% vs. 7.6%, respectively) in the diabetic and healthy control groups. A study by Raval et al.[10] found that there is a 1.26 times more risk of depression in patients with T2DM aged above 54 years. Thus, our findings were in agreement with previous studies. There was a statistically significant difference between the two groups with respect to female gender (P = 0.000). The female population was 68% in the depressed diabetics as compared to 29.7% in the nondepressed diabetics. It is well known that depression is more common in women, especially in the middle aged. The National Mental Health Survey 2015–2016[11] also found that depression was more prevalent in females. According to a meta-analysis,[12] the gender-specific prevalence of depression was 38% for females as compared to 26% for males.
The majority of population was from rural background (67.5%). A higher number of rural patients as compared to urban patients reflect the rural dominance of this geographical area. Majority of the depression patients (82.8%) belonged to rural habitat as compared to 62.6%, and the difference was statistically significant (P = 0.04). A similar study[13] reported that depression was significantly more prevalent in rural individuals (57%) as compared to urban ones (31%, P = 0.049). Ravishankar et al.[14] also found higher susceptibility of rural population to depression in T2DM patients.
The family type was nuclear in 58% and joint in 62%. In the depression patients, joint family type was 62.1% as compared to 48% in the nondepression group. In the depression group, 10.3% of population was widowed as compared to 2.2% in the nondepression group, but the difference was not statistically significant. The loss of spouse is a stressful life event which may act as a precipitating factor for depression. 37.5% of the study population was educated up to primary level and 17.5% was illiterate. However, in the depression group of diabetics, illiteracy was more as compared to the nondepressed group (31.0% vs. 13.2%), but this difference was not statistically significant. Educational status of a person has a strong association with depression in people suffering from T2DM as reported by previous studies.[15-18]
Prevalence and severity of depression
The prevalence of depression in the present study was found to be 24.2% (n = 29). The increased prevalence of depression in diabetes as compared to general population (24.2% vs. 5.25%) is attributed to many factors. Depression is associated with abnormalities such as arousal of the hypothalamic–pituitary–adrenal axis, sympathoadrenal organization, and pro-inflammatory cytokines that acquire an insulin resistance and contribute to diabetes risk. Depression is also related to poor health behaviors such as sedentary lifestyle, poor adherence to drugs, diet, and exercise regime which further enhance the risk of diabetes. Our findings are in accordance with an earlier study by Kumar et al.[9] which reported the prevalence of depression in T2DM to be 33%. Many case–control studies which compared the prevalence of depression[19-21] reported a significantly high rate of depression among the diabetic patients than the nondiabetic controls. Khaledi et al.[12] in their research reported a pooled prevalence of 28%.
The mean HAMD score was 14.86 ± 4.6. Based on the HAMD-17 scores, the severity of depression was categorized as mild in 62.1% of cases, moderate in 34.5% of cases, and severe in 3.4% of cases. In a study conducted by Thour et al.,[13] similar findings were reported where severe depression was present in 4%, moderate depression in 10%, and mild depression in 27%. Bajaj et al. reported mild-to-moderate depression in majority 69.3% of the cases in their research.[19]
Clinical variables
The mean duration of diabetes was 11.69 ± 5.41 years in the depression group, which was significantly higher than the nondepression group 9.02 ± 5.85 years (P = 0.031). This finding is supported by studies done by Kulkarni et al.[22] and Das et al.[23] which demonstrated a statistically significant association between duration of diabetes and depression in participants. Katon et al.[24] in their study revealed that longer duration of diabetes is associated with depression. However, this does not confer to what has been reported by Robinson et al., who found no relation between depressive symptoms and duration of diabetes.[25]
The significant positive association of depression with BMI (P = 0.001) in the present study was supported by previous studies conducted by Balhara and Sagar, 2011,[26] and Joseph et al., 2013,[27] who found that being overweight significantly increased the risk of depression in T2DM. The possible reason for this relation is depression being associated with decline in metabolic control, poor adherence to medication, and diet programs. Contrary to this, Raval et al.[10] reported no significant risk related to BMI.
The mean FBS in the depression group was 150.83 ± 48 mg/dL. There was a positive association of depression with FBS, but this was not statistically significant (P = 0.28). Our findings are in agreement with a similar study by Thour et al., 2015[13] which observed that depression was associated with increased fasting plasma glucose, but the difference was not statistically significant. Contrasting findings by Hussain et al.[28] and Sharif et al.[29] reported that impaired glycemic control is significantly associated with depression in diabetic patients.
The mean triglyceride level in the depression group was higher than the nondepression group, and a statistically significant association was present (P = 0.026). This finding is consistent with findings demonstrated by studies performed by Ruas et al.,[30] who concluded that high triglyceride level showed the strongest association with depressive symptoms. The mean HDL level in depression was 37.20 ± 12.67 mg/dL, which was significantly lower than 46.15 ± 16.67 mg/dL in the nondepression group. This negative association between depression and HDL levels was statistically significant (P = 0.01). Lower serum HDL levels are probably induced by the inflammatory response in depression, and there is impairment of reverse cholesterol transport from the body tissues to the liver.[31] Two previous studies reported a significant association of depression in T2DM with dyslipidemia.[32,33] There was no significant difference with respect to LDL between the two groups.
With respect to serum creatinine, there was a statistically significant difference (P = 0.018) showing a positive association of depression with serum creatinine levels. These findings are consistent with those demonstrated by Bajaj et al.[19]
Association of micro- and macrovascular diabetes complications with depression
The prevalence of retinopathy in the depression group was 27.6%, whereas that in the nondepression group was 30.8%. The difference was statistically insignificant. Similar findings were reported by two other studies.[10,19] As opposed to this, findings demonstrated by Gehlawat et al.[34] reported that a significant 70% of their depressed patients with T2DM showed signs of retinopathy. The prevalence of neuropathy in the depression group was 51.7% while that in the nondepression group was 36.3%. Although the prevalence of neuropathy was higher in the depression group than the nondepression group, this was not statistically significant (P > 0.05). Nephropathy was found in 13 (44.8%) in the depression group compared to 23 (25.3%) in the nondepression group, and this difference was statistically significant (P = 0.025). This finding is consistent with those inferred from previous studies by Ali et al.,[15] Joseph et al.,[27] and Rajender et al.[35]
Stroke/TIA was present in 37.9% in the depression group as compared to 20.9% in the nondepression group. Although the prevalence of stroke was higher in depression patients, the difference was statistically insignificant. PVD was present in 6.9% in the depression group as compared to 14.3% in the nondepression group. The difference was statistically insignificant. CAD was present in 44.8% in the depressed diabetics as compared to 23.1% in the nondepressed diabetics, and this difference was statistically significant (P = 0.024). This finding is in conformity with a study by Rajender et al., 2016,[35] who emphasized that a significant association exists between CAD and depression. Guruprasad et al., 2012,[18] also found that ischemic heart disease was present in 25.9% of the depressed diabetic patients. Bruce et al.[36] demonstrated that depressed patients have more cardiovascular risk factors, CHD, cerebrovascular disease, and higher all-cause and cardiac mortality rates during follow-up.
CAD and nephropathy are higher in the depression group than retinopathy [Table 5]. The finding consistent with previous studies and reviews stated that the risk of CAD was higher in diabetes with depression than other diabetic complications by various mechanisms.[37]
The major limitations of the study were the small sample size and cross-sectional study design; therefore, a temporal association between depression and diabetes and its complications could not be established. The study included only inpatients of diabetes in whom complications are expected to be more as compared to outpatients.
CONCLUSION
The prevalence of depression in T2DM patients in our study was found to be higher as compared to the prevalence of depression in general population which substantiates the existing literature regarding positive association of depression and T2DM. Majority of the depression cases had mild depression. There was a significant positive association between depression and sociodemographic variables of age, female gender, rural habitat, and lower socioeconomic status. There were a significant positive association between depression and duration of diabetes, BMI, serum triglyceride level, and serum creatinine and a significant negative association with serum HDL level. Among the microvascular complications, depression had a significant positive correlation with nephropathy, and among the macrovascular complications, a significant positive association was present with CAD. Therefore, the association between T2DM and depression was found in our study, highlighting the need for integrated management protocols between various specialties and psychiatric management to improve the overall prognosis. Screening for depression may be easily carried out, even in a busy clinic. Treating depression may enhance the patients’ well-being and ability to manage symptoms of both diseases, thus improving the quality of their lives. Future research in this area should include studies with a large sample size, longitudinal study design, and therapeutic intervention for depressed diabetics and assessing whether the improvement in depression correlates with improvement in clinical profile of diabetes.
Footnotes
Conflicts of interest
There are no conflicts of interest.
Institutional ethical committee approval
The study was approved by the appropriate Institutional Ethical Committee at Shyam Shah Medical College, Rewa (approval no. IEC/MC/2020453, dated – January 08, 2021), and participants gave written informed consent to the work.
Funding
Nil.
Author’s contribution
All nine authors affirm that they contributed sufficiently to be considered in authorship and have also verified an absence of plagiarism. SP, NM, DKM and UPS conceived and designed the study and conducted the research. DR, UP and MR gathered research materials, collected and tabulated data. AS and PM analysed and interpreted the data. Finally, all authors critically reviewed and approved the final draft and are hence responsible for the content and similarity index of the manuscript.