
Abstract
Introduction:
In India, the incidence of coronary artery disease (CAD) has doubled, and the association between diabetes mellitus, peripheral arterial disease, and CAD remains unclear. This study aimed to explore the relationship between ankle-brachial index (ABI) and CAD in diabetic patients, using the ABI as a diagnostic tool for peripheral arterial disease.
Materials and Methods:
A cross-sectional study at a tertiary care center analyzed 100 diabetes cases for CAD using angina history, past treatment, electrocardiography, and two-dimensional echocardiography. Blood pressure was measured in all limbs, and ABI was calculated by dividing ankle pressure by brachial pressure, selecting the lower ratio.
Results:
Out of 100 patients, 28 had ABI <0.9 and 72 had ABI ≥0.9. The majority of both groups were male. The highest percentage in both groups was aged 51–60. The ABI +VE group had higher proportions of hypertension, smokers, and dyslipidemia. The majority in the ABI −VE group were nonsmokers and without dyslipidemia. Both groups had a majority with body mass index ≥25 kg/m2. Mean diabetes duration was higher in the ABI +VE group, while mean glycated hemoglobin levels were higher in the ABI −VE group.
Conclusion:
In our study, the prevalence of ABI +VE patients was 28% and prevalence of CAD in this group was 42.85%, which is statistically significant. Hypertension, smoking, dyslipidemia, diabetes duration, and glycemic control were significantly associated with low ABI index (ABI <0.9).
INTRODUCTION
The ankle-brachial index (ABI) has been used as a marker of atherosclerosis in epidemiological research. There is evidence that those with poor ABIs are more likely to die from cardiovascular disease.[1] ABI has been suggested as a predictor of subclinical atherosclerosis and cardiovascular prognosis and is a cheap and reliable approach for detecting peripheral artery disease (PAD).[1,2] PAD, which is brought on by the blockage of leg arteries as a result of atherosclerotic occlusion, is a significant sign of systemic atherosclerosis. An ABI of ≤0.90 indicates PAD. Individuals with diabetes have an increased likelihood of developing coronary artery disease (CAD), and the ABI is often employed to identify CAD in diabetic patients. However, diabetic patients may demonstrate rigid and noncompressible ankle arteries, resulting in a high ABI value (>1.40). This phenomenon is attributed to the presence of medial calcinosis (MC), which is distinct from atherosclerosis. MC is characterized by calcification within the arterial medial layer without protrusion into the arterial lumen.[3]
The aim of the current study is to investigate the correlation between the ABI and CAD in patients with diabetes. This research could provide valuable insights into identifying atherosclerotic risk factors and aid in the early prevention or treatment of CAD. Given the growing prevalence of atherosclerotic disease and the associated mortality, such findings could contribute to reducing the burden of CAD.
MATERIALS AND METHODS
Objective
To investigate the correlation between the ABI and CAD in patients with diabetes
To study the relationship between various risk factors and Ankle Brachial.
Study center
Shyam Shah Medical College and SGMH, Rewa, MP.
Study design
Single center cross-sectional study.
Sample size
One hundred.
Methodology
All relevant data regarding age, sex, weight, height, history and duration of diabetes, hypertension, and smoking are collected. All relevant investigations such as complete blood count, random blood sugar (RBS), lipid profile, glycated hemoglobin (HBA1C) sent. Detailed cardiac history and examination was done and CAD diagnosis was confirmed by electrocardiography (ECG) and two-dimensional echocardiography. ABI was measured using standard method.
Interpretation of ankle-brachial index results
>0.90 = Normal.
0.70−0.89 = Mild.
0.50−0.69 = Moderate.
<0.50 = Severe.
>1.3 = noncompressible severely calcified vessel.
ABI +VE = ABI <0.9.
ABI −VE = ABI ≥0.9.
Inclusion criteria
Type 2 Diabetes patients as per the American Diabetes Association criteria.[4]
Exclusion criteria
Damaged lower limb or upper limb
Patients with ABI >1.4.
ABI was calculated as ratio of systolic ankle pressure/systolic brachial pressure. ABI was calculated on the right and left side and minimum among both sides was considered as ABI.
Diagnosis of CAD was made by history of angina, ECG changes, past history of CAD, and drug treatment for CAD.
Data analysis
Descriptive statistics determined mean values and percentages. Statistical tests (unpaired t-test, Chi-square/Fisher exact test) were used to compare the data, with significance set at P < 0.05. Analysis was performed using IBM SPSS Statistics (Version 16) and Microsoft Excel 2007.
RESULTS
Data collected from 100 diabetic patients were compared, analyzed, and tabulated.
Table 1 shows that out of 100 patients, 28 patients have ABI <0.9 and 72 patients have ABI ≥0.9.
Prevalence of ankle-brachial index-positive patients

According to Table 2, the majority of subjects in the ABI +VE group (71.42%) and ABI −VE group (73.61%) were male. In terms of age, the highest percentage of subjects in the ABI +VE group (53.57%) and ABI −VE group (54.16%) were between 51 and 60 years old. The majority of subjects in the ABI +VE group (67.85%) had hypertension, while the majority of subjects in the ABI −VE group (58.33%) did not. The majority of subjects in the ABI +VE group (71.42%) were smokers, while the majority of subjects in the ABI −VE group (61.11%) were nonsmokers. In addition, the majority of subjects in the ABI +VE group (60.71%) had dyslipidemia, while the majority of subjects in the ABI −VE group (69.44%) did not. Finally, the majority of subjects in the ABI +VE group (75%) and ABI −VE group (63.88%) had a Body mass index (BMI) of ≥25 kg/m2.
Demographic and biochemical profile
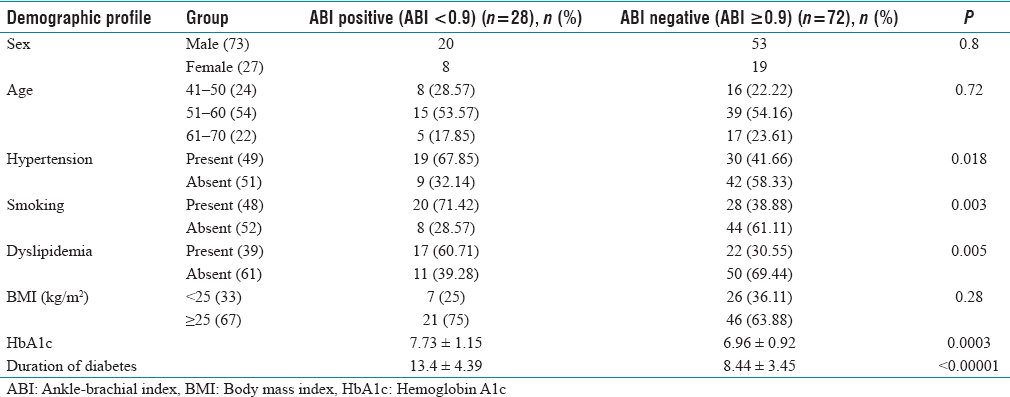
Table 2 shows that the mean duration of diabetes was 13.4 ± 4.39 years in the ABI +VE group and 8.44 ± 3.45 years in the ABI −VE group. The mean HBA1C level was 7.73 ± 1.15 in the ABI +VE group and 6.96 ± 0.92 in the ABI −VE group.
Table 3 shows that the prevalence of CAD in ABI +VE group was 42.85% and ABI −V Group was 13.88%.
Relationship between coronary artery disease and ankle-brachial index

DISCUSSION
In our study, the prevalence of abnormal ABI (ABI +VE) in diabetic patients was 28%, with women having a slightly higher prevalence (29.62%), as compared to men (27.39%).
Studies by Walters et al.[5] and Belli et al.[6] showed an abnormal ABI prevalence of 23.5% and 14%, respectively.
In our study, the highest percentage of subjects in the ABI +VE group (53.57%) and ABI −VE group (54.16%) was between 51 and 60 years age group.
In our study, the prevalence of CAD was 42.85% in the ABI +VE group and 13.88% in the ABI −VE group, showing a statistically significant difference. Another study conducted by Belli et al.[6] reported a CAD prevalence of 81.3% in ABI + VE patients and 34.5% in ABI −VE patients. Similarly, Sharma et al.[7] found that the prevalence of CAD was 53.33% in the ABI +VE group, compared to 27.05% in the ABI −VE group.
In our study, the prevalence of hypertension in ABI +VE group was 67.85% and 41.66% in the ABI −VE group, showing a statistically significant difference. Similarly, Sharma et al.[7] found that in ABI +VE group, mean systolic blood pressure and mean diastolic blood pressure were significantly higher (P < 0.05) as compared to the ABI −VE group.
In our study, history of smoking in ABI +VE group was 71.42% and 38.88% in the ABI −VE group, showing a statistically significant difference. Similarly, Sharma et al.[7] found that history of smoking was higher in the ABI +VE group (33.3%) as compared to ABI −VE group (11.8%).
In our study, the prevalence of dyslipidemia in ABI +VE group was 60.71% and 30.55% in the ABI −VE group, showing a statistically significant difference. Sharma et al.[7] found that mean age of ABI +VE group was 68.07 ± 6.55 and ABI −VE group was 58.66 ± 6.24.
In our study, the majority of subjects in the ABI +VE group (75%) and ABI −VE group (63.88%) had a BMI of ≥25 kg/m2 which was statistically nonsignificant. Similarly, study conducted by Belli et al.[6] reported mean BMI in ABI +VE group was 25.83 ± 3.41 and ABI −VE group 26.5 ± 3.78.
In our study, mean HbA1C level was 7.73 ± 1.15 in the ABI +VE group and 6.96 ± 0.92 in the ABI −VE group, showing a statistically significant difference. Similarly, study conducted by Belli et al.[6] reported that HbA1C level was 7.0 ± 0.91 in the ABI +VE group and 6.76 ± 0.68 in the ABI −VE group.
In our study, mean duration of diabetes was 13.4 ± 4.39 years in the ABI +VE group and 8.44 ± 3.45 years in the ABI −VE group. Similarly, study conducted by Belli et al.[6] reported that mean duration of diabetes was 12.50 ± 4.82 years in the ABI +VE group and 8.55 ± 3.51 years in the ABI −VE group.
CONCLUSION
In our study, the prevalence of ABI +VE patients was 28% and the prevalence of CAD in this group was 42.85% which is statically significant. Hypertension, smoking, dyslipidemia, diabetes duration, and glycemic control were significantly associated with low ABI index (ABI <0.9).
Limitation of study
Small sample size.
Footnotes
Conflicts of interest
There are no conflicts of interest.
Institutional ethical committee approval
The study received approval from the Institutional Ethics Committee.
Funding
Nil.
Author’s contribution
All authors participated in data collection and data analysis.