
Abstract
Aim and Objective:
To study the prevalence and risk factors of prehypertension and hypertension among adolescents (18–19 years) at the entry level of professional course.
Materials and Methods:
After institutional ethics committee approval and informed consent from participants, the data were collected and entered into the Excel sheet. Appropriate statistical analysis was applied. The final result was statistically interpreted.
Results:
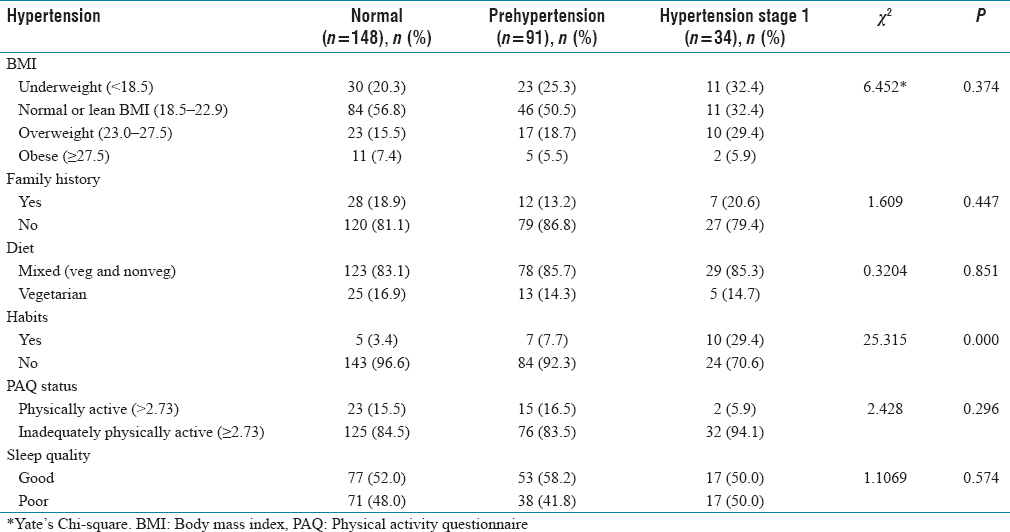
A total of 273 student participants were included in the study. There were 104 males and 169 females. One hundred and seven participants were 18 years old and 168 were 19 years old. Male: female ratio is 1:1.6. Prehypertension was seen in 91 (33.3%) and hypertension was observed in 34 (12.57%). Seven (20.6%) cases had a family history of hypertension. Twenty-two (8.1%) had addictive habits. Inadequate physical activity was seen in 32 (94.1%) of cases who had hypertension. Poor sleep quality was seen in hypertensives (17; 50%). In our study also, there was no statistically significant association between gender and systolic blood pressure and diastolic blood pressure (P > 0.05). There is a statistical significance association between the gender and body mass index (BMI) but not between BMI and hypertension status. There was statistically significant association was there between prehypertension and hypertension with habits.
Conclusion:
Change in habits and dietary modification will have impact on the development of prehypertension and or hypertension among adolescents. More emphasis must be given to screen adolescents at college entry. Adolescents are best target age group for primordial prevention.
Introduction
As per the WHO, hypertension is defined as the measured systolic blood pressure (SBP) readings being more than 140 mmHg and diastolic blood pressure (DBP) readings being more than 90 mmHg on 2 consecutive days.[1] The overall prevalence for hypertension globally is an estimated 26% of the world's population (972 million people),[2] and in India, it is 29.8%.[3] As per the National Family Health Survey, the prevalence of hypertension in young adults in Karnataka was 12.6%.[4] The risk factors for hypertension can be divided into modifiable and nonmodifiable. The nonmodifiable risk factors include age, gender, sex, race, and family history (FH) of hypertension. The modifiable risk factors include lack of physical activity, diet rich in sodium, obesity, alcohol consumption, high cholesterol, smoking, tobacco chewing, and stress.[5] Hypertension is the complication of all these risk factors. As per the WHO, adolescent age group is defined as those from 10 to 18 years. At this period, they are prone for the change in lifestyle. Entry to professional college and new environment for them, alongside the peer pressure are all a risk factor for them.
Cohort studies have suggested a correlation of blood pressure (BP) levels in childhood with those in the adulthood.[6] In long-standing hypertension, the macrovascular and microvascular complication is well observed. The macrovascular complications include coronary artery disease, myocardial infarction, stroke, congestive heart failure, and peripheral vascular disease. Microvascular complications such as retinopathy, nephropathy, and neuropathy have been reported. This study can benefit in creating wide awareness regarding early prevention and better education related to hypertension and prehypertension in the adolescent age group at the entry level to professional course.
Aim
To study the prevalence and risk factors of prehypertension and hypertension among adolescents (18–19 years) at the entry level of professional course.
Objective
Primary objective
The primary objective is to study the prevalence of hypertension and prehypertension among adolescents (18–19 years of age).
Secondary objective
To study the effect of body mass index (BMI), physical activity, sleep quality, FH, diet, and gender in relation to the BP of the individual.
Materials and Methods
Inclusion criteria
Age 18–19 years (in our campus joining age at 18 years of age)
Individuals having additive habits such as alcohol consumption and nicotine smoking
History of sleep disturbance.
Exclusion criteria
History of congenital renal and cardiac abnormality
Individuals already on hypertensive medications
Students who refused to give consent for participation in the study.
Duration of study
The duration of the study was from September 2021 to October 2021 (1 month).
Sample size
The sample size was calculated using a study conducted in India in 2013 study by Sundar et al.,[7] the prevalence of adolescent hypertension was 21.5%. At 95% confidence level and absolute allowable error of 5% with 10% attrition, a minimum of 260 samples should be included in the study.
Sampling method
A nonprobability sampling technique, i.e. convenience sampling method.
Study design
The study design was a cross-sectional study.
Study setting
It was conducted at the outpatient department (OPD) of a tertiary care hospital.
Methodology
After the institutional ethical committee approval and informed consent from the participants, study was conducted at the entry level of professional college students (medical, engineering, and nursing). A total of 273 students who fulfilled the inclusion criteria were included in the study. Data were collected which included socio-demographic information, FH of hypertension, dietary history, habits present, physical activities, and sleep quality. The data collected from participants were entered in the Excel sheet. The BP was measured in the OPD of a tertiary care hospital. An appropriately sized cuff was used, with an inflatable bladder width that is at least 40% of the arm circumference and bladder length that is 80% to 100% of the arm circumference. Arm circumference is measured at a point midway between the acromion and the olecranon. BP was measured with the arm supported at the level of the heart and recorded using the auscultatory method (Korotkoff sounds IV). The results are interpreted according to “American Academy of Pediatrics Clinical Practice Guidelines for Screening and Management of High BP in Children and Adolescents” by Sinha et al. [Figure 1].[8] The diet history includes if they are vegetarian type or mixed type. A vegetarian diet is defined as one that does not include meat (including fowl) or seafood or products containing those foods.[9] Physical activity among adolescents is measured using the “Physical Activity Questionnaire for Adolescents (PAQ-A).”[10] The PAQ-A is a self-administered, 7-day recall instrument. It was developed to assess general levels of physical activity for high school students in grades 9–12 and approximately 14–19 years of age. The PAQ-A can be administered in a classroom setting and provides a summary physical activity score derived from eight items, each scored on a 5-point scale. Scoring is done as follows: Overall process-Find an activity score between 1 and 5 for each item (excluding item 9):
Classification of hypertension

Item 1 (Spare time activity): Take the mean of all activities (”no” activity being a 1, “7 times or more” being a 5) on the activity checklist to form a composite score for item 1
Item 2–7 (PE, lunch, right after school, evening, weekends, and describes you best): The answers for each item start from the lowest activity response and progress to the highest activity response. Simply use the reported value that is checked off for each item (the lowest activity response being a 1 and the highest activity response being a 5)
Item 8: Take the mean of all days of the week (”none” being a 1, “very often” being a 5) to form a composite score for item 8
Item 9: Can be used to identify students who had unusual activity during the previous week, but this question is NOT used as the part of the summary activity score.
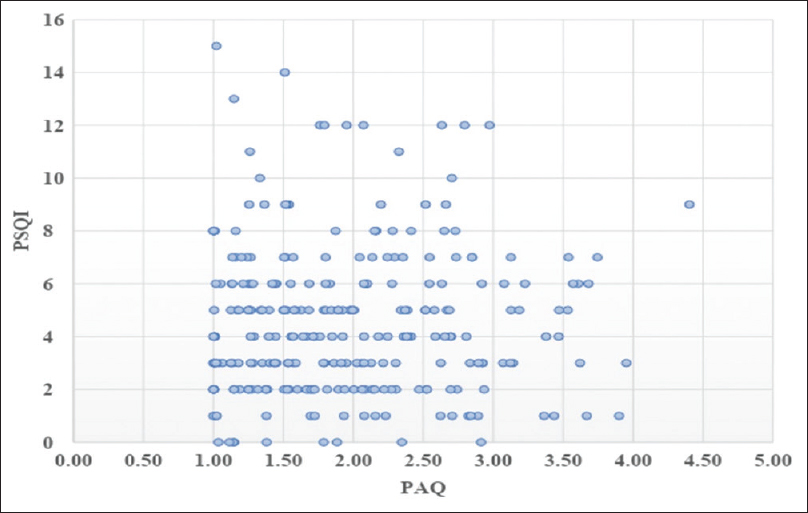
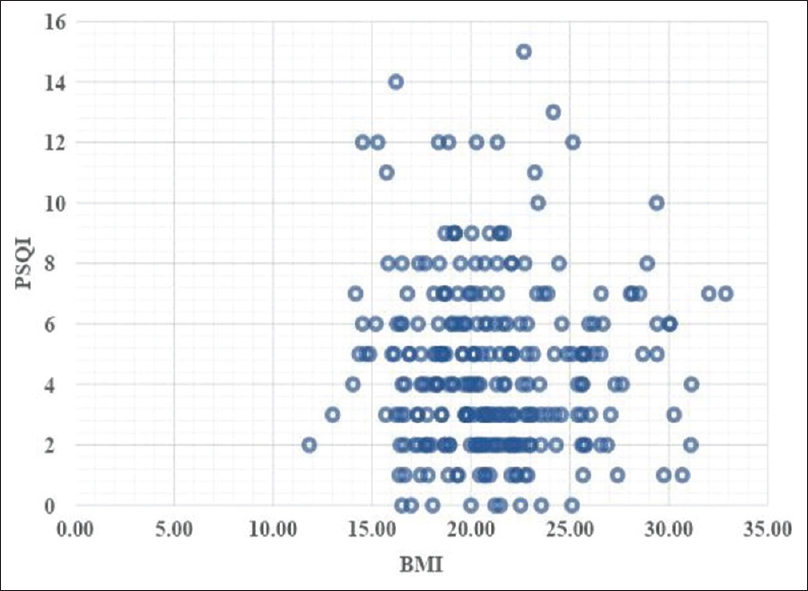
To calculate the final PAQ-A activity summary score: Once we have a value from 1 to 5 for each of the 8 items (items 1–8) used in the physical activity composite score, we simply take the mean of these 8 items, which results in the final PAQ-A activity summary score. For the final cutoff score, we have considered the study done by Benítez-Porres et al. titled “Cut-off values for classifying active children and adolescents using the PAQ: PAQ-C and PAQ-A” and have taken PAQ-A score cut-off points ≥2.73 to discriminate active adolescents.[11] A score of 1 indicates low physical activity, whereas a score of 5 indicates high physical activity. The sleep quality is measured using the Sleep Quality Assessment (Pittsburgh Sleep Quality Index [PSQI]). The PSQI is an effective instrument used to measure the quality and patterns of sleep in adults. It differentiates “poor” from “good” sleep quality by measuring seven areas (components): Subjective sleep quality, sleep latency, sleep duration, habitual sleep efficiency, sleep disturbances, use of sleeping medications, and daytime dysfunction over the last month. The scoring of PSQI is done as shown in [Figure 2]. A total score of “5” or greater is indicative of poor sleep quality[12] [Figure 3].
Scoring of PSQI. PSQI: Pittsburgh sleep quality index

PAQ and BMI. BMI: Body mass index, PAQ: Physical activity questionnaire

Data were entered into Microsoft Excel data sheet and were analyzed using the Statistical Package for the Social Sciences (IBM SPSS for windows, 13 Armonk, NY:IBM corp). The categorical data are represented in the form of frequencies and proportions. The Chi-square test was used to test the significance. The continuous data will be represented as mean and standard deviation. Independent t-test or Mann–Whitney U-test is used the test of significance to identify the mean difference between the two groups. Spearman correlation coefficients (r) were calculated to assess the degree of the association. P <0.05 was considered statistically significant.
Results
A total of 273 students were included in the present study. Those of age 18 years were 106 (38.8%) and 19 years were 167 (61.6%). Male: Female ratio is 1:1.6 with males 104 (38.1%) and females 169 (61.9%). One hundred and seven participants were 18 years old and 168 were 19 years old. Forty-seven (17.2%) had a history of hypertension in the family. A total of 230 (84.2%) consumed a mixed diet and 43 (15.8%) were vegetarians. Eighteen (6.6%) had no habit of consuming junk food, 74 (27.1%) had the habit of consuming junk food every day, and 181 (66.3%) consume junk food < 3 times a week. Fifty (18.3%) were sick or could not do physical activity the week prior to the study enrolment. Among 22 (8.1%) who had a history of addictive habits, 9 (40%) had the habit of smoking, 10 (45%) drinking and 3 (13%) had both [Table 1].
Sociodemographic profile of the study participants

The prevalence of prehypertension was 91 (33.3%) and hypertension 34 (12.5%). Among prehypertensive adolescents, 30 (31%) were male and 61 (67%) were female. Male: Female ratio is 1:2. For hypertensives, male: female ratio is 1:1.12 with 16 (47%) males and 18 (53%) females. The median (Interquartile range [IQR]) for the SBP: 110 (94–125) in males and 106 (96–124) in females. The median (IQR) for DBP was 76 (66.5–85.5) in males and 75 (68–84) in females. The mean ± standard deviation for SBP is 108 ± 21 and for DBP is 75 ± 12. In our study, there was no statistically significant association between gender and SBP DBP (P > 0.05) [Table 2].
Prevalence and comparison of study attributes between ge
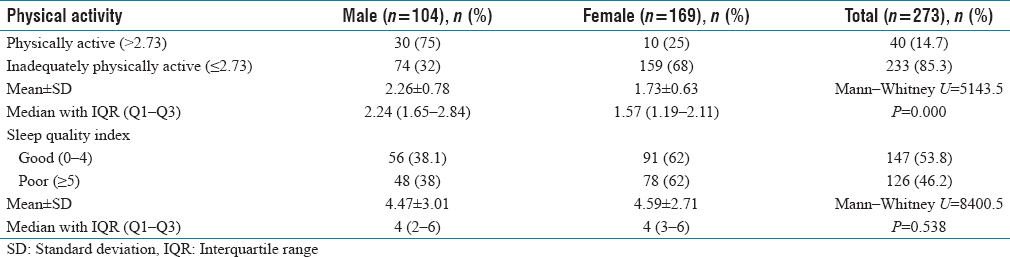
The overweight was seen to be 50 (18.3%), obesity 18 (6.6%), and 64 (23.4%) were underweight. Among overweight, male: female was 1:1.08, in obesity it was 1:2.5 and in underweight, it was 1:1.57. The median BMI is 21.4 (19.1–23.5) in males and 20.3 (18.3–22.4) in females. The overweight in hypertensives was 10 (29.4%) compared to prehypertensive 17 (18.7%). The number of obese people who had prehypertension was 5 (5.5%) and hypertension was 2 (5.9%). Seven (20.6%) hypertensives and 12 (18.9%) prehypertensives had a FH of hypertension and 28 (18.9%) had normal BP.
The mixed diet was seen in 29 (85.3%) hypertensives and 78 (85.7%) prehypertensives.
Inadequate physical activity was seen in 233 (94%) participants. Male: Female was 1:2.1 with 74 males and 159 females.
The inadequate physical activity was seen in hypertensives 32 (94.1%) compared to prehypertensives 76 (83.5%) and there is no statistical association between physical activity and hypertension (P > 0.05).
The median (IQR) PAQ score in males was 2.24 (1.65–2.84) and 1.57 (1.19–2.11) in females. This was statistically significant (P = 0.000) difference in PAQ score between males and females.
The prevalence of poor sleep quality was 48 (38%) in males and 78 (62%) in females. The male: female ratio is 1:1.62. The median (IQR) PSQI score in males was 4 (2–6) and 4 (3–6) in females. There was no statistical significance between poor sleep and hypertension (P > 0.05). [Figure 4]
Correlation of PSQI with PAQ. PSQI: Pittsburgh sleep quality index, PAQ: Physical activity questionnaire
The poor sleep quality in hypertensives is 17 (50%) compared to prehypertensives 38 (41.8%). [Figure 5]
Correlation of PSQI with BMI. BMI: Body mass index, PSQI: Pittsburgh sleep quality index
Among 8.1% of study participants who had addictive habits, 10 (29.4%) were hypertensives, 7 (7.7%) were prehypertensives, and 5 (3.4%) had normal BP [Table 3].
Association of hypertension status with risk factors
Discussion
A total of 273 cases that fulfilled the inclusion criteria were included in the study. The data were collected for the age group of 18–19 years among various students studying in our institution in the campus, 18 years being the minimum age of entry to these courses.
In our study, we found the male: female ratio of 1:1.6 with males 104 (38.1%) and females 169 (61.9%). Whereas a study by Sundar had 400 samples in which from each school fifty adolescent students (25 boys and 25 girls) were selected.[7] There was no significant statistical association between the study development of prehypertension, hypertension, and gender (P > 0.05).
In our study, it was found that 7 (20.6%) had a history of hypertension in the family. In a study done by Liu et al., the prevalence of hypertension was 973 (53.0%). Participants with positive FH had a significantly higher prevalence of hypertension (67.5%, 95% confidence interval [CI]: 63.3–71.7) than those without (47.9%, 95% CI: 45.2–50.6), and even among participants without hypertension, the BP levels were higher with positive FH.[13] It was said, this was because FH is a representative of gene variation and shared behaviors and environments.
In our study, we observed that the prevalence of prehypertension was 91 (33.3%) and hypertension 34 (12.5%). For the prehypertensives, the male: female ratio is 1:2 with 30 (28.8%) males and 61 (36.1%) females; male: female ratio for hypertensives is 1:1.1 with 16 (15.4%) males and 18 (10.7%) females. The median (IQR) for the SBP was 110 (94–125) in males and 106 (96–124) in females. The number noticed in our study is higher than that study conducted by McNiece which showed that 1066 (15.7%) prehypertension and 217 (3.2%) hypertension.[14] The number must raise concern since studies have shown that early prehypertension and hypertension will lead to long-term complications related to cardiovascular complications and effect morbidity. The SBP/DBP has no statistical significance with respect to the gender of the individual. A study by Juhász et al., showed that both systolic and mean BP values were higher in adolescent hypertensive boys than in girls.[15] Another study by Tao Xu et al., showed that the overall prevalence was 1244 (4.15%) for hypertension (4.73% for boys and 3.62% for girls) and 8953 (29.85%) for high normal BP (33.40% for boys and 26.65% for girls). The odds ratios (ORs) increased with age, but the absolute changes of ORs were significantly different between boys and girls.[16]
They also interpreted no statistical significance for SBP (P = 0.680), DBP (P = 0.926) with gender. A study conducted by Syme et al. says that during adolescence, the body composition changes significantly. In girls, there is an increase in fat mass and insulin resistance whereas, in boys, testosterone increases muscle mass. Both fat mass and fat-free mass are positively associated with BP.[17]
The underweight male: female ratio was 1:2.5 with females being 46 (27.2%) and males 18 (17.3%); 6.7% of males and 6.5% of females were obese, male: female ratio being 1:1.57. The median (IQR) BMI was 21.4 (19.1–23.5) in males and 20.3 (18.3–22.4) in females, the median (IQR) was 21.4:20.3 (Male: Female). There is a statistical significance among the gender and BMI (P = 0.024). It is seen that overweight was more in hypertensives 10 (29.4%) compared to prehypertensive 17 (18.7%), there was no statistically significant association between hypertension status and BMI. The inadequately physically active was seen more in hypertensives 32 (94.1%) compared to prehypertensives 76 (83.5%), with no significant statistical association between physical activity and hypertension (P = 0.296). Although statistically there is no association, clinically physical inactivity becomes a very significant factor for the development of hypertension. A study by Li et al. has shown that, in comparison with normal weight subjects who reported high levels of physical activity, subjects who reported both low levels of physical activity and obesity showed the highest risk of hypertension.[18] Another study by Paffenbarger et al. have shown that alumni who did not engage in physical activity were 35% higher at risk of developing hypertension than those who did.[19] Studies have shown that aerobic exercise reduces BP in both hypertensive and normotensive persons. An increase in aerobic physical activity should be considered an important component of lifestyle modification for the prevention and treatment of high BP.[20]
In our study, we found that 22 (8.1%) of participants had addictive habits and 10 (29.4%) were hypertensives. There was a significant statistical association between habits and hypertension (P = 0.000). This again is a concerning factor. Habits such as alcohol consumption and smoking are known to be unhealthy and their association with hypertension is well known. The adolescent population must be sensitized with preventive education about the deleterious effects of these habits. A study by Thuy et al. showed there were significant trends of increasing prevalence of hypertension with increasing years (P = 0.05) and pack-years (P = 0.03) of smoking after adjusting for age, BMI, and alcohol intake. Relative to never-smokers, the risk of hypertension for those who had smoked for 30 years or more and those who had smoked 20 pack-years or more were 1.52 (95% CI: 0.95–2.44) and 1.34 (95% CI: 0.94–1.91), respectively.[21] Another study done by Dochi et al., revealed that smoking is independently related to the onset of hypertension and systolic hypertension in Japanese male workers.[22]
The poor sleep quality was seen in hypertensives 17 (50%) compared to prehypertensives 38 (41.8%). There was no statistical association between sleep quality and hypertension (P = 0.574). A study by Nasution et al., showed higher SBP in adolescents with poor sleep quality compared to those with good sleep quality.[23] Another study by Bansil et al. showed that the prevalence of hypertension was 30.2% and 7.5%, and 33.0% and 52.1% reported having sleep disorders, short sleep, and poor sleep, respectively.[24] Hence, studies have shown a strong association between the quality of sleep and hypertension. Thus, the importance of sleep quality must be made aware to adolescents by parents, teachers and mass media communication systems.
Limitations
This study is a single centered, largely restricted to adolescents from the age group of 18 to 19 years.
A multi-center study from different genetic/ethnic background would give more insight to data.
Conclusion
Change in habits and dietary modification will have an impact on the development of prehypertension and or hypertension among adolescents. More emphasis must be given to screen adolescents at college entry. Adolescents are the best target age group for primordial prevention.
What is known
It is seen that FH of hypertension significantly contributes to the prevalence of hypertension. Modifiable factors such as obesity, physical inactivity, and smoking are the major risk factors to the development of hypertension.
What this study adds
Re-emphasizes the importance of lifestyle, dietary modifications, and habits in the prevention of hypertension in adolescents with or without FH of hypertension.
Footnotes
Acknowledgements
The authors would like to thank Dr. Jayshree M Seeri Professor and Head Department of Community Medicine, BGS Global Institute of Medical Sciences, Bengaluru.
Conflicts of interest
There are no conflicts of interest.
Institutional ethical committee approval
Approved by the IEC of BGS GIMS Refrence number of final approval: BGSGIMS/IEC/App/Nov/2021/016.
Funding
Nil.
Author's contribution
AR study conceptualization, data collection, analysis and manuscript writing; AYV, SCN: Data analysis and manuscript writing, SCN: Data collection, manuscript writing; NDM: Statistical analysis, SCN, ACR revised the manuscript critically for important intellectual content. All authors approved final version of manuscript. Dr. Amrutha Reshi, Major (Dr.) Abhijith Y. Vm, Dr. Sharath Chandra N, Dr. A. C. Ramesh, Narayanaswamy D. M.