
Abstract
Clinical islet transplantation programs rely on the capacities of individual centers to quantify isolated islets. Current computer-assisted methods require input from human operators. Here we describe two machine learning algorithms for islet quantification: the trainable islet algorithm (TIA) and the nontrainable purity algorithm (NPA). These algorithms automatically segment pancreatic islets and exocrine tissue on microscopic images in order to count individual islets and calculate islet volume and purity. References for islet counts and volumes were generated by the fully manual segmentation (FMS) method, which was validated against the internal DNA standard. References for islet purity were generated via the expert visual assessment (EVA) method, which was validated against the FMS method. The TIA is intended to automatically evaluate micrographs of isolated islets from future donors after being trained on micrographs from a limited number of past donors. Its training ability was first evaluated on 46 images from four donors. The pixel-to-pixel comparison, binary statistics, and islet DNA concentration indicated that the TIA was successfully trained, regardless of the color differences of the original images. Next, the TIA trained on the four donors was validated on an additional 36 images from nine independent donors. The TIA was fast (67 s/image), correlated very well with the FMS method (R 2 = 1.00 and 0.92 for islet volume and islet count, respectively), and had small REs (0.06 and 0.07 for islet volume and islet count, respectively). Validation of the NPA against the EVA method using 70 images from 12 donors revealed that the NPA had a reasonable speed (69 s/image), had an acceptable RE (0.14), and correlated well with the EVA method (R 2 = 0.88). Our results demonstrate that a fully automated analysis of clinical-grade micrographs of isolated pancreatic islets is feasible. The algorithms described herein will be freely available as a Fiji platform plugin.
Keywords
Introduction
Since the breakthrough clinical trial published by the Edmonton group in 2000, transplantation of isolated pancreatic islets has become a promising therapeutic approach for patients with type 1 diabetes (24). Other centers have also reported good results with respect to protection from severe hypoglycemic episodes and even insulin independence (2,13). However, these results are not globally consistent. Clinical islet transplantation programs rely on the capacities of individual centers to evaluate the grafts they produce; an inconsistent quantity of islets in the graft is a potential factor contributing to variation in the success rate.
The methodology for the quantification of islets was first developed and standardized by Ricordi et al. (19). While many centers still count islets manually using a microscope and a 50-μm grid, over the past two decades the methodology has become computerized and partially automated (4,7–10,12,17,18,27,31). Some centers have designed their own macros using various semiautomated algorithms for digital image analysis built for their respective microscope systems (8,10). Other centers have developed dedicated software applications for semiautomated digital image analysis using different, and sometimes costly, platforms such as MetaMorph (9,15,17). However, none of these technologies are fully automated, freely available, or widely used. To date, only one inter-laboratory study has been conducted, which found considerable interoperator variation in islet count among 35 technicians using the grid-assisted manual count method. The study also showed reduced count variation among three technicians using a computer-assisted method (15). In addition to operator-related variation, Friberg et al. (8) found significant errors associated with islet graft sampling. Sampling error can potentially be reduced by evaluating a sufficient number of samples. However, efficiency of current computer-assisted methods is limited by required manual input from operators. The only currently available fully automated analysis of digital images of islets is a dedicated islet cell counter (4). However, it is expensive, and comparisons among operators and centers regarding count precision have yet to be undertaken. A common automated tool could improve good laboratory practice, especially for international clinical trials.
Clinically important islet graft parameters include the islet volume [measured in islet equivalents (IEs)], islet count, and islet size distribution. It has been shown (4,7–10,17,27,31) that this information can be extracted from islet micrographs using two-step image analysis. In the first step, the islets are distinguished from nonislet tissue via a process called “segmentation.” Historically, the techniques used for segmentation have included manual thresholding (9) and watershed transformation (10). In the second step, areas of the segmented images attributed to islets are converted into individual islet volumes using a three-dimensional (3D) islet model. Sphere (8,10,17,19) or prolate spheroid (9,17) models have traditionally been used for this purpose.
In this article, we evaluate the feasibility of a novel approach to the segmentation step of islet image analysis, which becomes fully automated after an initial training period. We show that the trainable islet algorithm (TIA) can automatically segment a large number of previously unseen images in a short time, and with a high degree of accuracy, after being trained on a limited number of images. We also show that our nontrainable purity algorithm (NPA) can fully and automatically assess the purity of islets with an acceptable degree of accuracy.
Materials and Methods
Study Design
All work with animal and human tissues was performed in accordance with the approval 712a/13 (G 13-04-10) issued by the ethics committee of the Institute for Clinical and Experimental Medicine and Thomayerova Hospital (Prague, Czech Republic).
Original micrographs of isolated pancreatic islets were segmented, either manually or automatically, into islets and exocrine tissue in order to count the islets and calculate islet volume and purity. First, the manual methods used to generate the reference data (ground truth) were validated. Next, the automated methods were validated. The TIA for islet counting was trained and validated using 82 original micrographs from 13 different donors (Fig. 1A, left). The automated NPA, which calculates islet purity, was validated on a subset of 70 micrographs from 12 donors (Fig. 1A, right).

(A) The TIA and NPA, two algorithms for the automated assessment of islet images, are shown in the black boxes. The TIA (left) was trained using the original islet images and the corresponding ground truth segmentations, produced by the FMS method. The training set consisted of a number of image–segmentation pairs. The dashed arrow represents downsampling of the images during training. The TIA was validated using image–segmentation pairs (i.e., the testing set) composed of images not used for training. The individual islets were counted, and their volumes were calculated from the TIA and the FMS methods and compared for TIA validation. The NPA (right) was not trained. This method of purity assessment was validated against results generated by the EVA method. (B) The FMS was validated against an internal DNA standard. Ten samples of 1–58 pure rat islets were stained with dithizone, and microscope images of the samples were acquired and segmented in triplicate by the FMS method. The DNA content of each sample was determined using the PicoGreen method. Islet volumes (IE) were calculated from the triplicate segmentations. The extent of the correlation between DNA content and islet volume was assessed by linear regression. (C) The EVA method was validated against the validated FMS method. Five independent experts visually assessed the purity of 46 islet images. The mean expert-determined purities (y-axis) were calculated and correlated with the purities determined by the FMS method (x-axis). (D) The TIA was trained on full size and downsampled image–segmentation pairs. The possible loss of useful information was assessed by the leave-one-out cross-validation method on 12 images from set B (shown in Table 1). Receiver operating characteristic (ROC) curves were constructed for three image sizes and compared. The false positive rate (FPR = 1 - specificity) is on the x-axis. The true positive rate (TPR = sensitivity) is on the y-axis. Circle: full-size images, cross: half-size images, ×: quarter-size images. (E) The TIA was trained, either on images from a single donor (a–d, x-axis) or on a randomly selected half of each donor's images (50 randomized allocations, r, x-axis). Trained tools TIA-A, -B, -C, and -D were tested on 34, 36, 32, and 34 images from three (out of four) donors not used for training (a–d, x-axis). The 50 trained TIA-R were tested on a total of 46 images from all four donors, where each image was used 14–34 times, producing 1,150 segmentations (r, x-axis). The Tukey box plot depicts the pixels attributed to islets by the TIA, relative to the pixels assigned to islets by the FMS method (y-axis); median (horizontal line), first and third quartiles (box), 1.5 interquartile range (whiskers).
Isolation of Rat Islets
Islets from Wistar rats (450 g, 5 months old) were harvested using a previously described method (22). Briefly, the main pancreatic duct was cannulated in an anesthetized animal. After sacrifice, the pancreas was filled with 15 ml of 1 mg/ml collagenase (Sevapharma, Prague, Czech Republic) before being excised and incubated for 22 min at 37°C. Pure islets were then harvested from the layer of 1,094 g/L of a discontinuous Ficoll gradient. Islets were stabilized overnight in 5 ml of CMRL (Cellgro; Mediatech, Manassas, VA, USA) medium supplemented with 10% fetal bovine serum (FBS).
Isolation of Human Islets
Human islets were isolated from cadaver donors following a protocol based on that described in Ricordi et al. (20). Briefly, a mixture of a collagenase and neutral protease (Serva, Heidelberg, Germany) was instilled into the main duct of the pancreas. Collagenase from either of the two producers was used (VitaCyte, Indianapolis, IN, USA). After incubation in a Ricordi chamber (20), the islets were separated from the exocrine tissue via centrifugation using a COBE 2991 Cell Processor (Terumo BCT, Tokyo, Japan) and continuous Ficoll gradient (Biochrom, Cambridge, UK). The isolated islets were stabilized in a CMRL-based medium. Routine test samples were taken to assess graft quantity and quality.
Sample Preparation, Microscopy, and Digital Imaging
Isolated islets (100 μl) were stained in a Petri dish with 10–25 μl of dithizone (DTZ; Sigma-Aldrich, St. Louis, MO, USA). Fifty milligrams of DTZ was dissolved in 800 μl of 70% ethanol with 400 μl of 1 M NaOH, mixed and diluted with 15 ml of phosphate-buffered saline (PBS) or Hank's balanced salt solution (HBSS; Sigma-Aldrich) or PBS supplemented with 0.2% albumin. After 1 min, 4 ml of HBSS/albumin was added and the dye dispersed. The islets were gently swirled toward the center. Samples were imaged using a zoom stereo microscope (model SZ60; Olympus, Tokyo, Japan) with inclined incident illumination on a white background and a digital camera equipped with a CMOS 1/2” 3 MP image sensor (MicroCam; Bresser, Rhede, Germany). Each RGB image was 2,048 × 1,536 pixels in size. The pixel size ranged from 2.4 to 4.9 μm for magnifications between 10× and 20×.
Determination of DNA Content
After imaging, DTZ-stained pure islets were handpicked and washed before being individually picked up in a total volume of 10-15 μl and placed into 150 μl of lysis buffer [1% sodium dodecyl sulfate (SDS; Sigma-Aldrich), 10 mM ethylenediaminetetraacetic acid (EDTA; Sigma-Aldrich), and proteinase K (Sigma-Aldrich) 50 μg/ml in 20 mM Tris-HCl (Sigma-Aldrich), pH 7.4], sealed, and incubated overnight at 37°C. DNA content in the vortexed lysate, diluted to at least 1:200, was determined using a Synergy 2 fluorometer (Ex: 485/20 nm, Em: 528/20 nm) (Bio-Tek, Winooski, VT, USA). PicoGreen (1) fluorescent intercalating dye (P7589; Molecular Probes, Eugene, OR, USA) was used as the probe because it is highly specific for dsDNA and suitable for cell lysates. Neither DTZ nor albumin would interfere with the assay at such a dilution. Lambda phage DNA was used to prepare the standard dilution curve (Molecular Probes).
The Fully Manual Segmentation (FMS) Method
Ground truth segmentations of islets were created using the FMS method. An expert in islet counting used the GNU image manipulation program (GIMP 2.8.4) to manually delineate individual islets (25). Segmentation layers were exported as png files and converted to 1-bit images. The best-quality standard segmentations were determined via the majority vote method, based on the consensus of three independently created segmentations. Individual pixels were labeled as islets if they were marked as islets in at least two out of three sessions. Areas attributed to individual segmented islets were converted into normalized islet volumes, taking 1.767146 nl as 1 IE and using a table of IEs for discrete sets of islet diameters that increase in 50-μm increments (19). Islet diameter “d” was calculated from individual islet area, assuming a circular shape where d = 2√(area/π) (8,15). Islets with a diameter smaller than 50 μm were not included in the assessment because they could not be reliably distinguished because of image resolution. Exocrine tissue was segmented using the same procedure described above. The total areas of exocrine tissue (Ae) and islets (Ai) were determined from each segmentation. Purity (Pu) was calculated as the ratio of the total area of the islets to the total tissue area: Pu = Ai/(Ai + Ae).
Expert Visual Assessment (EVA) Method
Five experienced operators were separately given images of DTZ-stained islets with varying purities. Each operator visually estimated purity as the fraction of islet tissue in the total tissue amount. The procedure involved two complementary steps. In the first step, the operator estimated the percentage of exocrine tissue in the total tissue and subtracted that percentage from 1.0 to obtain the percentage of the remaining tissue. In the second step, the operator estimated the percentage of islets in the total tissue amount. The final estimated purity was calculated as the average of the two steps. For each image, the average purity obtained from the five operators was used as a reference.
Automated Algorithms
The TIA segments individual islets from an input image. To eliminate differences in illumination and camera settings, the algorithm first color normalizes the images by assuming that the most common color is the background. The whole image is then color transformed, such that the background becomes white and the dynamic range is fully used. Uneven illumination was corrected by fitting a second-order polynomial to approximately identified background pixels (29). The algorithm then uses a random forest classifier (3) to create a probability map of islets based on individual pixels, using RGB color components as features (30). A final binary classification (islets vs. nonislets) is derived from the probability map by employing spatial regularization using GraphCut (16). The TIA calculates the volumes of the islets from the segmentations using the same model described for the FMS method.
For the assessment of islet purity by the NPA, binary segmentation is extended to a three-class segmentation (islets, exocrine tissue, and background). We chose to use an unsupervised k-means clustering algorithm (14) for this task because of image variability and a limited amount of available training data. After overclustering the image pixels into seven color-based clusters, clusters corresponding to the three classes of interest are identified using two descriptors: the centroid ratio of the G and R channels (Gc/Rc) and the normalized cluster area (i.e., the area of every cluster divided by the maximum cluster area). Use of these descriptors was motivated by the observation that the largest image component is usually the background and that islets and exocrine tissue are best distinguished by their respective reddish and yellowish colors. Optimal descriptor value thresholds are determined empirically using a training set of images with known purities. In the final step, purity is calculated as the ratio of the islet area to the total area of the tissue.
The above-described algorithms were implemented for use on the Fiji platform (ImageJ 1.48e) (23) and can be requested for free from the authors.
Data Evaluation and Statistics
To compare the automatic and ground true segmentations, a pixel-wise analysis method was developed using the statistical performance measures for the binary classification task. These measures included the number of true positives (TP), false positives (FP), true negatives (TN), and false negatives (FN). The sensitivity (Se), specificity (Sp), precision (P), relative error (RE), and relative islet area (RIA) were calculated as:
Se = TP/(TP + FN)
Sp = TN/(TN + FP)
P = TP/(TP + FP)
RE = ∗∗∗|(TP + FP) - (TP + FN)|/(TP + FP)
RIA = (TP + FP)/(TP + FN)
The performance of the trained TIA was evaluated via leave-one-out cross-validation (6).
Receiver operating characteristic (ROC) curves were generated using all data obtained from individual classifiers (in the cross-validation) (21).
Repeatability was assessed from coefficients of variation (CV). The results are expressed here as medians, 95% mean confidence intervals (CIs), or by the mean ± standard deviation (SD). Means were compared using two-tailed unpaired Student's t-tests. Tukey box plots were used to visualize the data (26).
Results
Validation of the FMS Method
The repeatability of the FMS method was separately assessed on 135 pure rat islets and 1,117 nonpure human islets (Table 1, sets A and B, respectively). Completely and partially embedded islets were present in about half of the images from set B (Fig. 2, arrows). The results, summarized in Table 2, showed good repeatability of the FMS method with respect to islet area, count, and volume, irrespective of the presence or absence of exocrine tissue (CVs ranged from 0.02 to 0.05 for sets A and B). The limitations of the FMS method were tested by evaluating repeatability for a subclass of fully embedded islets from the same 12 images (Table 1, set B). The mean CV increased to 0.12 (95% CI: 0.04–0.20) when the triplicate FMS segmentations were evaluated exclusively for 35 fully embedded islets, indicating that such islets must not dominate images if high-precision ground truth data are required.

(A) DTZ-stained islet graft images (a–d) representing images from four donors (A–D, see also Table 1). Arrows (b–d) indicate fully embedded islets; (e) shows the ground truth segmentation of image (c). In (f), the same image was segmented automatically by the trained TIA. (B) Training capability was a ssessed via a pixel-to-pixel comparison between the automatically determined and ground truth segmentations. Visual output of the pixel-wise analysis for a single image (c–f on panel): true negative (blue), true positive (red), false negative (green), and false positive (white) pixels are visualized. Islets segmented by the FMS method are composed of red and green pixels. Islets segmented by the TIA method are composed of red and white pixels. (C) Eight images (e1–e9) representing eight of the nine independent donors of 36 images used for validation of the TIA-ABCD tool. Details of these images are given in Table 1. (D) Unsuitable images contain (a) large chunks of exocrine tissue (arrow) or small islets embedded within large pieces of exocrine tissue (arrowheads), (b) overdigested islets with blurred borders, (c) poorly stained islets with pale centers, and (d) weakly stained islets.
The Image–Segmentation Pairs Used in the Study

High-quality reference segmentation by the majority vote method.
Repeatability of the FMS Method
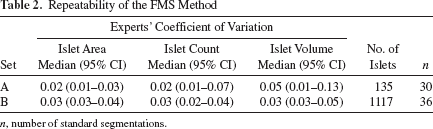
n, number of standard segmentations.
The accuracy of the FMS method was validated against the DNA standard. A total of 135 handpicked pure rat islets (Table 1, donor A) were distributed across 10 samples with increasing numbers of islets. The DNA content was determined for each sample (1), and islet volume was calculated using the FMS method. The correlation between DNA content and the volume of islets present in the sample is shown in Figure 1B (R 2 = 0.98, with three independent volume estimates per image). The average DNA concentration was 8.4 ng/IE (95% CI: 7.8–9.0 ng/IE, n = 30), which is in agreement with previously published values (11,12,18).
Validation of the EVA Method
Applying the FMS method to exocrine tissue is possible, but extremely time consuming. We therefore tested the robustness of a visual assessment of purity using the EVA method based on the results of five experts. To validate this approach, the exocrine tissue was manually segmented by the FMS on a total of 36 images with varying islet purity from three donors (Table 1, donors B–D). The mean CV for purity estimated by the five experts for the same images was 0.18 (n = 36). The EVA-based estimation of islet purity and the FMS-based purity determination were strongly correlated (R 2 = 0.95) (Fig. 1C), and the slope of the regression line was close to 1 (1.01). The EVA method was therefore used to produce reference purities for NPA validation.
Training Time of the TIA
To reduce the computational time required for TIA training, images and their corresponding ground truth segmentations were downsampled to 512 × 384 pixels. ROC curves for the full-size and downsampled images were generated for 12 images with various islet purities (Table 1, donor B) using leave-one-out cross-validation. The ROC curves generated for the full size and down-sampled images were virtually identical (Fig. 1D), demonstrating that downsampling in training does not lead to an appreciable loss of useful information. Downsampling reduced the average training time required on a standard laptop computer (Intel Core Duo CPU 2.54 GHz, 8 GB RAM) from 1,200 to 28 s/image. The segmentations created from full-size and downsampled images were compared using pixel-wise measures of sensitivity (0.95 ± 0.02), specificity (0.996 ± 0.003), and precision (0.94 ± 0.03). These measures were all close to 1, indicating a very good agreement.
Trainability of the TIA
The TIA was developed to automatically segment clinical-grade islet images based on training data. Variation in image quality is expected in the clinical setting despite standardized image acquisition. To establish the feasibility and robustness of our approach, we tested the hypothesis that training the TIA on images from several donors, with different acquisition setups, would impart the capacity to automatically segment similar images from multiple donors. Two training/testing schemes were designed to test this hypothesis.
In the first training scheme, the TIA was separately trained four times, each time on a single donor using all its image–segmentation pairs, producing trained tools TIA-A, TIA-B, TIA-C, and TIA-D. Each trained TIA was then applied to all of the images from the other three donors. Each trained TIA produced 32–36 automated segmentations, depending on the donor (Table 1, donors A–D). In total, 136 automatic segmentations were produced from 46 images.
In the second training scheme, the TIA was trained 50 times, each time on a randomly selected half of the image–segmentation pairs from each donor (Table 1, A–D). Each trained TIA tool (TIA-R-No.) was then applied to the other half of the images (i.e., the images not used for training the algorithm). The image–segmentation pairs were randomized to avoid selection bias. As a result, individual images were presented 16–36 times during 50 training iterations and a similar number (14–34) of times during testing. An example of a randomized allocation for one of the trained TIA-R tools is shown in Table 3. In total, 1,150 segmentations of 46 images were produced. A total of 1,286 automated segmentations were compared in a pixel-wise manner to the ground truth segmentations via direct visual comparisons (Fig. 2B), and the relevant statistics were calculated. For the TIA trained on single donors, the RE of the islet area ranged from 0.05 to 0.17, and the RIA ranged from 0.89 to 1.17 (Fig. 1E, a–d).
Trained tool TIA-R-21/50

ID, identification code.
These data demonstrated that the image groups differed in appearance and that the TIA trained on a single group of images did not consistently produce good-quality segmentations of images from other donors (Fig. 1E, a–d). However, the mean RIA for the TIA trained on half of images from all four donors was 0.99 and the RE was 0.07, indicating a clear improvement in the quality of the segmentations (Fig. 1E, r). Only three images (out of 46), representing 51 observations (out of 1,150), were incorrectly segmented (outliers in Fig. 1E, r). The results indicate that, given a suitable training set, the TIA is able to provide correct segmentations of images acquired under different conditions from multiple donors.
Repeatability and Validation of the TIA Against the DNA Standard
The repeatability of the TIA from the above experiment was evaluated for 46 images and 50 randomizations. The mean CV was 0.02 (n = 16–26). For three of the images (out of 46), the CV ranged from 0.05 to 0.15. These images were the above-mentioned outliers.
The accuracies of the 50 trained TIA-R tools described above were validated against the internal DNA standard in a manner similar to that undertaken for FMS validation, using the same set of images of pure islets (Table 1, donor A) and corresponding DNA samples. Here each original image was automatically segmented approximately 25 times (range: 21–36 times, depending on the random allocation of each image to either the training or the testing group). The resulting 250 randomized TIA-R segmentations were compared to the ground truth (for each of the 10 images, 14–29 of the 50 random assignments did not contain the image being evaluated). The RE of the islet area was 0.04 (95% CI: 0.03–0.05), and the correlation between the automatically estimated islet volumes and the corresponding DNA contents was R 2 = 0.99. The average islet DNA content was 8.6 ± 1.7 ng/IE (95% CI: 7.6–9.6 ng/IE), which was in good agreement with the ground truth and is within the previously published range (11,12,18).
Evaluation of the TIA on Independent Donors
The TIA is intended to be trained on a limited number of images from several donors before being able to automatically analyze images from other donors not included in the training set (called here “independent donors”). This generalization ability of the TIA was tested here (the training ability of the algorithm tested above used different images but the same donors for training and evaluation). The TIA was trained on 46 images from four donors (Table 1, A–D), producing a trained tool called TIA-ABCD. The trained tool TIA-ABCD was then applied to 36 images of islets from nine independent donors (e1–e9) (Table 1 and Fig. 2C). The group of images was heterogeneous, created using two different stereomicroscopes equipped with the same type of the camera but using various settings. The automatic segmentations, counts, and islet volumes were compared to ground truth data produced by the FMS method. The pixel-wise comparison revealed an acceptable RE (median RE = 0.04, n = 36). The automatically determined islet volumes and counts correlated well with the ground truth (R 2 = 1.0 and 0.92, for volumes and counts, respectively, n = 36) (Fig. 3A and B). Finally, the automatically determined volumes and counts were expressed relative to the ground truth (TIA/FMS ratio) for each image (Fig. 3C). Automatically determined islet volumes were marginally overestimated by the TIA-ABCD (median ratio: 1.03, n = 36), and islet counts were the same as the ground truth (median ratio: 1.00, n = 36). Figure 3B shows very good agreement between the two methods in the number of islets for all images, with the exception of the two images with the greatest numbers of islets. In these cases, it was sometimes difficult to distinguish one islet from two closely spaced smaller ones. Exocrine tissue was also occasionally erroneously classified as islets. The automatic determination of islet parameters for all 36 images took 40 min (mean: 67 s/image).

Validation of the TIA and NPA on independent donors. The TIA-ABCD tool was trained on 46 images from four donors (A–D, see also Table 1) and tested on 36 images from nine other donors (e1–e9, see also Table 1 and Figure 2C), for which GT segmentations were generated using the FMS method. (A) Correlation between the values for islet volume obtained by the TIA and the FMS methods. (B) Correlation between the values for islet count obtained by the TIA and the FMS methods. (C) The Tukey box plot shows TIA-ABCD volumes and counts relative to the ground truth (y-axis); mean (cross), median (horizontal line), first and third quartiles (box), 1.5 interquartile range (whiskers). (D) Islet purities were assessed by the NPA for 70 islet micrographs from 12 donors and compared to reference purities produced via the EVA method. Correlation between automatically estimated islet purities (y-axis, purities determined via the NPA) and the reference purities (x-axis, purities determined via the EVA method). (E) The Tukey box plot shows the relative NPA purities for 70 donors.
Validation of the NPA for Automatic Purity Assessment
The NPA was designed to automatically estimate islet graft purity from micrographs. The algorithm does not require training; the parameters used to identify the classes of interest (see the section on Automated Algorithms) were determined using 12 islet images of varying purities (Table 1, donor B). The FMS segmentations with three classes (islets, exocrine tissue, and background) were used as reference data. The NPA was validated on 70 images from the remaining 12 donors (Table 1, A, C, D, and E1–E9). For validation, five experts estimated purities using the EVA method. The degree of variability among the experts was similar to that observed during validation of the EVA method (CV = 0.19, n = 70). The automatically determined and reference purities were strongly correlated (R 2 = 0.84), and the slope of the regression line was close to 1 (Fig. 3D). The median relative NPA purity for all 70 images was close to 1 (1.02), and the mean purity was 1.14. A Tukey box plot identified seven image outliers (out of 70 images) (Fig. 3E). The automatic purity assessment of all 70 images was accomplished within 80 min (mean: 69 s/image).
Discussion
In this work, we developed, implemented, and validated two algorithms (i.e., the TIA and the NPA) designed to automatically segment pancreatic islets and exocrine tissue from microscopic images for the purposes of enumerating individual islets and estimating islet volumes and islet purities.
The islet count and volume are major determining factors for the transplantability of grafts to human recipients. Another factor that could potentially restrict graft transplantability is the degree of contamination by the exocrine tissue. In this case, the limiting factor is not the purity itself but the total volume of the graft tissue in milliliters; the maximum allowable volume is a multiple of the necessary volume of islets. Therefore, while the highest possible purity is desirable, its precise determination is not essential. Instead, the ability to categorize samples as having a high, intermediate, or low purity is acceptable. Supervised training of a machine-learning algorithm can greatly improve the precision of automated image segmentation. However, training requires the creation of reference segmentations, which is time-consuming and apparently not necessary for purity assessment. These facts led us to develop two different automatic tools: the TIA and the NPA. Our strategy involved using a trainable algorithm for automated islet segmentation (TIA) and an unsupervised algorithm for segmentation of the exocrine tissue (NPA). The TIA and NPA tools were developed as plugins for the free, professional image analysis software program ImageJ.
High-quality ground truth segmentations are necessary to employ machine learning, and the methods used for their generation need to be validated. We consider the manual delineation of islets (i.e., the FMS method) to be a preferable approach for creating ground truth segmentations because it allows experts to treat islets individually despite variation in the color composition of islets on the same image. We chose two objectively measurable parameters for the validation of the FMS method: islet DNA content and the repeatabilities of islet count and volume determination. The first parameter is based on a sensitive and robust DNA measurement and the determination of islet volume by the validated method. Three other independent assessments have been previously reported, ranging from 4 to 10 ng/IE (11,12,18). The FMS method yielded a high degree of correlation between islet volume and DNA content (Fig. 1B) and was in good agreement with previously reported absolute values (8.4 ± 1.6 ng/IE). Pure rat islets (not human) were used for two reasons: first, to avoid DNA degradation (rat islets have easier logistics and are not so easily damaged by extensive handling), and second, to minimize the likelihood of false overestimation due to interference by non-segmented exocrine tissue with its own DNA. The images of rat islets were acquired at a similar magnification to the clinical-grade images (Table 1). The borders of the rat islets were visually similar to those of human islets, for the purpose of manual delineation. That the similarity in the islet images from the two species was sufficient was also supported by the similar repeatabilities obtained for pure rat islets and nonpure human islets (Table 2, sets A and B). The second parameter, the repeatability of the FMS method, was high (Table 2), even for images containing a small number of embedded islets.
The training ability of the TIA tool was validated in two steps. The first step used 46 images from donors included in the training of 50 TIA tools (Fig. 1E, r). These 50 trained TIA tools demonstrated that, provided a sufficient qualitative range of images is used for training, the algorithm is capable of segmenting islet images from various donors with high precision (islet DNA content was 8.6 ± 1.7 ng/IE), good repeatability (CV = 0.02), and a low RE (0.07). In the second step, the application of the TIA to future images was modeled using 36 images from nine additional donors that were not included in the training set (Fig. 2C). On the basis of our experience with the FMS method, we excluded images unsuitable for manual analysis. Excluded images had borders that were difficult to define by the expert producing the manual segmentation: islet substantially covered by exocrine tissue, small islets embedded within large pieces of exocrine tissue (Fig. 2D, a), large and thick chunks of exocrine tissue (Fig. 2D, a), and grossly overdigested islets with many small fragments or blurred borders (Fig. 2D, b). Micrographs containing unevenly stained islets with pale interiors (Fig. 2D, c) or very weakly stained islets (Fig. 2D, d) were also problematic. Furthermore, images of islets cultured for several days were excluded due to the gradual, uneven, and patchy loss of the DTZ staining, which made the reliable delineation of islets very difficult. However, images with very different color compositions (Fig. 2C), such as a greenish or bluish background or purple islets, were included in the analysis as long as the FMS method could be applied with confidence. These color variations can be likely attributed to incorrect camera settings. Given these limitations, the TIA trained on four donors (TIA-ABCD) and applied to nine other donors correlated well with the ground truth in terms of islet volume and count (Fig. 3A and B). The mean and median relative islet volume and count were close to 1 (Fig. 3C).
The TIA is trained once on a range of images at a reasonable training speed (two images per minute). Following training, the algorithm can be used to analyze future images at a pace of one image per minute and with an accuracy that makes it useful in a clinical setting. At present, images with multiple islets in spatial contact with one another should be avoided because they risk being segmented as a single unit, leading to an overestimation of islet volume and an underestimation of islet count. Future upgrades of the TIA tool currently under development may be able to automatically resolve the separation of closely spaced islets (28). Another area of future study is the complicated relationship between islet shape in 2D images and islet volume; here we simply apply the currently used classical spherical islet shape model (19). An effort to obtain more accurate automated estimates of the volumes of islets from their 2D images is underway (5) to complement the automated segmentation process described in this work.
The manual delineation of exocrine tissue by the FMS method is laborious; therefore, for this study, a substitute method was needed. The data obtained by the FMS method were used as a standard to validate a less work-intensive approach, the EVA method. The experts compared reasonably well among themselves, with a CV of 0.19 (which was expected for a visual assessment), and with the FMS method (Fig. 1C). Given the less stringent requirement for purity assessment (i.e., the use of purity categories rather than percentages), the EVA method with a CV < 0.20 was considered acceptable for creating the reference data set for NPA validation. The NPA compared well with this reference data set (Fig. 3E). However, the spread of the observed values was expectedly wider compared to the TIA. The performance of the NPA (one image per minute) is comparable to that observed for the EVA method and can be considered for clinical practice.
In future work, it would be interesting to compare our TIA and NPA tools to already established computer-assisted methods (8,10,17). Currently, it is not possible for us to undertake such a comparison because those methods are not readily available to us.
We conclude that it is feasible to combine a trainable algorithm for the high-precision determination of islet parameters with an unsupervised algorithm for the assessment of graft purity, for a fully automated assessment of clinical-grade images of isolated pancreatic islets. Our tools provide an objective and rapid way of analyzing multiple islet microscopy images before transplantation. Currently, we are actively looking for collaborating institutions to assist in improving these tools further by assembling a larger dataset of qualitatively diverse images from different laboratories.
Footnotes
Acknowledgments
This study is dedicated to the memory of Jan Habart. David Habart, Jan Švihlík, Jan Schier, and Jan Kybic were supported by the Czech Science Foundation within project 14-10440S. David Habart, Klára Zacharovová, Zuzana Berková, and František Saudek were supported by the Internal Grant Agency of the Czech Ministry of Health within project NT13099. This work was performed in accordance with the Approval 712a/13 (G 13-04-10) issued by the ethics committee of the Institute for Clinical and Experimental Medicine and Thomayerova Hospital, Prague 4, Czech Republic. The authors declare no conflicts of interest.