
Abstract
Transplantation of mesenchymal stem cells (MSCs) expanded with fetal bovine serum (FBS) has some limitations, including the requirement of a long culture period to obtain a sufficient amount of stem cells. Priming of MSCs with serum from patients with ischemic stroke (stroke serum) increased the proliferation rate and the neurorestorative capacity of MSCs. We hypothesized that this novel priming method increases the proliferation rate of MSCs via the regulation of microRNAs (miRs). Thus, we investigated miR profiling in stroke serum-primed MSCs and tested whether the regulation of certain miRs may affect the proliferation rate of rat MSCs. The proliferation rate of MSCs cultured with stroke serum was higher than that of MSCs cultured with normal serum or FBS. Using miR microarray analysis, we compared the miR expression profiles between MSCs cultured in FBS and in stroke serum. Among miRs associated with cell proliferation, miR-20a was most significantly increased. Similarly, miR-20a was increased in MSCs obtained from the bone marrow of stroke rats compared with MSCs from normal rats. Furthermore, the deregulation of miR-20a by the transfection of MSCs with pre-miR-20a or anti-miR-20a was significantly correlated with the increased proliferation rate of MSCs. The overexpression of miR-20a in MSCs cultured in FBS improved the proliferation rate, while the knockdown of endogenous miR-20a decreased the proliferation rate. In addition, miR-20a promoted proliferation by suppressing the expression of p21 cyclin-dependent kinase inhibitor 1 (CDKN1A). A dual-luciferase reporter assay showed that CDKN1A is a target of miR-20a. Our findings indicate that stroke serum priming upregulated the expression of miR-20a, which promoted MSC proliferation by regulating the cell cycle inhibitor p21 CDKN1A, and suggest the possible roles of priming methods in modulating the characteristics of MSCs by controlling the expression of miR in MSCs.
Keywords
Introduction
Bone marrow-derived mesenchymal stem cells (BM-MSCs) have been considered a promising candidate for the treatment of diseases because they are multipotent stem-like cells that have the ability to self-renew and the potential to differentiate. Preclinical studies have shown that transplanted MSCs migrate into the injured brain and secrete bioactive substances that are associated with enhanced neurogenesis, angiogenesis, and synaptogenesis1–4.
Clinical trials of BM-MSCs, expanded with fetal bovine serum (FBS), showed that MSC transplantation is safe, but also has limitations, including a long culture period required to obtain a sufficient amount of stem cells5,6. The preconditioning of MSCs with serum from patients with ischemic stroke (stroke serum) increased the proliferation rate of MSCs by cell cycle modification and neurorestorative capacity (i.e., neurogenesis, angiogenesis, and cell homing) of MSCs 7 . However, the underlying mechanisms of stroke serum-primed MSCs remain unclear.
MicroRNAs (miRs), which are small noncoding RNAs (~23 nucleopeptides), negatively regulate the expression of many proteins by altering gene expression through posttranscriptional repression or mRNA degradation 8 . We hypothesized that our novel priming method increases the proliferation rate of MSCs by regulating miRs. Thus, we investigated miR profiling in stroke serum-primed MSCs and tested whether the regulation of a certain miR and target gene may influence the proliferation rate of rat MSCs.
Materials and Methods
Preparation of Stroke Serum and Mesenchymal Stem Cells
In this study, all rats were subjected to surgery and cared for according to the guidelines of the Laboratory Animal Research Center (LARC; AAALAC International-approved facility) in the Samsung Medical Center. Using a face mask, anesthesia was induced in male Sprague–Dawley (SD) rats (7–8 weeks old, 250–300 g) with 4% isoflurane (Hana Pharm, Kyonggi-Do, Korea) and maintained with 1.5% isoflurane in 70% N2O and 30% O2. The body temperature was maintained at 37.0°–37.5°C (measured rectally) with heating pads. We induced transient middle cerebral artery occlusion (tMCAo) using a previously described intraluminal vascular occlusion method modified in our laboratory 2 . Serum was prepared 1 day after tMCAo was induced in animals [stroke serum (SS)]. Blood was collected by cardiac puncture from a still-beating heart with a 5-ml syringe. Aliquots of the serum were stored at −70°C until ready for use. Rat MSCs were obtained from the femurs and tibias of normal rats (male SD, 7 weeks old, 220–240 g) or stroke rats 24 h after tMCAo, as previously described 2 . Femurs and tibias were removed, and the muscles on bones were then removed as cleanly as possible. The ends of each femur and tibia were clipped to expose the marrow. Medullary cavities were washed with Dulbecco's modified Eagle medium (DMEM; Gibco, Grand Island, NY, USA) using a 21-gauge syringe and filtered with a 70-μm nylon mesh filter. Cells in DMEM were centrifuged at 1,300 × g for 5 min and suspended in growth media containing 10% FBS (Gibco) and 1% penicillin–streptomycin (Sigma-Aldrich, St. Louis, MO, USA). After incubation for 3 days, the adherent layer was washed once with fresh medium. After culture, the cells were stored in liquid nitrogen until use. MSCs at passage 4 were used in all experiments.
RNA Extraction and RT-qPCR
Total RNA from the rat MSCs was extracted using TRIzol reagent (Invitrogen, Carlsbad, CA, USA), as recommended by the manufacturer. Expression levels of the mRNA of p21 were measured by RT-qPCR using the SYBR Green-based detection method. The level of glyceraldehyde 3-phosphate dehydrogenase (GAPDH) mRNA was used for normalization. The results of the miR microarray were validated by stem-loop RT primer and TaqMan PCR Master Mix (Applied Biosystems, Carlsbad, CA, USA) and were normalized against the level of RNU43. The following primers were used for RT-qPCR: CDKN1A (Bioneer, Daejeon, Korea Cat. No. P139356); GAPDH, forward (5′-TGCACCACCAACTGCTTAGC-3′) and reverse (5′-GGCATGGACTGTGGTCATGAG-3′). Additional primers for miR were included in TaqMan® MicroRNA Assays (Applied Biosystems): miR-18a-5p (Cat. No. 4427975-002422); miR-20a-5p (Cat. No. 4427975-000580); miR-20b-5p (Cat. No. 4427975-001014); miR-21-3p (Cat. No. 4427975-002493); miR-23-5p (Cat. No. 4427975-002439); miR-27-5p (Cat. No. 4427975-002445); miR-339-5p (Cat. No. 4427975-002257); RNU43 (Cat. No. 4427975-001095). Relative expression was calculated using the comparative CT method (2 –ΔΔCT).
Western Blot Analysis
Whole-cell lysates for Western blotting were extracted with RIPA buffer containing protease inhibitors and phosphatase inhibitors (Roche, South San Francisco, CA, USA). Protein concentrations were determined by the Bradford assay. Lysates (20 μg) of MSCs were electrophoresed on SDS-polyacrylamide gels (Invitrogen) and transferred to PVDF membranes (Millipore, Kankakee, IL, USA). After blocking, the membranes were incubated overnight at 4°C with primary antibodies: mouse anti-p21 (diluted 1:500; BD Pharmingen, San Jose, CA, USA) and mouse anti-GAPDH (diluted 1:1,000; Santa Cruz Biotechnology, Santa Cruz, CA, USA). The membranes were then incubated with secondary antibodies (diluted 1:5,000, Cell Signaling Technology, Beverly, MA, USA). Bands were visualized with enhanced chemiluminescence (Millipore). GAPDH was used as a control.
Microarray Analysis and Target Prediction
We performed miR expression analysis using Affymetrix GeneChip® miRNA Arrays (Affymetrix, Santa Clara, CA, USA). RNA quality was assessed using the Agilent 2100 Bioanalyzer with the RNA 6000 Nano Chip (Agilent Technologies, Amstelveen, The Netherlands), and quantity was determined using an ND-1000 Spectrophotometer (NanoDrop Technologies, Inc., Wilmington, DE, USA).
One microgram of each RNA sample was used as recommended by the protocol (Affymetrix® FlashTag™ Biotin HSR RNA Labeling Kits for Affymetrix® GeneChip® miRNA 3.0 Arrays). One microgram of total RNA was used for the labeling reaction, and labeled miR was hybridized in the array for 16 h at 48°C and 60 rpm as described in the protocol. After hybridization, the chips were stained and washed in a Genechip Fluidics Station 450 (Affymetrix) and scanned using a Genechip Array scanner 3000 7G (Affymetrix).
After confirming whether the data were properly normalized, differentially expressed genes (DEGs) that showed a difference of over 1.5-fold between the average signal values of the cultured MSCs in FBS, media containing normal serum (NS group), and media containing stroke serum (SS group) were selected manually. In order to classify the coexpression of miR groups, which have similar expression patterns, hierarchical clustering analysis was performed with the MEV (Multi Experiment Viewer) software version 4.4 (http://www.tm4.org) 9 .
Potential target for miRNAs were predicted based on the TargetScan 6.2 database (http://www.targetscan.org). Finally, using the web-based tool DAVID (the Database for Annotation, Visualization, and Integrated Discovery), the target genes were functionally annotated and classified based on the information of gene function such as Gene Ontology (GO) to reveal regulatory networks that they are involved in (http://david.abcc.ncifcrf.gov) 10 . Computational miR target prediction analysis was performed with TargetScan and miRDB to predict potential binding between CDKN1A 3′-untranslated region (UTR) and miR-20a.
Transient Transfection
MSCs were seeded into 60-mm dishes and incubated overnight. They were then transfected using Lipofectamine 2000 (Invitrogen) following the manufacturer's protocol. After 72 h, MSCs were harvested. To overexpress miRs, precursor miRs were obtained from Ambion (Austin, TX, USA). An inhibitor of miR-20a was ordered from Qiagen (Valencia, CA, USA). To knock down the expression of CDKN1A, small interfering RNAs (siRNAs) were purchased from Bioneer.
Calculation of Population Doubling
The population doubling level (PDL) in continual subculture and growth from a known number of cells was calculated to determine the proliferative potential of MSCs. The PDL was calculated at each subcultivation from the cell count using the following formula: ln(Nf/Ni)/ln2, where Ni and Nf are initial and final cell numbers, respectively 11 .
Cell Proliferation Analysis
The MTT assay was used to test the effect of stroke serum on cell proliferation. Briefly, cells were seeded in 96-well plates at a density of 8 × 10³ cells/well and cultured in DMEM supplemented with FBS or stroke serum. After being cultured for 4 days, MTT solution (Sigma-Aldrich) (5 mg/ml) was added into each well and incubated with the cells at 37°C for 4 h. Subsequently, the solution was replaced with 100 μl of dimethyl sulfoxide (DMSO) and vibrated for 10 min to dissolve the MTT formazan crystals. The optical density was measured at 570 nm by a microplate reader (Molecular Devices, Sunnyvale, CA, USA), and all experiments were performed in triplicate.
Immunocytochemical Analysis
Samples were fixed with 4% paraformaldehyde (Sigma-Aldrich) for 1 h and washed with phosphate-buffered saline (PBS; Hyclone, Logan, UT, USA)/Tween 20 (Sigma-Aldrich) (PBST). Samples were incubated in PBS with 0.2% Triton X-100 (Sigma-Aldrich) and 0.5% bovine serum albumin (BSA; Millipore) for 15 min. Samples were then incubated overnight at 4°C with the primary antibody rabbit anti-Ki-67 (diluted 1:100; Abcam, Cambridge, MA, USA). Samples were then thoroughly washed with PBST, incubated with anti-rabbit IgG (diluted 1:200; Abcam) for 1 h at room temperature and detected with 3,3′-diaminobenzidine tetrahydrochloride (Sigma-Aldrich). Samples were mounted with Vectashield mounting medium (Vector Laboratories, Burlingame, CA, USA) and viewed using a microscope (EVOS, Electron Microscopy Sciences, Hatfield, PA, USA).
Dual-Luciferase Reporter Assay
For the CDKN1A 3′-UTR luciferase assay, we constructed dual-luciferase vectors (pmirGLO) containing the wild-type (WT) or mutated (MT) miR-20a binding site in the CDKN1A 3′-UTR. Mutation of binding sites was accomplished by substitution of four nucleotides. HeLa cells were transfected with control (con-miR) or pre-miR-20a for 24 h, resuspended in six-well plates, and transfected with luciferase vectors (MT and WT) for 24 h. Luciferase activity was determined using a Dual-Glo™ Luciferase Assay System (Promega, Madison, WI, USA). The Firefly luciferase activity was normalized to that of Renilla luciferase 12 .
Statistical Analysis
In this study, the FBS group was used as a control group because FBS is widely used for culture of MSCs. The proliferation rate and miRNA profiling of the SS group were compared to those of the FBS and NS groups. Data analysis was performed using the Student's t-test and two-tailed t-test. All statistical analyses were carried out using GraphPad Prism 5.0 (GraphPad Software, La Jolla, CA, USA). Results were expressed as the mean ± standard error of the mean (SEM). Values of p < 0.05 were considered statistically significant.
Results
Proliferation of MSCs Cultured with FBS and Stroke Serum-Conditioned Media
To investigate whether the proliferation of MSCs primed by growth in SS derived from a stroke model is increased compared with that of MSCs cultured in FBS, proliferative activity was detected using an MTT assay and Ki-67 immunocytochemistry. The morphology of MSCs cultured with SS was indistinguishable from that of cells cultured with FBS (Fig. 1A). However, the proliferation rate of MSCs cultured with SS was significantly higher than that of MSCs cultured with FBS (Fig. 1A). The immunocytochemical result showed that the number of Ki-67-positive cells increased in MSCs cultured with SS, compared to MSCs cultured with FBS (Fig. 1B).

Cell proliferation of MSCs. (A) Representative phase-contrast images of MSCs cultured in FBS and in stroke serum (SS). The proliferative activity was detected using MTT assay. (B) Representative images of Ki-67 immunostaining and the number of Ki-67-positive MSCs cultured in FBS and in SS. All values were expressed as mean ± SEM (n = 8). **p < 0.01 compared with the FBS group.
Differential miR Expression Profile in MSCs
To study the potential mechanism of MSCs cultured with SS, we profiled their miR expression pattern by miR microarray analysis. Overall, 137 miRs were differentially expressed in MSCs cultured with SS compared with MSCs cultured with FBS (fold change >1.5, p < 0.05) (Fig. 2A). Gene ontology (GO) analysis revealed that many differentially expressed genes were involved in biological processes relevant to the regulation of metabolic process, cell proliferation, signaling, gene expression, transport, differentiation, etc. (Fig. 2B).

Differential miRNA expression profile in MSCs. (A) Hierarchical clustering of differentially expressed miRNAs in MSCs with FBS, NS, and SS. (B) Differentially expressed mRNAs regulated by altered miRNAs involving 17 GOs in the biological process using the DAVID program. GO, gene ontology; FBS, fetal bovine serum; NS, normal serum; SS, stroke serum.
The Expression of Cell Proliferation-Related miRs
Based on the results of bioinformatics analysis, we paid special attention to the upregulated miRs that are associated with potential cell proliferation. To validate the microarray data, the levels of cell proliferation-related miRs (miR-18a-5p, miR-20a-5p, miR-20b-5p, miR-21-3p, miR-23a-5p, miR-27a-5p, and miR-339-5p) were analyzed by real-time stem-loop PCR. miR-20a were significantly upregulated in MSCs cultured with SS, compared to MSCs cultured with FBS (p < 0.01) or NS (p < 0.05) (Fig. 3A). Furthermore, miR-20a was markedly correlated with the number of MSCs cultured in rat serum (NS or SS) (Spearman's r = 0.65, p < 0.05) (Fig. 3B).
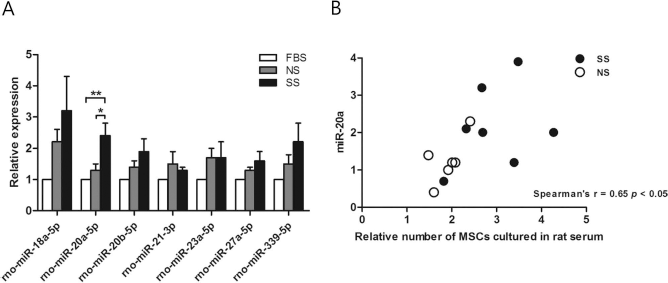
The expression of cell proliferation-related miRNAs. (A) Alterations in expression of cell proliferation-related miRNAs were validated by qPCR (normalized to control RNU43, *p < 0.05, **p < 0.01, n = 7). (B) Correlation between expression of miR-20a and MSC number cultured in rat serum-conditioned media (r = 0.65, p < 0.05, n = 7). All values were expressed as mean ± SEM. NS, normal serum; SS, stroke serum.
Growth Properties and Expression of miR-20a in BM-MSCs From Normal or Stroke Rats
To confirm whether upregulated miR-20a was also observed in BM-MSCs from stroke rats, we compared the proliferation rates (as determined by PDL) and miR-20a expression levels (as determined by RT-qPCR) between BM- MSCs from stroke rats and normal rats.
MSCs were isolated from the bone marrow of normal or post-MCAo (1 day after tMCAo) rats. The morphology of normal MSCs and ischemic MSCs similarly appeared as round-shaped colonies of fibroblast-like cells (Fig. 4A). The proliferation rate of ischemic MSCs was significantly higher than that of normal MSCs until passage 2 (P2), but such differences were no longer observed with subsequent culture expansions (Fig. 4B). Similarly, the miR-20a level of MSCs during the passages showed a pattern that was consistent with the results of the PDL (Fig. 4C).

Growth properties and expression of miR-20a of BM-MSCs cultured from normal or ischemic rats. (A) Representative phase-contrast images of bone marrow MSCs cultured from normal or ischemic rats. (B) Population doubling level (PDL) values show the growth rate during the passages. (C) Expression of miR-20a during the passages was confirmed using real-time PCR. All values were expressed as mean ± SEM (*p < 0.05).
miR-20a Boosts Cell Proliferation in MSCs
To determine the significance of miR-20a in MSC proliferation, MSCs were transfected with either miR-20a mimic (pre-miR-20a) to overexpress miR-20a or miR-20a inhibitor (anti-miR-20a) to knock down miR-20a. MSCs transfected with control (con-miR) in FBS media were used as negative controls, and MSCs transfected with control (con-miR) in SS-conditioned media were used as positive controls. The effect of proliferation was assessed by staining for Ki-67, a proliferation marker (Fig. 5A and B), and validated using MTT assays (Fig. 5C). Both the number of Ki-67-positive cells (Fig. 5B) and the results of MTT assay (Fig. 5C) showed that the elevation of miR-20a in MSCs, either through priming with SS or through transfection of miR-20a in MSCs cultured with FBS, enhanced the proliferation rate. On the contrary, the suppression of miR-20a in MSCs reduced the proliferation rate.
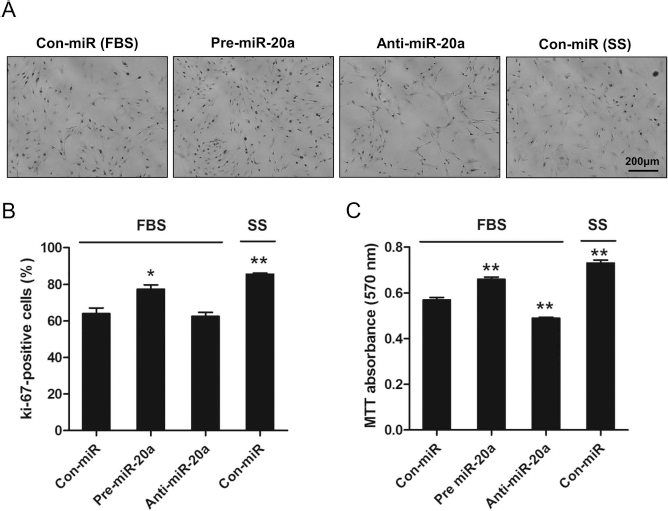
miR-20a boosts cell proliferation in MSCs. (A) Representative images of Ki-67 immunostaining. Overexpression and inhibition of miR-20a was achieved by transfecting MSCs with control (con-miR), pre-miR-20a, or anti-miR-20a. (B) The number of Ki-67-positive MSCs transfected with con-miR, pre-miR-20a, or anti-miR-20a (*p < 0.05, **p < 0.01 compared with the con-miR in FBS, n = 3). (C) The proliferative activity of MSCs transfected with con-miR, pre-miR-20a, or anti-miR-20a was detected using MTT assay (**p < 0.01 compared with the con-miR in FBS, n = 3). All values were expressed as mean ± SEM.
miR-20a Acts Directly by Binding to 3′-UTR of p21 mRNA
To select target genes of miR-20a, we performed computational miR target prediction analysis (TargetScan) and found the seed sequence of CDKN1A (known as p21) 3′-UTR interacting with rno-miR-20a. To confirm p21 regulation by miR-20a, MSCs were transfected with con-miR, pre-miR-20a, or p21 siRNA. p21 mRNA levels were effectively reduced in MSCs transfected with pre-miR-20a (p < 0.05) and p21 siRNA (si-p21) (p < 0.01) (Fig. 6A). Western blotting showed that the overexpression of miR-20a in MSCs decreased the p21 protein to a level that was similar to that obtained by silencing p21 (p < 0.01) (Fig. 6B). In addition, the overexpression of miR-20a in MSCs increased the cell proliferation rates to levels similar to those obtained by silencing p21 in MSCs (Fig. 6C).

The expression of miR-20a is increased through direct binding to 3′-UTR of p21 mRNA. (A, B) The expression of p21 was determined by Western blotting and RT-qPCR in MSCs transfected with con-miR, pre-miR-20a, or p21 siRNA (si-p21). (C) The proliferative activity of MSCs transfected with con-miR, pre-miR-20a, or si-p21 was detected using MTT assays. (D) Upper panel: CDKN1A 3′-UTR of Firefly/Renilla luciferase used for miRNA reporter assay. Lower panel: Quantitative data for dual-luciferase reporter assay results. All values were expressed as mean ± SEM (**p < 0.01, *p < 0.05, n = 3).
Last, we investigated whether miR-20a directly recognized the 3′-UTR of CDKN1A. HeLa cells were transfected with the dual-luciferase vector (pmirGLO) containing the 3′-UTR of CDKN1A (WT) or mutated 3′-UTR of CDKN1A (MT) miR-20a binding sequence following the transfection of miR-20a mimic or con-miR (Fig. 6D). Luciferase activity was significantly repressed (p < 0.01) when miR-20a was coexpressed with the 3′-UTR of CDKN1A (WT), whereas luciferase activity in mutated 3′-UTR of CDKN1A (MT) did not change (Fig. 6D), indicating that miR-20a suppressed the expression of p21 by directly binding to 3′-UTR of p21 mRNA.
Discussion
Major Findings of This Study
The main finding of this study is that stroke serum priming upregulated miR-20a, which promoted MSC proliferation by downregulating the cell cycle inhibitor CDKN1A (known as p21). Our results also showed that in terms of miR expression, MSCs primed by growth with stroke serum from a stroke model could simulate MSCs obtained at the time of stroke onset, which may be optimal candidates for use in cell therapy. Differences in the properties of BM-MSCs cultured from normal and ischemic rats have been reported13,14. In particular, MSCs from stroke rats could be expanded faster to reach a certain cell number compared with MSCs from normal rats 14 . We believe that culture expansion of MSCs with serum obtained at the hyperacute stage may be a way to maintain cellular characteristics that are optimal for the neurorestorative treatment of stroke.
The Functions of miRs
It has been suggested that miRs play an essential role in the regulation of proliferation, differentiation, survival, and aging of various tissues or cells including stem cells15–18. There is increasing evidence that miRs that are altered after focal ischemia have functional significance in stem cell biology and function as well as ischemic pathophysiology. First, preclinical studies of ischemic stroke showed that miRs reportedly protect against focal ischemia and reperfusion injury by inhibiting oxidative stress 19 and are involved in inflammation, neurogenesis, and angiogenesis, etc.20–22. One study showed that ischemic preconditioning with tMCAo in mice upregulated the miR-200 and miR-182 families, and the transfection of the miR-200 family played a neuroprotective role by downregulating prolyl hydroxylase 2 levels 23 . Second, miRs were recently shown to exhibit critical functions in MSCs such as regulating differentiation, paracrine activity, and other cellular properties such as proliferation, survival, and migration24,25. One study showed that miR-335 inhibited the proliferation and migration of MSCs 26 . Moreover, miRs and pre-miRs have been detected in MSC-derived extracellular vesicles. miRs may either modulate the expression of proteins secreted by MSCs or be contained in microvesicles and exosomes to exert their regulatory function in target cells24,27. Exosomes from MSCs promote neuronal plasticity via the transfer of miR-133b to astrocytes and neurons 28 .
Role of miR-20a
miR-20a is reportedly involved in the proliferation and differentiation of various types of stem cells, including MSCs, embryonic stem cells (ESCs), and cancer stem cells (CSCs) 29 . miR-20a modulated the translation of the E2F family of transcription factors that is essential in the regulation of the cell cycle and apoptosis 30 . In addition, miR-20a plays important roles in hypoxia adaptation via the direct or indirect regulation of hypoxia-inducible factor-1α (HIF-1α) expression, 31 and it is also reportedly involved in vascular endothelial growth factor (VEGF)-induced angiogenesis 20 . miR-20a was reported to enhance the proliferation of gastric cancer cells by targeting early growth response 2 (EGR2) and autophage-related 7 (ATG7), respectively32,33. It was also independently reported that miR-20a suppresses the expression of p21 protein and mRNA. Since the downregulation of p21 increases MSC proliferation, the reports suggest that miR-20a is capable of potentiating the proliferative activity of MSCs by targeting p21 34 .
Preconditioning of MSCs and miRs
Preconditioning represents a stressful but nondamaging stimulus to cells, tissues, or organisms to promote a transient adaptive response, so that injury resulting from subsequent exposure to a harmful stimuli is reduced 35 . Preconditioning triggers adaptive responses, including innate survival mechanisms and enhancement of endogenous repair processes (i.e., neurogenesis and angiogenesis) that lessen the extent of injury and facilitate recovery after stroke 35 . Several methods of preconditioning including the administration of hypoxia (e.g., 0.5% oxygen for 24 h)36–38 and stromal cell-derived factor-1 (SDF-1) 39 have been reported to enhance stem cell migration, survival, and neovascularization in infarcted myocardium. Preconditioning of MSCs with stroke serum increased the proliferation rate and neurorestorative capacity of MSCs 7 . With these preclinical results, we have recently initiated the STem cell Application Researches and Trials In NeuroloGy (STARTING)-2 study, which aims to evaluate the efficacy of applying MSCs to patients with ischemic stroke (clinical trial identifier NCT01716481) 40 . This clinical trial will determine the effectiveness and safety of autologous MSCs culture expanded in autologous stroke serum obtained as early as possible after the onset of stroke.
However, whether miRs regulate these preconditioning-induced changes remains largely unknown. Our previous results have indicated that preconditioning by ischemic brain extracts activates the homing characteristic of MSCs via the CXCR2/miR-223/miR-27b axis 41 . Our present study demonstrates for the first time the effect of preconditioning using stroke serum on the miR levels of MSCs.
Limitations
This study has several limitations. First, only the p21 CDKN1A gene was evaluated in the present study. Further studies on other genetic targets of miR-20a are needed because one miR has multiple gene targets. Second, although the preconditioning of MSCs (ischemic or anoxic) enhanced angiogenesis, neurogenesis, and cell homing after ischemic stroke7,42,43 and miR-20a may play a role in these effects, only the proliferation rate of MSCs was evaluated. Further studies are needed to evaluate the function of miR-20a on MSCs more comprehensively. Third, it has been reported that circulating miRs were increased in patients with ischemic stroke or heart disease44–47. The levels of miRs in stroke and normal serum were not evaluated in the present study.
Conclusions
Our results indicate that the effect of stroke serum priming on the increased proliferation rate of MSCs is related to the upregulation of miR-20a, which regulates the cell cycle inhibitor p21 CDKN1A. miR-based therapies, including miR amplifiers and inhibitors and artificial miRs, are currently being developed 48 . Our results suggest the possible roles of priming methods in modulating the characteristics of MSCs by controlling the expression of miR in MSCs.
Footnotes
Acknowledgments
This study was supported by a grant from the Korea Health Technology R&D Project, the Ministry of Health & Welfare (HI14C16240000) and Basic Science Research Program through the National Research Foundation of Korea (NRF) funded by the Ministry of Education (2013R1A1A2063882). The authors declare no conflicts of interest.