
Abstract
Magnetic targeting has the potential to enhance the therapeutic effects of stem cells through increasing retention of transplanted cells. To investigate the effects of magnetic targeting intensities on cell transplantation, we performed different magnetic intensities for mesenchymal stem cell (MSC)-targeting therapy in a rat model of ischemia/reperfusion. Rat MSCs labeled with superparamagnetic oxide nanoparticles (SPIOs) were injected into the left ventricular (LV) cavity of rats during a brief aorta and pulmonary artery occlusion. The 0.15 Tesla (T), 0.3 T, and 0.6 T magnets were placed 0~1 mm above the injured myocardium during and after the injection of 1 × 10⁶ MSCs. Fluorescence imaging and quantitative PCR revealed that magnetic targeting enhanced cell retention in the heart at 24 h in a magnetic field strength-dependent manner. Compared with the 0 T group, three magnetic targeting groups enhanced varying cell engraftment at 3 weeks, at which time LV remodeling was maximally attenuated, and the therapeutic benefit (LV ejection fraction) was also highest in the 0.3 T groups. Interestingly, due to the low MSC engraftment resulting from microvascular embolisms, the 0.6 T group failed to translate into additional therapeutic outcomes, though it had the highest cell retention. Magnetic targeting enhances cell retention in a magnetic field strength-dependent manner. However, too high of a magnetic intensity may result in microembolization and consequently undermine the functional benefits of cell transplantation.
Keywords
Introduction
Cellular therapies are an attractive option as adjunct therapies for acute or chronic ischemic heart diseases (26). Intracoronary cell injection is the more clinically relevant and less invasive setting of an intravascular approach than intramyocardial injection. However, the therapeutic effect of intracoronary cell transplantation is extremely restricted by low cell retention and engraftment in injured myocardium (10,24).
Magnetic targeting is an emerging approach to augment cellular therapies by guiding cells to sites of injury using externally generated magnetic fields and field gradients (3). Using different magnetic forces, two animal studies recently tested the magnetically enhanced intracoronary delivery of cardiosphere-derived cells (CDCs) (6) or endothelial progenitor cells (EPCs) (4) in a rat model of acute ischemia/reperfusion (I/R). In Cheng et al.'s study (6), the actual working intensity was theoretically estimated to be less than 0.3 Tesla (T) for a 1.3 T magnet that was placed ~1 cm above the heart, and the magnet group exhibited greater than a fourfold greater cell retention. In Chaudeurge et al.'s study (4), a 0.1 T magnet was implanted into the subcutaneous layer, leading to an actual working intensity that was far less than 0.1 T, and magnetic targeting failed to increase cell retention using RT-PCR quantification. Our previous in vitro study demonstrated that cell capture efficiency was positively related to the magnetic flux density between 10 and Online prepub date: November 5, 2014. 640 mT, and it reached 89.3% with a magnetic flux density of 640 mT, a magnetic intensity gradient of 38.4 T/m, and a flow velocity of 0.8 mm/s (14).
Based on the above data, it seems that cell retention and engraftment can continuously increase with the enhancement of magnetic force, subsequently translating into additional cardiac functional and structural benefits. This notion also seems to be evidenced by some early studies without magnetic targeting, in which the relationship between injected cell number and functional effect was a positive linear correlation regardless of intramyocardial injection or intracoronary delivery (17,22,23,27). However, intracoronary delivery of mesenchymal stem cells (MSCs) can induce microvascular obstruction as has been reported previously (11,29,30), and little is known about whether microembolisms would be aggravated with the escalating magnetic intensity and thereby have an influence on therapeutic outcome of transplanted cells. Here, we investigated the effects of magnetic targeting intensities on intraventricular MSC delivery in a rat I/R model.
Materials and Methods
Magnet Cylinder
Three cylindrical NdFeB magnets (Shanghai Yahao Instrument Equipment Co., Shanghai, China) with 0.15 T, 0.3 T, and 0.6 T (diameter 8 mm) were used in this study. The magnetic flux density (B) of the magnet surface is measured using a model 51,662 Leybold Tesla meter (Beijing Zhuo Sheng Jia Magnetic Technology Co. Ltd., Beijing, China). The distribution of the magnetic flux density was calculated by a finite element analysis.
Rat MSCs, SPIOs, and DiR Labeling
Animal experiments were approved by the Animal Care and Use Committee of Fudan University and were in compliance with the Guide for the Care and Use of Laboratory Animals published by the National Academy Press (1). Femurs of 4-week-old male Sprague–Dawley (SD) rats, obtained from Shanghai animal administration center, were excised under sterile conditions. MSCs were cultured from bone marrow plugs explanted from 4-week-old male SD rats, as previously described (34). All used cells were harvested by 0.25% trypsin (Gibco, Grand Island, NY, USA) and 0.038% EDTA (Gibco) when they reached 80–90% confluence at passage 4. MSCs were labeled with superparamagnetic oxide nanoparticles (SPIOs; 100 mg/ ml; Schering, Berlin, Germany), as previously described (14). For cell tracking in vivo, cells were labeled with 1,1-dioctadecyl-3,3,3,3-tetramethyl indotricarbocyanine iodide (DiR; AAT Bioquest, Inc., Sunnyvale, CA, USA) according to the manufacturer's protocol. Labeled cells are hereafter called SPIOs-DiR-MSCs or DiR-MSCs for brevity. To evaluate the labeling efficacy, Prussian blue staining (potassium ferrocyanide and HCl solution from Jueshen Bio-Technology Co. Ltd., Shanghai, China) and electron microscopy (Phillips CM120, Philips FEI, Eindhoven, Netherlands) were undertaken to indicate the presence and localization of intracellular iron particles, and DiR staining was observed by fluorescence microscopy using the XF112-Omega optical filter after cell nuclei were counterstained with 4′,6-diamidino-2-phenylindole (DAPI; Sigma-Aldrich, St. Louis, MO, USA) (16).
Effects of SPIO Labeling on MSC Differentiation Capacity
Our previous study demonstrated that SPIO labeling had no significant effect on the proliferation and viability of MSCs (16). Here we further determined the differentiation capacity of SPIOs-MSCs. The MSCs and SPIOs-MSCs were, respectively, cultured in adipogenic (SR811D250, Amsbio, Abingdon, UK) or osteogenic (SR417D250, Amsbio) media for 21 days with media replenishment every 3 days. To demonstrate adipogenic differentiation, the cells were stained with 0.3% Oil red O (O0625; Sigma-Aldrich) in isopropanol for 30 min and rinsed with PBS. For osteogenic differentiation, the cells were stained with 1% Alizarin red (500-4; RiccaChem, Arlington, TX, USA) for 15 min (2).
To determine the myocardium-like cell differentiation, the MSCs and SPIOs-MSCs were cultured in culture medium-added 5-aza-2′-deoxycytidine (5-azaC; Sigma-Aldrich) for 24 h. Incubation then continued in complete medium lacking 5-azaC, with medium changes every 3 days. Undifferentiated cells and normal mature rat cardiomyocytes were, respectively, used as negative and positive controls. Total RNA was extracted from cultured cells using TRIzol reagent (Invitrogen, Carlsbad, CA, USA) according to the manufacturer's protocol. RT-PCR primers (synthesized by Sangon, Shanghai, China) were as follows: GATA-4, 5′-CTG TCA TCT CAC TAT GGG CA-3′ and 5′-CCA AGT CCG AGC AGG AAT T T-3′; α-actin, (F) 5′-TCC TTT ATC GGT ATG GAG TCT G-3′ and (R) 5′-TGA TCT TGA TCT TCA TGG TGC T-3′; cTnT, 5′-AGA GGA CTC CAA ACC CAA GC-3′ and 5′-ATT GCG AAT ACG CTG CTG TT-3′; Cx43, 5′-TCC TTG GTG TCT CTC GCT TT-3′ and 5′-GAG CAG CCA TTG AAG TAG G C-3′; GAPDH, 5′-GAC ATG CCG CCT GGA GAA AC-3′ and 5′-AGC CCA GGA TGC CCT TTA GT-3′. Transcriptional expressions of GATA-4, cTnT, α-actin, and Cx43 genes from the MSCs and SPIOs-MSCs were determined by real-time PCR according to the manufacturer's instructions. Transcript levels were standardized to the corresponding rat GAPDH level.
In Vitro Magnetic Capture of Flowing SPIOs-MSCs
To test the magnetic responsiveness of MSCs labeled with SPIOs (SPIOs-MSCs), the accumulation of SPIOs-MSCs was observed, while cells flowed through a tube served as a model of blood vessels in a magnetic field. A total of 20 ml SPIOs-MSCs suspension, at a concentration of 5 × 10⁴ cells/ml, was placed in a 50-ml syringe (Shanghai Boguang Biotechnology Co. Ltd., Shanghai, China) and flowed through a quartz tube (ID 2.3 mm, OD 4.3 mm, length 20 cm) (Shanghai Puya Quartz Glass Factory, Shanghai, China). Cell suspension circulated at flows of 5 mm/s to mimic circulatory conditions in animals and human beings. The aforementioned 0.15-T magnet cylinder was placed tightly at the midsegment of the tube. The cell suspension flowed through the magnet field was collected in a centrifuge tube (Shanghai Boguang Biotechnology Co. Ltd.) 1#. The remaining cells within the quartz tube were washed using PBS and collected in centrifuge tube 2#. The numbers of SPIOs-MSCs in centrifuge tube 1# and 2# were counted using a counting plate and referred to quantity of captured cells (Q1) and quantity of uncaptured cells (Q2). The capture efficiency (CE) was calculated by
Animal Model and Magnetic Targeting
To make our experiment more relevant to reperfused acute myocardial infarction (AMI), a rat I/R model was developed in female SD rats (150-200 g). Rats were anesthetized with ketamine (100 mg/kg, IP) (Beijing Zizhu Pharmaceutical Co. Ltd., Beijing, China) and xylazine (10 mg/kg, IP) (Shanghai Ruicong Laboratory Equipment Co. Ltd., Shanghai, China) and were ventilated with a rodent ventilator using room air at 80 breaths per minute. Female SD rats (n = 236 total), obtained from Shanghai animal administration center, underwent a left thoracotomy in the fourth intercostal space under general anesthesia. The heart was exposed, and myocardial infarction was produced by a 90-min ligation of the left anterior descending coronary artery (LAD) using a 7-0 silk suture (Unik Surgical Sutures Mfg. Co. Ltd., Suzhou, China). The suture was then released to allow coronary reperfusion. Twenty minutes later, cells were injected into the left ventricle cavity during a 5-s temporary aorta and main pulmonary artery occlusion, as previously described (18,19). Cell delivery was confirmed by the temporary observation of bradycardia and epicardial blanching.
For magnetic targeting, three cylindrical NdFeB magnets with 0.15 T, 0.3 T, and 0.6 T were separately placed above the injured myocardium during and after cell injection for 10 min, which was determined to be the optimal time (5,6). The 217 survivors were randomized into six groups according to the strength of the magnetic field (n = 37 for 0.3 T group, n = 36 for other groups): 0 T group, 0.15 T group, 0.3 T group, 0.6 T group, MSC group, and PBS group. All magnets were close to the target site, that is, within 0–1 mm, during and after infusion in the three magnetic targeting groups. Except for the PBS group, which was intraventricularly injected with vehicle (PBS) only, the other treatment groups were intraventricularly injected with 1 × 10⁶ SPIOs-DiR-MSCs (0 T, 0.15 T, 0.3 T, and 0.6 T group) or DiR-MSCs (MSC group). All animals received humane care in compliance with the Guide for the Care and Use of Laboratory Animals.
Fluorescence Imaging
After assessment of cardiac function using trans-thoracic echocardiography, six animals were randomly selected from each treatment group and were euthanized 24 h after cell injection for fluorescence imaging. Extensive PBS washing was performed to remove any cells adherent to the surface of organs. Hearts, lungs, livers, spleens, and kidneys were placed in a Carestream In-Vivo Multispectral Imaging System FX PRO (Carestream Health, Toronto, Canada) to detect DiR fluorescence under 748 nm of excitation and 780 nm of emission. Exposure time was set at 3 s and kept the same during the entire imaging session. Organs from the PBS group (i.e., the animals receiving normal saline) were also imaged as controls for background noise. Fluorescence signals (photon/s) from a fixed region of interest (ROI) were measured as described (36).
Quantification of Engraftment by Real-Time PCR
Quantitative PCR was performed 24 h (after fluorescence imaging and assessment of cardiac function), 10 days, and 3 weeks (after fluorescence imaging and assessment of cardiac function) after cell injection in six animals from each cell-injected group to quantify cell retention/engraftment. We injected MSCs from male donor SD rats into the left ventricle of female recipients, utilizing the sex-determining region Y (SRY) gene located on the Y chromosome as a detection target (28). The whole heart was harvested, weighed, and homogenized. Genomic DNA was isolated from aliquots of the homoge-nate corresponding to 12.5 mg of myocardial tissue using commercial kits (DNA Easy minikit, Qiagen, Hilden, Germany). The TaqMan® assay (Applied Biosystems, Carlsbad, CA, USA) was used to quantify the number of transplanted cells with the rat SRY gene as a template [forward primer: 5′-GAG CTT TGG GAG CAG TGA C-3′ (TM 55.1), reverse primer 5′- ATG AGG CTG ATA TTT ATA GTT TGG-3′ (TM 51.5), Taq Man probe: 6 FAM CAA CAG AAT CCC AGC ATG CAG AAT TCA G TAMRA; Applied Biosystems]. A standard curve was generated with multiple dilutions of genomic DNA isolated from male hearts to quantify the absolute gene copy numbers. All samples were spiked with equal amounts of female genomic DNA as a control. The copy number of the SRY gene at each point of the standard curve was calculated with the amount of DNA in each sample and the mass of the rat genome per cell. For each reaction, 50 ng of template DNA was used. Real-time PCR was performed using an Applied Biosystems 7900 HT Fast real-time PCR System. All experiments were performed in triplicate. Cell numbers per milligram of heart tissue and percentages of retained cells of the total injected cells (1 × 10⁶) were calculated.
Assessment of Cardiac Function
Postinfarct cardiac function was evaluated by transtho-racic echocardiography using a Vevo 770 high-resolution imaging system (Visual Sonics, Toronto, Canada) with a 17.5-MHz probe 24 h and 3 weeks after I/R and treatment (n = 13 for the 0.3 T group, n = 12 for other groups). After the induction of light general anesthesia, hearts were imaged in 2D and M-mode. The recordings were obtained from the parasternal long axis view at the level of the greatest LV diameter. The LV internal end-diastolic diameter (LVIDd) and LV internal end-systolic diameter (LVIDs) were measured from M-mode recordings. The LV ejection fraction (LVEF) was calculated as follows: LVEF (%) = [(LVIDd)3 - (LVIDs)3]/(LVIDd)3 × 100. All echocardiographic measurements were averaged from at least five separate cardiac cycles.
Immunohistochemistry and Morphometric Heart Analysis
At 72 h after cell injection, six representative recipient hearts from each group embedded in paraffin were cut into 5-μm slices, which were stained with Prussian blue (Shanghai HuaYi Bio Technology Co. Ltd., Shanghai, China). The representative hearts were harvested and frozen in OCT compound (Leica JUNG, Wetzlar, Germany) 72 h after transplantation and 3 weeks subsequent to echocardiography of the rat. Cryostat sections (8 mm thickness) were obtained for immunofluorescence staining to evaluate cardiomyocyte or endothelial differentiation of injected MSCs. Potential transdifferentiation of myocardium-like cells from implanted MSCs was verified by antibody immunostaining for troponin T (cTnT). Briefly, frozen tissue sections were fixed in acetone at 4°C for 10 min and incubated separately with a mouse anti-rat cTnT (TnT, cardiac isoform Ab-1; Laboratory Vision Corp, Chicago, IL, USA) diluted 1:100 for 60 min at room temperature. After washing with PBS solution, sections were incubated with a goat anti-mouse-conjugated FITC IgG (Molecular Probes, Inc., Eugene, OR, USA) diluted 1:200 for cTnT. Goat anti-rat CD31 (BD Biosciences, San Diego, CA, USA) was diluted 1:100 to check for evidence of angiogenesis. Secondary antibody of donkey anti-goat IgG conjugated with FITC (Molecular Probes) diluted 1:200 was used. Cell nuclei were counterstained with DAPI. Capillary density was also assessed by staining with anti-CD31 antibody as previously described (31). A total of 10 visual fields where a cross-section of capillaries was clearly visible were randomly selected in the peri-infarct zone, and the number of capillaries was counted under 200× magnification by a Leica Fluorescence microscope (Leica DM LB2).
For morphometric analysis, representative recipient hearts in each group were harvested at 3 weeks (after cardiac function assessment) and embedded in paraffin. Masson's trichrome staining was performed as described by the manufacturer's instructions [HT15 Trichrome Staining (Masson) Kit; Sigma-Aldrich]. To determine the infarct size, the average ratio of infarct size per LV was measured for all paraffin slides after staining with Masson's trichrome as previously described (21). All analyses were performed in a blinded manner.
Statistical Analysis
Animal numbers used in each experiment are shown in Table 1. All data are shown as mean ± standard deviation (SD). The difference between mean values was determined with one-way analysis of variance (ANOVA) and Bonferroni post hoc test. The correlation analysis was based on the Pearson correlation coefficient. Statistical significance was set at p < 0.05.
Study Protocol and Rat Numbers Used in Each Experiment

Twelve animals from each group (except for 13 animals in 0.3 T group) underwent echocardiography at 24 h and 21 days after injection, respectively. SRY, sex-determining region Y gene; PBS, phosphate-buffered saline (control); MSC, mesenchymal stem cell; T, Tesla (magnetic field strength).
Results
Labeling of Rat MSCs with SPIOs and DiR
The fourth passage of MSCs was characterized by fusiform or spindle-shaped morphology (Fig. 1A). The SPIOs-DiR-MSCs had a strong red fluorescence signal (Fig. 1B). The Prussian blue staining of the MSCs showed intracytoplasmic iron inclusions as dense blue-stained vesicles, and the magnetic nanoparticles were distributed evenly around the nucleus of the MSCs as a spherical shell (Fig. 1C). The labeling efficiency was approximately 100% reproducible using a very low concentration of iron oxide (50 μg/ml). Transmission electron microscopy of labeled cells indicated the presence of anionic magnetic nanoparticles exclusively in polydisperse vesicles in the cytoplasm, and no obvious change in the ultramicrostructure was observed (Fig. 1D).
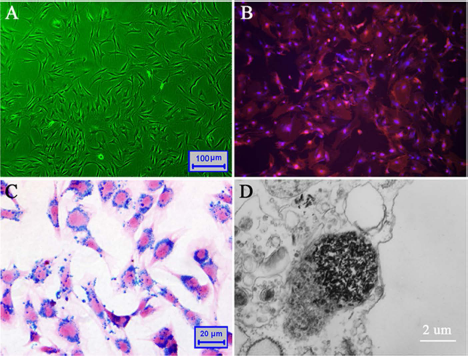
SPIOs and DiR labeling of rat MSCs. (A) The fourth passage of MSCs used in the present study. (B) MSCs were labeled with DiR, and cell nuclei were counterstained with DAPI. (C) Prussian blue staining of MSCs labeled with SPIOs on cover glass. (D) Transmission electron microscopy demonstrated the presence of numerous iron-containing vesicles in the cytoplasm of MSCs. SPIOs, superparamagnetic oxide nanoparticles; DiR, 1,1-dioctadecyl-3,3,3,3-tetramethyl indotricarbocyanine iodide; MSCs, mesenchymal stem cells; DAPI, 4′,6-diamidino-2-phenylindole.
Characterization of SPIOs-MSCs
To determine the adipogenic and osteogenic differentiation, the MSCs and SPIOs-MSCs were cultured for 21 days in media that promote differentiation into adipogenic and osteogenic lineages. As shown in Figure 2A and B, both MSCs and SPIOs-MSCs differentiated into the two lineages, as demonstrated by staining for Oil red O and Alizarin red, respectively. Following myocardial differentiation, real-time PCR showed that myocardial genes GATA-4, cTnT, α-actin, and Cx43 were both detected in differentiated MSCs and SPIOs-MSCs (all p > 0.05) (Fig. 2C). The expression of these myocardial genes was comparable in differentiated MSCs and SPIOs-MSCs (Fig. 2D). The results from RT-PCR suggested that low concentration of SPIO labeling did not affect MSC differentiation.
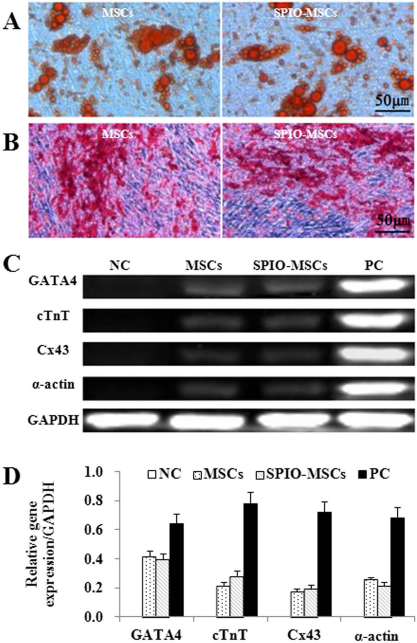
Differentiation capacity of SPIOs-MSCs. (A) Oil red O staining for adipogenic differentiation. (B) Alizarin red staining for osteogenic differentiation. (C) Real-time PCR for myocardial gene GATA-4, cTnT, α-actin, and Cx43. (D) Quantitative gene expression analysis showed no difference between MSCs and SPIOs-MSCs, suggesting low concentration of SPIO labeling did not affect MSCs differentiation. NC, negative control; PC, positive control.
In Vitro Theoretical Analysis of the Magnetic Targeting
The magnetic field lines around the magnet were mapped by point-by-point magnetic field measurements using a model 51662 Leybold Tesla meter. The center magnetic flux densities of three cylindrical magnet poles were 0.15 T, 0.3 T, and 0.6 T, and the peripheral strengths of the corresponding magnetic poles were 0.40 T, 0.56 T, and 0.93 T, respectively. As shown in Figure 3A–C, the magnetic field strength gradually declines with the shortened distance from periphery to center of the magnetic pole in the horizontal direction. Line 1 and line 2, respectively, represent magnetic field lines from the center and periphery of the magnetic pole in the vertical direction (Fig. 3D). According to the principle of magnetic attenuation, when the magnetic pole radius is 4 mm, the density of magnetic flux is attenuated by 47%, 43%, and 40% at 2 mm from the magnetic poles with 0.15 T, 0.3 T, and 0.6 T and is further decreased by 83%, 80%, and 76% at 6 mm from the three magnets, respectively (Fig. 3E–G). Thus, it is critical not only to overcome the magnetic attenuation but also to make magnetic field lines cover the target site for administering a specific strength of magnetic targeting. We controlled the movement ranges of magnets with the heartbeat to within 1 mm to maximally overcome magnetic attenuation. The actual measured working strengths of the magnets with 0.15 T, 0.3 T, and 0.6 T were at least 0.12 T, 0.23 T, and 0.49 T, respectively. All magnets used here were 8 mm in diameter and approximately the size of a MI in rats. We managed to cover the infarct area and infarct border zone with the strongest area of the magnetic field, thus ensuring target homing of magnetic-responsive cells.

Theoretical analysis of magnetic fields. (A-C) Distribution of magnetic field lines from three magnets. In the horizontal direction, the magnetic field strength gradually declines along the radius from the periphery to the center. (D-G) Schematic diagram of magnetic attenuation in the vertical direction. Lines 1 and 2 represent magnetic decay curves of central and peripheral of magnetisms, respectively, in the vertical direction.
Magnetic Capture of Flowing SPIOs-MSCs
The flowing SPIOs-MSCs were substantially attracted to the site where the magnetic pole was positioned. The flowing SPIOs-MSCs in the absence of an applied magnetic field demonstrated minimal accumulation (0.26% ± 0.04%), while the CEs reached 42.92% ± 4.76%, 70.53% ± 6.53%, and 80.2% ± 4.79% when the magnetic intensities were 0.15 T, 0.3 T, and 0.6 T, respectively (all p < 0.001 among groups) (Fig. 4A–C). The capture efficiency of cells increased as the magnetic intensity enhanced, indicating that the flowing SPIOs-MSCs can be significantly magnetically attracted in a magnetic flux density-dependent manner. In contrast, the flowing unlabeled MSCs exposed to the varying intensities of magnetic fields only showed minimal accumulation (0.22% ± 0.04%, 0.21% ± 0.02%, 0.21% ± 0.02% and 0.22% ± 0.03% for 0 T, 0.15 T, 0.3 T, and 0.6 T, respectively; all p > 0.05 among groups), indicating that MSCs without SPIOs were not magnetically responsive.

Magnetic concentration of the flowing SPIOs-MSCs. (A) A schematic illustration of the microfluidic system. The SPIOs-MSCs were injected into the tube, and the flow rate was controlled using a syringe pump. Cells were captured by use of three NdFeB magnets located beside the tube. (B) Representative images of cell accumulation in the segment close to the magnet at velocities of 5 mm/s. (C) The efficiency of magnetically capturing flowing SPIOs-MSCs with different magnetic intensities. (#p < 0.001 vs. the 0 T group; Δp < 0.001 vs. the 0.15 T group; ☆p < 0.01 vs. the 0.3 T group).
Magnetic Strength Influences Cell Distribution After Retention
Because vascular-delivered cells reportedly translocate into the parenchyma after 48–72 h (29), a subpopulation of animals was histologically examined at 72 h. Representative hearts were cryosectioned and analyzed for covisualization of CD31+ blood vessels (green) and DiR-labeled MSCs (red). Cells were found residing in the infarct area and peri-infarct border zone in the groups treated with SPIOs-DiR-MSCs or DiR-MSCs. Not surprisingly, the numbers of DiR-MSCs were indistinguishable in the 0 T and MSC groups (p > 0.05) (Fig. 5A, B). Three magnetic targeting groups exhibited more SPIOs-DiR-MSCs compared to either the 0 T group or the MSC group (all p < 0.001) (Fig. 5A–E). DiR fluorescence from MSCs suggested that the 0.15 T, 0.3 T, and 0.6 T groups demonstrated 2.18-, 3.95-, and 2.31-fold cell distribution, respectively, outside vascular structures relative to the 0 T group (all p < 0.001, respectively) (Fig. 5F). Interestingly, comparable results were found in the 0.6 T and 0.15 T groups (p > 0.05).

Microembolization at 72 h after intraventricular infusion (n = 6 for each group). (A–E) Representative fluorescence image of heart sections from MSC group (A), 0 T group (B), 0.15 T group (C), 0.3 T group (D), and 0.6 T group (E). CD31 antibody (green) stained for detecting blood vessels. MSCs were visualized by red fluorescence, and cell nuclei were counterstained with DAPI. (F) MSC numbers from 10 randomly selected high-power fields (five from the infarct area and five from the border zone) in each group were quantified by fluorescence microscopy. Data are mean ± SD. (#p < 0.001 vs. the MSC group or the 0 T group; Δp < 0.001 vs. the 0.15 T group; ☆p < 0.001 vs. the 0.3 T group). HPF, high power field.
Meanwhile, microemboli were detected in the groups treated with MSCs (Fig. 6A, B). The percentage of blocked vessels was comparable in the MSC and 0 T groups (2.93 ± 1.12% vs. 3.16 ± 1.36%, p > 0.05), indicating that MSCs can induce microvascular obstruction as has been reported previously (13,30). More importantly, the percentage of blocked vessels was 4.3% ± 0.98%, 8.24% ± 1.12%, and 15.12% ± 2.09% when the magnetic intensities were 0.15 T, 0.3 T, and 0.6 T, respectively, indicating that the external magnetic field may exacerbate magnetically responsive MSCs obstructed in microvascular, and the microembolisms further worsened with the escalating magnetic intensity (Fig. 6C).
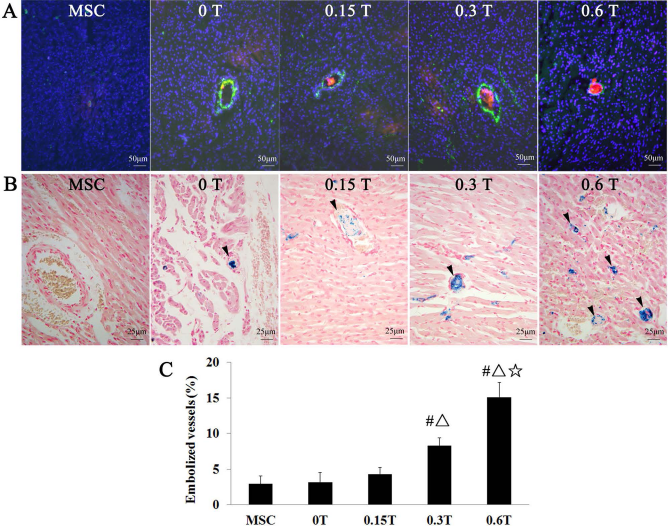
Microembolization at 72 h after intraventricular infusion (n = 6 for each group). (A) Representative heart frozen sections were stained for CD31 antibody (green) to detect blood vessels. SPIOs-DiR-MSCs were visualized by red fluorescence, and cell nuclei were counterstained with DAPI. The 0.6 T groups showed blood vessel completely blocked by cell clumps, whereas the 0 T, 0.15 T, and 0.3 T groups exhibited that blood vessels containing cells were still patent. (B) Prussian blue staining confirmed that blood vessels were blocked by cell clumps in the 0.3 T and 0.6 T groups (arrows), but most blood vessels containing cells were still patent in the 0 T and 0.15 T groups (arrows). (C) Quantitative analysis of blocked vessels by frozen sections stained with CD31 antibody. (#p < 0.001 vs. the MSC group or the 0 T group; Δp < 0.001 vs. the 0.15 T group; ☆p < 0.001 vs. the 0.3 T group).
The Relationship Between Magnetic Strength and Short-Term Cell Retention
Fluorescence imaging of hearts excised 24 h after cell infusion revealed more fluorescence signals in hearts from the three magnetic targeting groups than the 0 T and MSC groups. The enhanced fluorescence from three magnetic targeting groups was dependent on magnetic strength. As a negative control, excised hearts from the PBS group were also imaged. No signals were detectable (Fig. 7A, B).

Short-term cell retention and long-term cell engraftment in hearts and other organs. (A) Representative fluorescence imaging of hearts harvested 24 h after cell injection. (B) Quantificative analysis of fluorescence intensities. (*p < 0.001 vs. the PBS group; #p < 0.001 vs. the MSC group or the 0 T group; Dp < 0.001 vs. the 0.15 T group; ☆p < 0.001 vs. the 0.3 T group). (C) Cell retention in other organs by fluorescence imaging 24 h after cell injection. (#p < 0.001 vs. the MSC group or the 0 T group; Dp < 0.001 vs. the 0.15 T group; ☆p < 0.001 vs. the 0.3 T group). (D) Cell detection 24 h, 10 days, and 3 weeks after injection in the heart by quantitative PCR of the male-specific SRY gene (n = 6 for each group).
To compare off-target migration, lungs, livers, spleens, and kidneys from the same animals were also harvested to detect fluorescence signals of transplanted MSCs. Not surprisingly, fluorescence signals were detectable in these organs, but less so in the organs from three magnetically targeted groups than in those from the MSC and 0 T groups (Fig. 7C). Moreover, there is a trend that fluorescence signals in the off-target organs from three magnetically targeted groups decreased with the enhancement of strength of heart magnetic targeting (Fig. 7C).
Quantitative PCR for the male-specific SRY gene was performed 24 h after cell infusion. Consistent with the fluorescence imaging results, magnetic targeting enhanced short-term cell retention in a magnetic strength-dependent manner: the 0.15 T, 0.3 T, and 0.6 T groups exhibited 1.45-, 2.76-, and 3.86-fold greater cell retention rates, respectively, than the 0 T group (all p < 0.001) (Fig. 7D). The relationship between magnetic intensity and retained cell numbers is a positive linear correlation (r = 0.983, p = 0.017).
Different Magnetic Strengths Induce Varying Long-Term Cell Engraftment
To examine the effects of magnetic targeting on long-term engraftment, quantitative PCR for the male-specific SRY gene was performed 10 days and 3 weeks after cell infusion. Consistent with previous findings (4,6,19,20), quantitative PCR revealed that the five groups treated with MSCs experienced a substantial drop in surviving cells 10 days after cell infusion. The surviving cells furthered reduced 3 weeks after cell infusion; however, the three magnetic targeting groups still exhibited enhanced cell engraftment relative to the 0 T group (all p < 0.001) (Fig. 7D), which is consistent with previous findings (5,6), indicating that magnetic targeting can enhance MSC homing and engraftment. At 3 weeks after cell infusion, the 0.15 T, 0.3 T, and 0.6 T groups exhibited 1.88-, 3.06-, and 1.90-fold greater cell engraftment rates, respectively, than the 0 T group (Fig. 7D). Interestingly, cell engraftment rates in the 0.6 T group were lower than the 0.3 T group (p < 0.001) (Fig. 7D). Compared with the 0.15 T group, the 0.6 T group exhibited comparable cell engraftment rates (p > 0.05) (Fig. 7D).
Magnetic Strength Affects Therapeutic Benefits of Cell Transplantation and Left Ventricular Remodeling
To investigate functional outcomes mediated by magnetic targeting, LVEF was assessed by echocardiography at baseline (24 h after I/R and treatment) and for a subsequent 3 weeks. The 0.6 T group had the lowest LVEF at baseline, but LVEF did not differ between treatment groups (Fig. 8A), indicating a comparable degree of initial injury. Over the next 3 weeks, LVEF declined progressively in the PBS group, but it did not decline in the four MSC-treated groups. Both the 0.15 T and 0.3 T groups exhibited better therapeutic outcome, with LVEF superior to the 0 T group (all p < 0.001) (Fig. 8A) at 3 weeks. Not surprisingly, the 0.3 T group had a higher LVEF than the 0.15 T group (p < 0.001) (Fig. 8A). Notably, LVEF was comparable among the 0.6 T, 0 T, and MSC groups (all p > 0.05) (Fig. 8A). To facilitate comparisons, we calculated the treatment effect, that is, the change in LVEF at 3 weeks relative to baseline, in each group.

Functional benefits of cell transplantation. (A) LVEF measured by echocardiography 24 h and 3 weeks after cell injection (n = 13 for 0.3 T and n = 12 for other groups). (B) Changes in LVEF from 24 h to 3 weeks in each group. (*p < 0.001 vs. the PBS group; #p < 0.001 vs. the MSC group or the 0 T group; Δp < 0.001 vs. the 0.15 T group; ☆p < 0.001 vs. the 0.3 T group). (C–D) Changes in LVEF are plotted against changes in LVIDs (C) and LVIDd (D). Change reflects the difference between parameters measured 24 h and 3 weeks after therapy. LVEF, left ventricular ejection fraction; LVIDs, left ventricular internal end-systolic diameter; LVIDd, left ventricular internal end-diastolic diameter; ΔLVEF, Changes in LVEF from 24 h to 3 weeks.
The PBS group had a negative treatment effect, with LVEF decreasing over time. In contrast, the 0.15 T and 0.3 T groups exhibited a sizable positive treatment effect that was greater than the 0 T and 0.6 T groups (Fig. 8B). The similar changes were also observed in LVIDd and LVIDs. Compared with the MSC, 0 T, and 0.6 T groups, the 0.15 T group exhibited the greater reduction in LVIDd and LVIDs (0.21 mm and 0.15 mm, 0.19 mm and 0.13 mm, 0.21 mm and 0.14 mm vs. 0.59 mm and 0.40 mm, respectively, all p < 0.001). More importantly, the 0.3 T group exhibited the greatest reduction in LVIDs (1.4 mm) and LVIDd (0.90 mm) among three magnetic targeting groups (all p < 0.001). The percentage of change in the LVEF at 3 weeks, as a function of the LVIDs (Fig. 8C) or LVIDd (Fig. 8D) percentage of change indicated that appropriate intensity of magnetic targeting mediating cell therapy extended the therapeutic benefit of cell therapy for cardiac function and structure.
Morphometry at 3 weeks showed more infarct size in the PBS group than the five MSC-treated groups. The 0.15 T and 0.3 T groups showed significantly smaller infarct size than the 0 T group and the MSC group. Furthermore, the infarct size was 4.7% lower in the 0.3 T group than the 0.15 T group (p < 0.001) (Fig. 9A, B). Again, LV infarct size was indistinguishable among the 0.6 T, 0 T, and MSC groups (p > 0.05) (Fig. 9A, B).
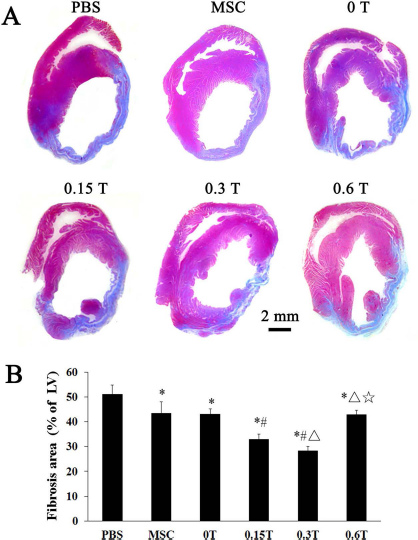
Left ventricular remodeling. (A) Representative Masson's trichrome stained myocardial sections from a subgroup of animals 3 weeks after treatment (n = 7 for 0.3 T and n = 6 for other group). (B) Quantitative analysis of fibrosis size. (*p < 0.001 vs. the PBS group; #p < 0.001 vs. the MSC group or the 0 T group; δp < 0.001 vs. the 0.15 T group; ☆p < 0.001 vs. the 0.3 T group).
Different Intensities of Magnetically Targeted Cell Delivery Induce Varying Angiogenesis
To determine the mechanisms underlying the beneficial effects of cell transplantation, we investigated the effects of cell transplantation on angiogenesis in the post-I/R hearts. At 3 weeks after cell transplantation, immunofluorescence staining for CD31 antibody indicated significant angiogenesis in MSC-treated hearts, with more CD31-expressing capillaries being present in the peri-infarct region of MSC-treated groups compared with the PBS group (all p < 0.05) (Fig. 10A, B). Quantitative evaluation of CD31-positive capillary numbers indicated that the PBS group exhibited the lowest capillary density. In contrast, both the 0.15 T and 0.3 T groups had more capillary density than the 0 T and 0.6 T groups (all p < 0.01) (Fig. 10A, B). Not surprisingly, the 0.3 T group had the most capillary density. Also, no significant difference was found among the 0.6 T, 0 T, and MSC groups (p > 0.05) (Fig. 10B). However, few cells stained positive for both the endothelial cell marker CD31 or the cardiomyocyte marker TnT and DiR in the five MSC-treated groups. These data suggest that transplanted MSCs may promote angiogenesis through a paracrine effect, contributing to the observed cellular therapy-associated beneficial effects.

Angiogenesis 3 weeks after cell infusion. (A) Frozen sections of representative hearts were stained for CD31 antibody (green) to detect capillary densities in the peri-infarct region 3 weeks after MSC transplantation. (B) Quantitative analysis of CD31-containing capillaries in the peri-infarct region (n = 7 for 0.3 T and n = 6 for other group). (*p < 0.05 vs. the PBS group; #p < 0.05 vs. the MSC group or the 0-T group; Δp < 0.01 vs. the 0.15-T group; ☆p < 0.001 vs. the 0.3-T group).
Discussion
To our knowledge, this is the first study that compares the impact of different strengths of magnetic targeting on the therapeutic outcomes of intraventricular delivery of MSCs in a rat model of ischemia/reperfusion. We found that magnetic targeting enhanced cell retention in a magnetic intensity-dependent manner, but “too high” of a strength can worsen embolic injury, thus undermining the therapeutic effects of cell transplantation. A number of animal studies and clinical trials have confirmed that transplantation effect was positively related to cell dose. Pouzet et al. reported that a fivefold difference in the number of transplanted skeletal myoblasts (SM, 1 × 10⁶ vs. 5 × 10⁶) caused a twofold difference in LVEF (22). Tambara et al. found that a large number of transplanted neonatal SM can replace the infarcted myocardium with reverse LV remodeling in infracted rat hearts (27). Clinical trials (17,23,32) and meta analysis (7) also demonstrated that heart function in patients with AMI was related to intracoronary transplanted cell dose. Our previous study found that repeated bone marrow mononuclear cell administration can significantly improve LV function, compared with a single infusion in patients with large AMI (35). Despite different cell types and delivery routes and different heterogeneity evaluations, these results demonstrated that, in patients with AMI, the effects of cell transplantation are dependent on the number of cells. This finding is the theoretical basis of cell transplantation guided by magnetic targeting. Previous studies have found that magnetic targeting can enhance cell homing and improve therapeutic effects irrespective of delivery route (5,6).
We found that the 0.15 T, 0.3 T, and 0.6 T groups exhibited 1.45-, 2.76-, and 3.86-fold greater cell retention rates, respectively, than the 0 T group. Cheng et al. (6) reported the magnet group exhibited more than fourfold greater cell retention rates than the cardiosphere-derived cell (CDC) group. Chaudeurge et al. (4) implanted a 0.1 T magnet (7 mm diameter, 5 mm thickness) subcutaneously, leading to cell retention between groups failing to be statistically significant using RT-PCR quantification. We speculate that the different results may be attributed to the difference in magnetic intensities and cell types. To our knowledge, there are several factors affecting the magnetic attraction of transplanted cells. First, the magnetic strength and the magnetic exposure time must be taken into consideration. Notably, the magnet intensity is not equal to the actual working strength, which is limited by magnetic attenuation. To overcome magnetic attenuation and obtain maximal working magnetic strength, the distance from the magnetic pole to the target site should be as short as possible. Second, it is critical that the distribution of magnetic field lines must cover the target site. Third, the iron content and the magnetic responsiveness of the transplanted cells may also be an important factor. In the present study, the distance from magnet to target lesion was 0~1 mm to maximally overcome magnetic attenuation; moreover, although the three magnets we used had different strengths, their surface areas were close to the size of a rat MI, ensuring the magnetic targeting effect.
Surprisingly, we found the 0.6 T group had the highest cell retention, but at 3 weeks cell engraftment was indistinguishable relative to the 0.15 T group; moreover, therapeutic benefits had no significant difference compared to the 0 T group. What led to the paradoxical phenomenon between cell retention and therapeutic effects? We found more microembolization in the 0.6 T group at 72 h than the 0.15 T and 0.3 T groups. We speculate that the paradoxical result may be associated with severer microembolization (15). Owing to more serious microembolisms, although the 0.6 T group had the highest cell retention, the retained cells did not represent effectively homing cells. Consequently, the result did not translate into enhanced cell engraftment. Moreover, these microembolisms may cause new myocardial injury or deteriorate original injury, partly offsetting the therapeutic benefit of homing cells and eventually resulting in comparable functional effects in the 0.6 T and 0 T groups. Basically, the cell transplantation effect is dependent on the effective homing cell number rather than retained cell number.
The intracoronary injection of MSCs has been proposed as a potential therapeutic option to repair an ischemic- or infarct-damaged heart. However, because MSCs are large (rounded up cells are ~22 to 25 μm in diameter), an important consideration of this approach is the potential of these cells to induce myocardial damage via microvascular obstruction, as previously reported (30). In addition, microvascular embolism caused by the intracoronary administration of MSCs is related to cell number (13). Cheng et al. (6) found that the intracoronary delivery of 1.0 × 10⁶ CDCs with or without magnetic targeting may result in microembolization. Nakamae et al. (20) have found that an external magnetic force can enhance adhesion of MSCs, which may partly account for microembolization. How, then, can magnetically targeted intracoronary cell delivery resulting in microvascular obstruction be improved? We speculate that smaller cells may have the advantage of reducing embolization. For example, very small embryonic-like stem cells (~2–4 μm) found in recent years have been proven to attenuate LV remodeling and improve LV systolic function in small animal studies (8,33). In addition, previous study found that sodium nitroprusside could influence the distribution of MSCs by reducing the number of MSCs trapped in the lungs (12). Vasodilator applications might represent another promising method to reduce embolism.
The magnetic targeting is an emerging and promising strategy in stem cell therapeutics. Before translation into possible clinical application, it is warranted to elucidate the optimized magnetic strength, exposure time, cell type, cell number, and administration route. Because the infarct size is larger and the ventricular wall is thicker in human beings or large animals than those in rats, we speculate that stronger magnetic strength is needed, and the vascular embolism may become a more serious complication.
Study Limitations
Although it describes a new and promising method, the present study has a number of limitations. The optimized magnet strength obtained from the small animal studies may not be directly extrapolatable to large animals. Additionally, we did not include a magnet targeting group without cell infusion and hence did not explore the effects of magnet targeting on a rat model of acute ischemia/ reperfusion. Furthermore, instead of optimizing basal cell dosage and magnetic exposure time, we chose cell dose and duration consistent with previous studies that showed functional benefits in small animals (5,6,9,18,19,25). Further dosage and exposure time optimization would be valuable, to inform future clinical studies. Finally, we did not investigate whether the SPIO movement guided by the magnetic field damaged the MSCs’ micro- and ultrastructures. Future studies will be designed to capture any changes caused by magnetic targeting in transplanted cell micro- and ultrastructures.
Conclusion
We conclude that cell retention can be continuously increased with the enhancement of magnetic targeting intensity. Magnetic targeting can enhance cell engraftment and improve therapeutic benefits through increasing the effectively homing MSCs in a magnetic intensity-dependent manner. However, when the magnetic field strength is elevated to a certain extent, microembolization is increased, thus reducing long-term cell engraftment and further undermining therapeutic benefit.
Footnotes
Acknowledgments
The authors gratefully acknowledge the financial support from the National Natural Science Foundation of China (81370003, 81000043, 11304194, and 81100145) and the Science and Technology Commission of Shanghai Municipality (13JC1401703). The authors declare no conflicts of interest.