
Abstract
We performed proteome mapping (PM), cataloging, and bioinformation analysis of protein lysates of human neural (CD133+) progenitor and stem cells (NPSCs) isolated from the olfactory sheath of a nose, multipotent mesenchymal (CD29+, CD44+, CD73+, CD90+, CD34-) stromal cells (MMSCs) isolated from human bone marrow, and tumor (CD133+) stem cells (TSCs) isolated from the human U87 glioblastoma (GB) cell line. We identified 1,664 proteins in the examined lysates of stem cells (SCs), 1,052 (63.2%) of which are identical in NPSCs and TSCs and 607 proteins (36.47%) of which are identical in MMSCs and TSCs. Other proteins in U87 GB TSCs are oncospecific or carcinogenesis associated. The biological processes, molecular functions, cell localization, and protein signal pathways of the proteins available in all three proteomes were annotated by PubMed (http://www.ncbi.nlm.nih.gov/pubmed/), PANTHER (http://www.pantherdb.org/), GeneOntology (http://www.geneontology.org/), and KEGG (http://www.genome.jp/kegg/) databases. It was shown that gliomaspheres of U87 GB had only 10 intracellular signal transduction pathways (ISTP) that were not modified by the neoplastic process, but only two of them (integrin and focal adhesion pathways) were accessible for regulatory action on gene candidates in the TSC nucleus. Carcinogenesis-free membrane proteins, IPST, and genes expressing proteins of these pathways in U87 GB TSCs can be viewed as main targets for regulatory effects on TSCs. We offer a novel concept of proteome-based complex therapy of tumors. This manuscript is published as part of the International Association of Neurorestoratology (IANR) special issue of Cell Transplantation.
Keywords
Introduction
Accomplishment of the Human Genome Project (14,23) neither answered the main challenges of contemporary healthcare, nor offered novel therapies to the diseases of civilization (8,24). Since then, the academic community initiated the Human Proteome Project and has already distributed assignments among the participants (9); however, its practical application still remains unclear. Proteome research can provide unique data, and we should avoid repeating the methodological mistakes of genomics.
The goal of our research was proteome mapping (PM) of U87 gliomasphere line lysates and comparing them to cell proteins of the tissue-specific neural progenitor and stem cells (NPSCs) and multipotent mesenchymal stromal cells (MMSCs) of a neuro-oncological patient (standard control) to detect specific neoplasm proteomic structure of tumor stem cells (TSCs), diagnostics, and analysis of carcinogenesis unaffected intracellular signal transduction pathways (ISTPs) in TSCs, as well as search for membrane proteins that would provide the ISTPs TSC targets for regulation of TSC effector functions in the cell therapy of tumors. The human U87 glioblastoma (GB) cells were chosen as a stable, standard, and ubiquitously available cell line.
Available data analysis showed that two-dimensional gel electrophoresis (2,10,11,17,22) or liquid chromatography (3,6,12,16,19) combined with mass spectrometry had most frequently been employed for NPSC, MSSC, and U87 GB TSC PM. Gel electrophoresis is more suitable for detecting differentially expressed proteins, rather than for mapping proteins, so we focused on the combination of high-performance liquid chromatography and mass spectrometry (HPLC-MS). The application of two-dimensional chromatography permits identification of about 1,000 proteins in a sample [1,002 in operation (11), 867 in operation (16)], so we focused on the method of two-dimensional division of tryptic peptides in cation-exchange and reverse-phase columns. To evaluate protein expression, we used a label-free method, as it did not require additional stages of peptide labeling and has been proven to reveal correct quantitative results for SCs (3,16).
Materials and Methods
Bone Marrow Sampling
A neuro-oncological patient (male, 42; NeuroVita Clinic, Moscow, Russia) signed the informed consent (Protocol No. 17 of Ethical Committee Meeting, Federal Research Center for Specialized Types of Medical Assistance and Medical Technologies of FMBA of Russia, Moscow, Russia). The bone marrow was taken from the pelvic or breast bone in the medical treatment room under local anesthesia (or in the operating room under general anesthesia) in sterile conditions. The optimal volume of bone marrow for mesenchymal cell isolation was 5 ml. Aspirated bone marrow was placed into a sterile tube Vacuette containing anticoagulant [disodium ethylenediaminetetraacetic acid (Na2EDTA); Vacutest kima s.r.l., Arzergrande (PD), Italy].
Isolation and Culturing of MMSCs
MMSCs were isolated from bone marrow by previously described methods (15). The bone marrow sample was resuspended in Roswell Park Memorial Institute (RPMI)-1640 medium (Life Technologies, Grand Island, NY, USA) containing 10% fetal bovine serum (FBS) (Life Technologies) and 1% penicillin–streptomycin (Life Technologies) solution and cultured in T150 culture flasks (Z707554; Sigma-Aldrich, St. Louis, MO, USA) at 37°C in 5% CO2 atmosphere. Four to 5 days later, the medium with nonadherent cells was replaced by fresh media. Adhered cells were cultured until 80% confluence and then passaged at 1:3. The medium was changed every 3 days. MMSCs were characterized by surface antigen expression [cluster of differentiation 29 positive (CD29+), CD44+, CD73+, CD90+, CD34-] evaluated in flow cytometry. The antibodies (Miltenyi Biotec, Bergisch Gladbach, Germany) to the listed CD proteins were added to the suspension of studied cells in the concentration recommended by the manufacturer, incubated for 30 min, and analyzed in a flow cytofluorometer (Miltenyi Biotec).
Isolation and Culturing of Brain TSCs
Brain TSCs were isolated from human U87 GB cell culture (male, age 44) by the method described previously (21). U87 GB cells were generously supplied by Dr. Vadim Kavsan (Department of Biosynthesis of Nucleic Acids, Institute of Molecular Biology and Genetics, National Academy of Sciences of Ukraine, Kyiv, Ukraine). The cells were cultured in low-glucose Dulbecco's modified Eagle's medium (DMEM; Gibco, Life Technologies, Moscow, Russia) with 10% FBS at 37°C in wet atmosphere with 5% CO2. Adherent cells were cultured until 80% confluence and passaged at 1:3. To obtain tumor spheres, the tumor cells were resuspended in neurosphere medium (DMEM/F12; Sigma-Aldrich); l-glutamine (2 mM; Life Technologies); B27 (Life Technologies); basic fibroblast growth factor (bFGF, 20 ng/ml; Sigma-Aldrich), epidermal growth factor (EGF, 20 ng/ml; Sigma-Aldrich), penicillin/streptomycin (100 U/ml), heparin (5 μg/ml; OAO Sintez, Kurgan, Russia), and cultured in T75 flasks (Z7077546; Sigma-Aldrich) at 37°C under 5% CO2. New growth factors were added every 3 days. Once a sufficient cell quantity was reached, CD133+ cells were immunosorted by anti-CD133-coated magnetic beads (Miltenyi Biotec). After that, the CD133+ cells were cultured in the medium applied earlier; their purity was evaluated in flow cytometry for CD133 antibody (5–10 μg/ml; Miltenyi Biotec), and it exceeded 90%.
Isolation of NSPCs From a Human
After signing of the informed consent, NSPCs were isolated from the olfactory epithelium of the patient's (male, 42; NeuroVita Clinic, Moscow, Russia) upper nasal cavity according to the method described previously (18) and cultured in DMEM with 10% FBS and a growth factors cocktail (Invitrogen) until cytospheres developed. Cytosphere cells were characterized by nestin (Miltenyi Biotec), thymocyte antigen 1 (Thy1; CD90; Miltenyi Biotec), heavy neurofilament 200 kDa (NF200) (Sigma-Aldrich), and glial fibrillary acidic protein (GFAP) expression (concentration 1 μg/ml, polyclonal; Serbsky Center, Moscow, Russia) in immunocytochemical analysis. For the analysis, the cells were fixed with 4% paraformaldehyde (Sigma-Aldrich), washed with PBS, and incubated overnight at 4°C with primary antibodies in the concentration recommended by the manufacturer (1–5 μg/ml). The cells were washed in PBS three times and incubated for 1 h with secondary antibodies; goat antimouse Alexa Fluor 633, goat anti-rabbit Alexa Fluor 488 (Invitrogen) at a concentration of 5 μg/L. Then the cell nuclei were stained with 4′,6-diamidino-2-phenylindole (DAPI; Sigma-Aldrich). The cells were then placed in 50% glycerin (Sigma-Aldrich), covered with 0.17-mm cover glass (Menzel-Gläzer, Braunschweig, Gemany), and studied under a Leica DMI6000B inverted microscope (Ryazan, Russia). The olfactory sheath was sampled and resuspended, and NPSCs were isolated from the cell culture of the olfactory sheath by CD133+ immunoseparation using magnetic beads as described above. The lysates for proteome research were prepared from the cell cultures.
Proteome Research
Three samples of the cells were cryopreserved in PBS. After thawing, the cells were lysed with Mammalian Cell Lysis Kit (Sigma-Aldrich) according to the manufacturer's guidelines.
Method of Lysing
One milliliter of lysing buffer was prepared. For that, the following mixture was prepared from the kit contents: 200 μl of buffer (250 mM Tris-HCl, pH 7.5), 5 mM EDTA; 200 μl 750 mM NaCl; 200 μl 0.5% sodium dodecyl sulfate (SDS); 200 μl 2.5% deoxycholic acid (DOC); 200 μl 5% Igepal; and 10 μl of protease inhibitor cocktail. All procedures were performed at 4°C. One milliliter of lysing buffer was added to the cells, and the cells were incubated for 15 min in a cooled Eppendorf Thermomixer Comfort shaker (Hamburg, Germany) and centrifuged in a cooled Eppendorf Centrifuge 5415F (Hamburg, Germany) for 1 h. Supernatant was removed for further research. After lysis, the amount of total proteins in lysates was NPSCs (Sample 01) 2,032 ± 85 μg/ml; U87 GB TSCs (Sample 02) 2,150 ± 360 μg/ml; MMSCs (Sample 03) 3,198 ± 281 μg/ml. The received samples were purified from low molecular components by Agilent 5K MWCO 4 ml Spin Concentrators for Proteins (Wilmington, Germany).
Purification From Low Molecular Components
The sample was put into the concentrator and centrifuged at 2,000 × g until 200 μl of fluid remained. Then 4 ml of water (MilliQ; Millipore, Billerica, MA, USA) was added and centrifuged again. The samples were washed three times to leave 200 μl of the sample. Additionally, the sample was washed from the concentrator twice with 200 μl of water (MilliQ). The obtained 600 μl of the samples was used for further research, and total protein was measured by Bradford assay kit (Sigma-Aldrich). The amount of lysate containing 300 μg of proteins was calculated and dried at 60°C in a CentriVap vacuum evaporator (Labconco, Kansas City, MO, USA).
Tryptic Cleavage
For trypsinolysis, 150 μl of Sample 01 and Sample 02 and 100 μl of Sample 03 were taken. Dried lysates were added to 25 μl of 2.2.2-trifluoroethanol (Reagent Plus, Sigma-Aldrich), 25 μl of 100 mM water solution of NH4HCO3 (Ultra, Fluka, Buchs, Germany) and 2 μl of fresh 50 mM water solution of trichloroethylphosphate (TCEP) (Fluka). This reaction mixture was exposed for 1 h at 60°C, then cooled to 25°C; 1 μl of fresh 84 mM aqueous iodoacetomide (Sigma-Aldrich) was added and exposed for 30 min at 25°C; then, 100 μl of 100 mM of NH4HCO3 solution, 300 μl of water and trypsin (from porcine pancreas, proteomics grade, bioreagent, dimethylated, Sigma-Aldrich) solution in 1 mM of hydrochloric acid (purum, Chimmed, Moscow, Russia) (trypsin concentration 100 ng/μl, trypsin/protein ratio 1:50 by weight) and exposed for 18 h at 37°C. Trypsin was added 1:50 by weight, that is, Sample 01: 305 μg protein, 61 μl trypsin solution; Sample 02: 323 μg protein, 64.5 μl trypsin solution; Sample 03: 320 μg protein, 64 μl trypsin solution. Three microliters of the solutions was analyzed by mass spectrometry for trypsinolysis completeness. Completeness of trypsinolysis was controlled by the peaks of tryptic peptides and by the areas of peaks with m/z 842.51 Da and 421.76 Da. When the reaction was over, the content of the tubes were stripped to dryness at 60°C in the CentriVap.
Separation of Tryptic Peptides
Tryptic peptides (50 μg) were dissolved in 60 μl of solvent A [30% acetonitrile (ACN; HPLC-gradient grade, PAI-ACS; Panreac Quimica SA, Barcelona, Spain), 70% water, 0.1% formic acid (FA; Suprapur; Merck, Darmstadt, Germany), pH 2.7] and separated by a Dionex Ultimate 3000, equipped with a fraction collector at a strong cation exchange column (SCX) MIC-10-CP (Poros 10S material, 1 mm × 10 cm; Dionex, Amsterdam, Netherlands). The volume of injected probe was 20 μl, the flow of solvent 30 μl/min, column temperature 25°C, detection by UV absorption at wavelength of 214 nm. Solvents: Mobile A phase: 30% ACN, 70% water, 0.1% FA; mobile B phase: mobile A phase + 500 mM KCl (purum, Chimmed, Moscow, Russia). Gradient: 0–10 min: 0% B; 10–100 min: 0–30% B; 100–114 min: 30–100% B; 114–119 min: 100% B; then column equilibration for 35 min at A phase. Twenty fractions were gathered from 2 to 122 min with 6-min intervals. The fractions were stripped off to 100 μl at 60°C in the Eppendorf Concentrator 5301centrifuge evaporator.
Mass Spectrometry
Tryptic peptides were analyzed in the nanoflow chromatograph Dionex Ultimate 3000 in combination with mass spectrometer LTQ Orbitrap XL (Thermo Fisher Scientific, San Jose, CA, USA) with nanospray ionization (NSI) ion source. Peptides were separated in Acclaim C18 PepMap100 column (75 μm × 150 mm, grain size 3 μm, Dionex), equipped with trap column (Acclaim C18 Pepmap100, 500 μm × 5 mm, grain size 5 μm, Dionex). The sample (20 μl) was loaded in a trap column for 1 min in 99% water/1% ACN/0.1% FA, then washed for 4 min with 0.05% solution of trifluoroacetic acid (for protein sequence analysis, Fluka, Buchs, Germany) in water, and equilibrated for 1 min with 99% water/1% ACN/0.1% FA, 20 μl/min flow. Chromatography: 0.3 μl/min flow, mobile A phase: 98% water/2% ACN/0.1% FA; mobile B phase: 20% water/80% ACN/0.08% FA. Gradient: 0–6 min: 0% B; 6–120 min: 0–50% B; 120–150 min: 50–100% B; 150–165 min: 100% B; 165–170 min: 100-0% B; complete analysis time 175 min. Mass spectra were registered in the mode of positive ions in m/z 300–2,000 Da range, needle voltage 1.7 kB, source temperature 200°C, voltage to capillary 43 B, to lens 165 B. Mass spectra were registered in orbital trap in Fourier transform (FT) mode (resolution 60,000, number of accumulated ions 1·106, maximal accumulation time 700 ms, 1 microscan), tandem (MS/MS) spectra were obtained by ionization induced by collisions (CID) in a linear trap (enhanced scanning mode, number of accumulated ions 50,000, maximal accumulation time 500 ms, three microscans, collision energy 35% from maximal). MS/MS spectra were registered for the seven most intensive ions. Dynamic exclusion turned on after registration of one spectrum; time of exclusion was 1 min. Ions with charge over +1 underwent secondary fragmentation.
Data Analysis
To identify proteins, the mass spectra were converted into mgf files by Proteome Discoverer 1.0 (ThermoFisher Scientific) software, pattern WF_Spectrum_Export_MGF set by default except for mass range (from 300 to 10,000 Da) and retention time (0–180 min). Protein search was done on the local server with Mascot Server 2.3.02 software (Matrix Science, London, UK). Search parameters: database National Center for Biotechnology Information nonredundant GenBank (NCBInr, version dated January 25, 2012); species: Homo sapiens; enzyme: trypsin; number of missed cleavages 2; fixed modifications: ureamethylation of cysteines; possible modifications: acetylation of N-terminus proteins and oxidized methionine; other modifications were checked with error-tolerant search. Accuracy of parent ion mass is 10 ppm, fragments 0.8 Da; ion trap. Identified proteins were sorted by MudPIT score, presented peptide at significance level p < 0.05. Received lists of identified proteins and chromatic mass spectra were uploaded to Skyline 1.2.0.3303 (University of Washington, https://skyline.gs.washington.edu/labkey/project/home/software/Skyline) and received peak peptide areas in every probe. Then the areas of all peaks of every identified peptide were summed and normalized according to total area of all identified peaks in the probe.
Results
Data processing by Mascot Server software permitted identification of 1,664 proteins in all probes. Further processing by Skyline software detected the following: in Sample 01, 1,447 proteins by 11,176 peptides (range of protein molecular weight from 3.53 to 3908.10 kDa); in Sample 02, 1,225 proteins by 13,674 peptides (range of protein molecular weight from 4.60 to 3908.10 kDa); in Sample03, 842 proteins by 10,932 peptides (range of protein molecular weight from 5.02 to 1,017.07 kDa). Dynamic range of identified proteins made seven orders (from 4.8 × 10⁻⁷% to 5.3%), identifying regulatory low copy proteins, such as interleukins 25 and 36, growth factor receptors, etc. Also specific markers of mesenchymal (CD44, integrins α-V and β-1) and neural progenitor (nestin) stem cells were identified. In the three samples, a total of 606 proteins had been identified.
Proteome maps of NPSCs, MMSCs, and U87 GB TSCs are shown in the research reports at the webpage www.neurovita.ru (7,13,19). The data for PM of the proteins of different types has undergone comparative biocomputing analysis. First, rough computing analysis of PM proteins from compared groups was performed, and the SC proteins of low functional significance were excluded. All proteins identified only in one cell type were excluded from the examined SC proteomes. Out of 1,664 proteins, we obtained comparison group A (NPSCs and TSCs; 1,052 proteins) (19) and comparison group B (MMSCs and TSCs; 607 proteins) (19). The results of comparison of group A (63.2% identical proteins) demonstrated an affinity of morphofunctional phenotypes of NPSCs and gliomaspheres as with cells that had neural-like differentiation and localization in the nervous system. Although the features of stemness are characteristic for MMSCs and TSCs and they are not so different phenotypically, their multipotent differentiation condition showed considerable differences in the proteome profile of these cells.
We excluded all proteins with NSI values that deviated less than twice from the groups. We presumed that only significantly different NSI values represent basic regulatory tendencies. Therefore, only 637 proteins were left in group A (38.28%) and 425 proteins in group B (25.54%).
A summarizing table of the group A and group B proteins (503 proteins) was previously compiled (18) showing the proteins with double NSI and greater in either group A or B. The proteins from the table were annotated and further processed; the results were presented in an additional file “Annotation of NPSC, MMSC, and TSC proteins” (19). Using the data of the survey (3) and databases, we excluded all known proteins involved in GB carcinogenesis. These are three such proteins: molecule CD44 (Indian blood group), isocitrate dehydrogenase 1 [nicotinamide adenine dinucleotide phosphate positive (NADP+)] soluble, and vimentin; they were also excluded from further study.
The next stage of bioinformation analysis was the distribution of the proteins into functionally significant clusters for intracellular and intercellular regulation, protein clusters-targets.
The first cluster of the proteins, “Receptor targets,” was set: we isolated proteins located on the membranes of NPSCs, MMSCs, and TSCs (Table 1), totaling 105 proteins (6.31%), from the remaining proteins of proteomic profiles of NPSCs and TSCs as well as MMSCs and TSCs. For that, we selected the proteins with GO:0005886 plasma membrane code in annotation.
Cluster of Membrane Proteins

NPSCs, neural progenitor and stem cells; MMSCs, multipotent mesenchymal stromal cells; TSCs, tumor stem cells; NSI, nanospray ionization.
The second cluster, “Nuclear targets,” was set: we isolated protein groups located in the nuclei of the remaining proteins of proteomic profiles of NPSCs and TSCs as well as MMSCs and TSCs, totaling 146 proteins (8.77%, Table 2). For that, the proteins with GO:0005634 nucleus code were selected.
Nuclear Proteins Expressed in NPSCs, MMSCs, and U87 GB

In conclusion, the third cluster, “Proteins of signal induction and intercellular regulation,” was set: we selected the proteins expressed by NPSCs and MMSCs and compiled the table of NPSC- and MMSC-expressed proteins (Table 3), totaling 33 proteins (1.98%). For that, the proteins with the word “extracellular” in the code were selected: GO:0005576 extracellular region, GO:0005578 proteinaceous extracellular matrix, GO:0005615 extracellular space, GO:0031012 extracellular matrix, GO:0044420 extracellular matrix part.
Proteins Expressed in NPSCs, MMSCs, and U87 GB TSCs

Proteome similarity matrix (PSM) for group A and B has been defined. The third stage of bioinformation processing of protein proteome mapping was named the “trenchant” bioinformation analysis of group A PSM and group B PSM using proteome information databases and exclusion of PSM proteome profile of the proteins involved in GB carcinogenesis and tumor metabolism. As seen from the tables, the lists of the proteins contain proteins involved in carcinogenesis of other neoplasms, but are not found in GB carcinogenesis. Searching protein annotations for key words: mitochondrion, mitochondrial, metabolic, metabolism, Warburg, electron transport, we excluded mitochondrial proteins and NPSC and TSC metabolome-associated proteins from group A PSM and group B PSM (19): the proteins that provide quick adenosine triphosphate (ATP) production to support energy, quick macromolecule synthesis, respiratory chain proteins, Warburg effect proteins, and other metabolome proteins. As a result, 34 nuclear, 53 membrane, and 10 extracellular proteins remained in the groups.
We excluded proteins associated with GB's typically disordered signal transduction pathways from group A PSM and group B PSM.
We excluded proteins of cell carcass (cytoskeletal proteins, endoplasmic reticulum proteins) from group A PSM and group B PSM through the search for key words in protein annotations: cytoskeleton, cytoskeletal, and reticulum. As a result, 19 nuclear, 20 membrane, and 5 extracellular proteins remained in the groups (Tables 4–6).
Membrane Proteins Shared by NPSCs, MMSCs, and TSCs Remaining After “Trenchant” Analysis

Nuclear Proteins Shared by NPSCs, MMSCs, and TSCs Remaining After “Trenchant” Analysis

Extracellular Proteins of Signal Transduction Shared by NPSCs, MMSCs, and TSCs Remaining After “Trenchant” Analysis

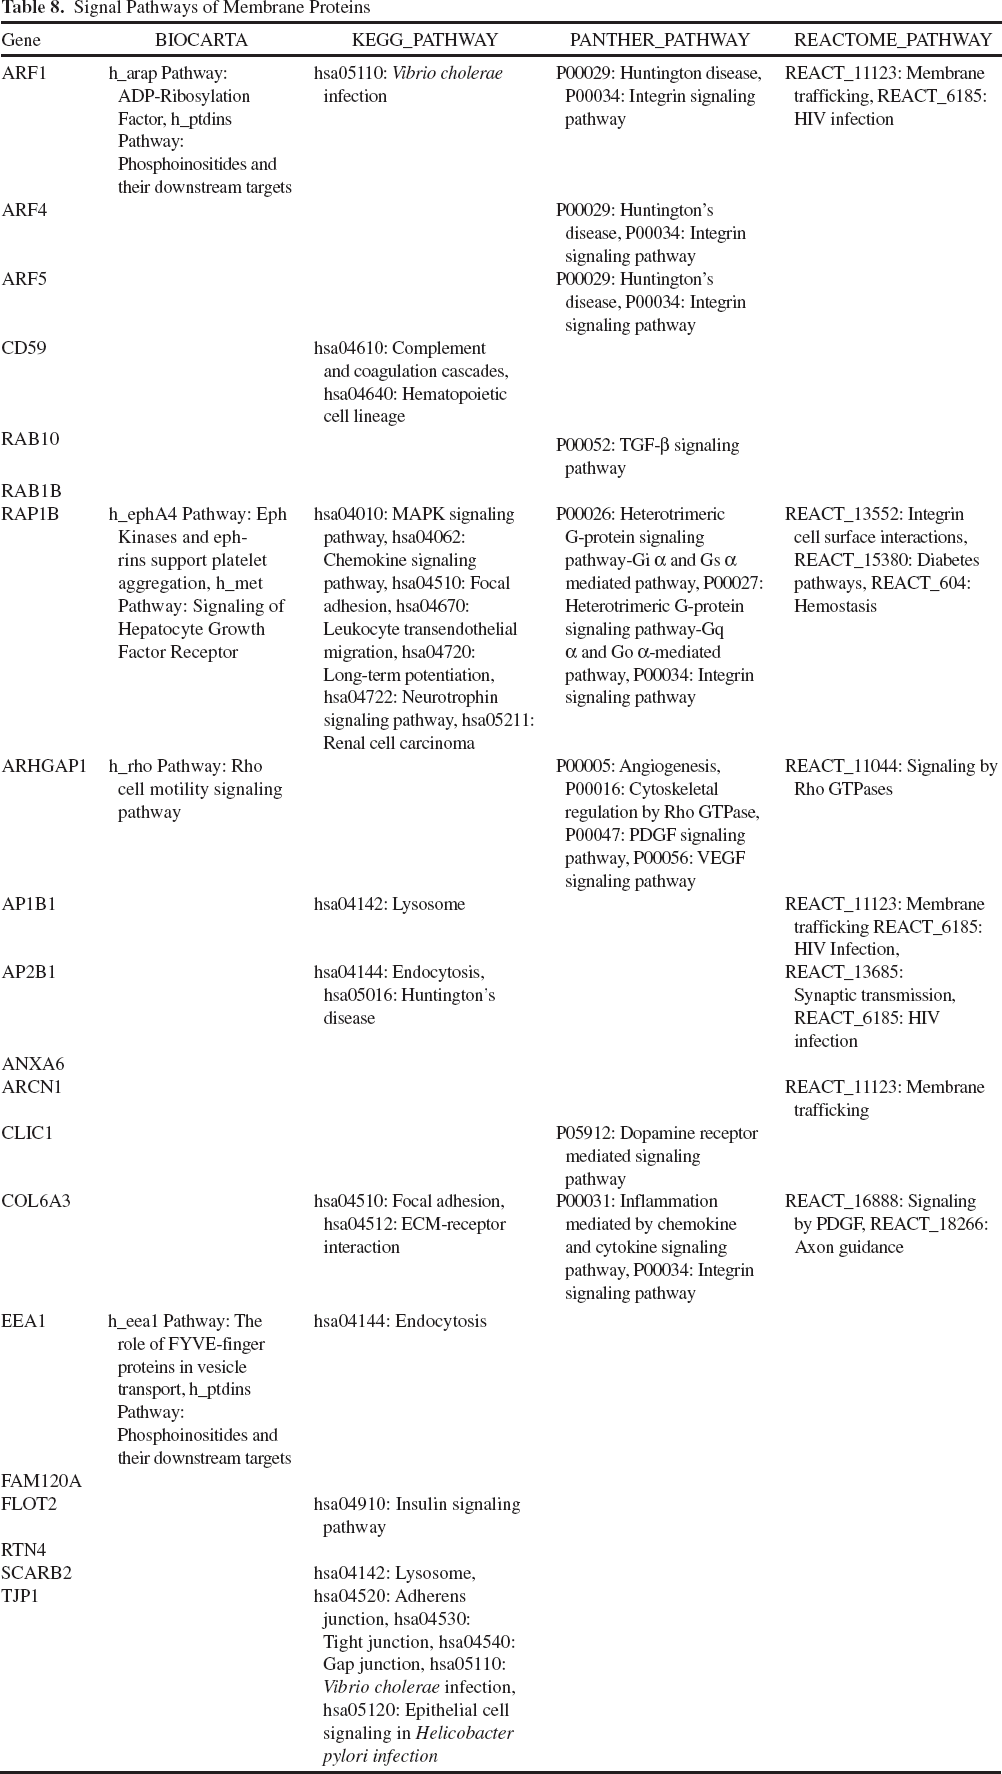
Protein signal pathways were annotated for the proteins from Tables 4, 5, and 6 using the data from Biocarta (http://www.biocarta.com/), KEGG_PATHWAY (http://www.genome.jp/kegg/), PANTHER_PATHWAY (http://www.pantherdb.org/) and Reactome (http://www.reactome.org/). Protein–protein interactions were annotated using Biomolecular Interaction Network Database (BIND: http://bind.ca), Database of Interacting Proteins (DIP: http://dip.doe-mbi.ucla.edu/), Molecular Interaction Database (MINT, http://mint.bio.uniroma2.it/mint/), NCICB_CAPATHWAY_interaction (http://cgap.nci.nih.gov/Pathways/), and Reactome_Interaction (http://www.reactome.org/).
Identified signaling pathways free from carcinogenesis in U87 GB TSCs (CD133+) are presented in Tables 7–9.
Signaling Pathways of Extracellular Proteins

Signal Pathways of Membrane Proteins
Signal Pathways of Nuclear Proteins

Comparison of these tables revealed 10 signaling pathways involving two proteins or more (Table 10), namely, phosphoinositide signaling pathways and their targets, Vibrio cholerae infection pathway, focal adhesion pathway, lysosomal pathway, integrin signaling pathway, Huntington's chorea pathway, Rho GTPase signal transfer, HIV infection pathway, membrane transport pathway, and hemostasis pathway. The pathways of the proteins of different localizations (e.g., nucleus and membrane) are of principal interest, and they are show in bold in Table 10.
Signaling Pathways Involving Two Proteins or More
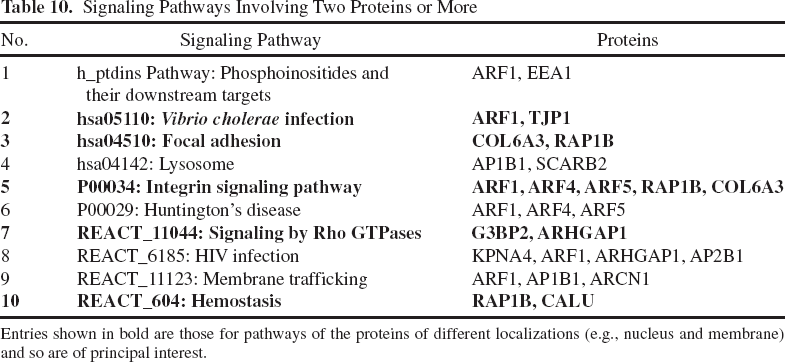
Entries shown in bold are those for pathways of the proteins of different localizations (e.g., nucleus and membrane) and so are of principal interest.
Discussion
Having compared proteome profiles of U87 GB TSC proteins with the protein profiles of tissue-specific human NPSCs and MMSCs that hypothetically present the reference of the species (human), we identified 1,664 proteins in the examined lysates, of which 1,052 proteins (63.2%) are identical in NPSCs and TSCs, and 607 (36/47%) are identical in MMSCs and TSCs. We supposed that the similarity matrix in TSCs was composed of healthy and species-specific protein cell substrates that remained intact in TSCs. These proteins could serve as the baseline for the development of personalized targeted management of effector functions of TSCs unable to respond to the usual signals of intercellular regulation of tissue-specific SCs and regulatory cells of the immune system. Thus, we annotated TSC proteins free from neoplastic transformations of carcinogenesis, and specified membrane, secreted, and nuclear proteins using the appropriate databases. These data permitted diagnostics of 10 signal transduction pathways free from carcinogeneic transformation in U87 GB TSCs. To analyze the opportunity to influence these TSC pathways, we attempted to predict the TSC response to regulatory stimulus. Lysosomal pathways and membrane transport pathways do not transfer the signal to the nucleus, so we excluded them from our further study. Human immunodeficiency virus (HIV) and Vibrio cholerae infection pathways are characteristic for the cells of the immune system and intestinal epithelium, respectively, and are not known to be associated with malignant degeneration of the cells; hence, they were excluded from further analysis. The hemostasis pathway is typical for platelets and blood coagulation, hence, it was also excluded. Integrin signaling pathway seems the most relevant as integrins are markers of SCs, and changes in their regulation can be associated with dedifferentiation and cell phenotype change. This pathway mostly coincides with the focal adhesion pathway, which is consequently observed as one pathway.
The integrin/focal adhesion pathway begins from the signal transfer to the cell through various growth factors [EGF, c-fos-induced growth factor (FIGF), hepatocyte growth factor (HGF), insulin-like growth factor 1 (IGF1), platelet-derived growth factor A (PDGFA), PDGFB, PDGFC, PDGFD, placental-derived growth factor (PGF), vascular endothelial growth factor A (VEGFA), VEGFB, VEGFC] and extracellular matrix proteins [laminins; α 1 (LAMA1), LAMA2, LAMA3, LAMA4, LAMA5, γ 3 (LAMC3), β 4 (LAMB4), LAMB1, LAMB2, LAMB2, LAMC1, and LAMC2; collagens; 1 α 1 (COL1A1), COL1A2, COL2A1, COL3A1, COL4A1, COL4A2, COL4A4, COL4A5, COL4A6, COL5A1, COL5A1, COL5A2, COL6A1, COL6A2, COL6A3, COL11A1, and COL11A2; fibronectin (FN1); chondroadherin (CHAD); cartilage oligomeric matrix protein (COMP); tenascins, C (TNC), N (TNN), R (TNR), and XB (TNXB); integrinbinding sialoprotein (IBSP); reelin (RELN); secreted phosphoprotein 1 (SPP1); thrombospondins, 1 (THBS1), THBS2, THBS3, and THBS4; vitronectin (VTN); and von Willebrand factor (VWF)]. The signal at the external surface of the plasma membrane is transferred due to the integrins a 11 (ITGA11), ITGA6, ITGA1, ITGA2, α 2 β (ITGA2B), ITGA3, ITGA4, ITGA5, ITGA7, ITGA9, α V (ITGAV), ITGA10, ITGA8, β 1 (ITGB1), ITGB3, ITGB4, ITGB5, ITGB6, ITGB7, and ITGB8; caveolins 1 (CAV1), CAV2, and CAV3; and tyrosine kinase receptors [epidermal growth factor receptor (EGFR), v-erb-B2 avian erythroblastic leukemia viral oncogene homolog 2 (ERBB2), fetal liver kinase 1 (FLT1), FLT4, insulin-like growth factor 1 receptor (IGF1R), kinase insert domain receptor (KDR), met proto-oncogene tyrosine kinase (MET), and platelet-derived growth factor receptor A (PDGFRA), PDGFRB]. Accordingly, we received the set of protein targets at the cell membrane, permitting efficient action on the integrins and focal adhesion signal transduction pathways and regulation of reproductive and proliferative functions of TSCs through activation or inhibition of the expression of regulation-susceptible TSC genes. This approach radically differs from the current conventional concept of targeted tumor therapy. All contemporary genome, transcriptome, and proteome approaches that target the tumor cell look for oncospecific and carcinodependent target proteins at the cell membrane, in the signal transduction pathway, or the tumor cell nucleus and target their therapies at them. Meanwhile, we offer a different strategy aimed at management and control of the proliferative potential of TSCs. We deem it practical to find what was left intact and species specific in the TSC proteome and to determine if it is possible to affect the TSC genome that is not responsive to conventional external actions. The contemporary paradigm of all available cancer therapies is directed at complete elimination of all tumor cells (TCs) or TSCs in every possible way until full recovery of the patient occurs and, thus, cannot be efficient by default. Inefficiency of the available paradigm is proven by the absence of functioning technologies of therapeutic assistance in cancer cases (4). We presume that even theoretically all TCs and TSCs cannot be eliminated. TSCs are the way of adaptation and survival for a mutant somatic stem cell (5). TSCs are similar to a spore in plants permitting survival in unfavorable conditions. Consequently, the available therapeutic paradigm seems to change. The alternative can be provided by the methods aimed at turning the disease into a chronic, therapeutic reduction of TC amount, regulation of TCs and control over their number in the body (from 107 to 103) and, if necessary, management of TSC effector functions (5). We propose that the goal of anticancer therapy lies in the transfer of acute lethal malignant processes into chronic and not lethal processes. According to Archakov (1), 500,000 (5 × 10⁵) TCs circulate the healthy body, and the person does not die from this number of TCs. Their expansion to 109 signifies a precancer state, and only expansion of TC number over 109 manifests clinically into cancer or other neoplasm. Every method of quantitative elimination of TCs in the organism has specific limitations: surgery permits reduction of TC number to 109, chemo- and radiotherapy reduce TC number from 109 to 107, immunotherapy decreases TC number from 107 to 105. It is well proven by now that regulation of TC number lower than 5 × 10⁵ is performed by tissue-specific stem and progenitor cells (5). Hence, complex proteome-based therapy of tumors must incorporate all available types of cytoreductive, cytotoxic, and cytostatic therapy of tumors (surgery, chemo- and radiotherapy and immune therapy) allowing for reduction of TC number from 109 to 5 × 10⁵ and end in cytoregulatory therapy with autologous tissue-specific regulatory SC managing effector (reproductive and proliferative) functions of TSCs of the tumor.
Conclusion
We presume that the complex of to-date antitumor proteome-based therapy should include three compulsory stages: 1) conventional cytoreductive, cytostatic, and cytotoxic therapies; 2) adoptive and cytotoxic immune therapy; and 3) cytoregulatory therapy of TSCs. The first stage involves conventional treatment: surgical removal of tumors, chemo- (1–2 line) and radiotherapy (up to 20 Gray). The second compulsory stage of cancer therapy must consist of adoptive immune therapy (individual anticancer vaccines, cytotoxic lymphocytes, immune drugs, and antibodies) that is still considered experimental. The third stage of antitumor therapy corrects reproductive, proliferative, and metastatic functions of TSCs through targeted action on target proteins of ISTPs able to respond. Theoretic and methodological basis for the third stage therapy was provided earlier as the inherent part of the concept of cytoregulatory therapy of neoplasms (5). PM and profiling of the proteins in order to detect signal pathways unaffected by carcinogenesis and identification of genes susceptible to regulatory action as well as analysis of their proteome variations can be the instrument to obtain autologous stem cells with preset potential for personalized targeted regulatory action on TSCs (20).
Footnotes
Acknowledgments
This work was financially supported by the Ministry of Education and Science of Russia, agreement No. 14. 575.21.0038 on 6/27/2014. The authors declare no conflicts of interest.