
Abstract
Magnetic resonance imaging (MRI)-based tracking is increasingly attracting attention as a means of better understanding stem cell dynamics in vivo. Intracellular labeling with micrometer-sized particles of iron oxide (MPIOs) provides a practical MRI-based approach due to superior detectability relative to smaller iron oxide particles. However, insufficient information is available about the general utility across cell types and the effects on cell vitality of MPIO labeling of human stem cells. We labeled six human cell types from different sources: mesenchymal stem cells derived from bone marrow (MSCs), mesenchymal stem cells derived from adipose tissue (ASCs), presumptive adult neural stem cells (ad-NSCs), fetal neural progenitor cells (f-NPCs), a glioma cell line (U87), and glioblastoma tumor stem cells (GSCs), with two different sizes of MPIOs (0.9 and 2.84 μm). Labeling and uptake efficiencies were highly variable among cell types. Several parameters of general cell function were tested in vitro. Only minor differences were found between labeled and unlabeled cells with respect to proliferation rate, mitotic duration, random motility, and capacity for differentiation to specific phenotypes. In vivo behavior was tested in chicken embryos and severe combined immunodeficient (SCID) mice. Postmortem histology showed that labeled cells survived and could integrate into various tissues. MRI-based tracking over several weeks in the SCID mice showed that labeled GSCs and f-NPCs injected into the brain exhibited translocations similar to those seen for unlabeled cells and as expected from migratory behavior described in previous studies. The results support MPIO-based cell tracking as a generally useful tool for studies of human stem cell dynamics in vivo.
Keywords
Introduction
Using animal models to study the in vivo behavior of human stem cells is an essential preclinical step in the development of clinical stem cell therapies. Methods to track human stem cells dynamically and noninvasively after transplantation into animals are therefore attracting increasing attention. Several general approaches have been utilized. Fluorescent or luminescent markers permit cell tracking with whole animal imaging systems at relatively low spatial resolution (4) or at higher resolution but with depth limitations (<500 μm) (10). To overcome depth constraints, radiochemical tracking methods based on PET (positron emission tomography) or SPECT (single photon emission computed tomography) and magnetic tracking methods using MRI (magnetic resonance imaging) have been developed. Visualization depth for PET and SPECT is unlimited, but spatial resolution remains modest, around 1–2 mm (14). Although considered less sensitive than PET at the molecular level, MRI can achieve substantially higher spatial resolution, depending on the field strength of the magnet used (6). Because MRI is also essentially depth-unlimited and does not require the production of expensive radiochemical compounds or involve potentially harmful radiation load for long-term tracking, it is gaining popularity as a tool for stem cell tracking in both small and large animal models (16,17).
To be detectable by MRI, implanted stem cells must contain a para- or superparamagnetic substance that locally changes T1, T2, and/or T2* relaxation time, thereby generating a magnetic signal change that pinpoints location within the organism. Although several alternatives exist to label cells with para- or superparamagnetic compounds, the most commonly used are particles of iron oxide of various sizes, as they combine high sensitivity and low toxicity (17,32). These include the partly overlapping size categories and types: magnetism-engineered iron oxide (MEIO) nanoparticles, (6–12 nm) (15), monocrystalline iron oxide nanocompounds (MIONs, 5–20 nm) (31), ultrasmall superparamagnetic iron oxide particles (USPIOs, 30–50 nm) (13), and nanometer-sized superparamagnetic iron oxide particles (SPIOs, 50–150 nm) (35,36), which permit visualization of cell clusters or single cells that can engulf very high particle loads, such as macrophages (11). Recent efforts have also been made to label cells using micrometer-sized particles of iron oxide (MPIOs, one to several microns in diameter). MPIOs are more readily detected than the smaller particles of iron oxide due to the higher density of iron they provide and, therefore, more readily permit imaging at single cell resolution (12,24,29).
The iron oxide core of MPIOs is typically embedded in a polystyrene matrix that can be impregnated with or conjugated to a variety of moieties, including fluorescent molecules for microscopy and antibodies or ligands for targeting to specific cell surface antigens (28). MPIOs can thus be used to study different cell types in different dynamic situations. However, only a few cell types have been tested for MPIO labeling, and relatively little is known about the effects on cell function (7,12,21,23,24,27). For example, conjugated MPIOs might interact chemically with and perturb intracellular proteins and cellular processes. Moreover, the inclusion into cells of particles with such large diameters could easily compromise cell shape dynamics and sterically hinder cell movements. Better information about the magnitude of potential deleterious effects is therefore needed to fully evaluate the use of MPIOs for in vivo MRI-based tracking.
Here we have labeled with MPIOs several types of human stem and progenitor cells and assessed cell behavior both in vitro and in two animal models. Our results contribute to a more comprehensive treatment of the issue and indicate that MPIO labeling may be a generally useful tool for in vivo stem cell tracking using MRI.
Materials and Methods
Cell Sources and Culture
Bone marrow-derived human mesenchymal stem cells (MSCs, donated by Ola Myklebost) were from a human telomerase reverse transcriptase (hTERT) immortalized cell line maintained in α-MEM (Gibco) supplemented with 10% fetal calf serum (FCS; Sigma, USA), penicillin and streptomycin (Penn/Strep, Gibco), glutamax (Gibco), 8 U/ml heparin (LEO Pharma AS), and 20 ng/ml basic epidermal cell growth factor (bECGF, Roche). Culture medium was changed twice a week, and cells were subcultured when they reached 60% confluency.
Primary human adipose tissue-derived mesenchymal stem cells (ASCs, donated by Philippe Collas) were isolated from healthy liposuction bioassays (37) and maintained in DMEM-F12 (Gibco) supplemented with 20% FCS, Penn/Strep, and Glutamax (Gibco). Culture medium was changed twice a week, and cells were subcultured when they reached 60% confluency. Ethical approval to use these cells in vitro and in in vivo animal experiments was obtained from the Norwegian National Committee for Medical Research Ethics (reference number S-06387a).
Presumptive human adult neural stem cells (ad-NSCs, donated by Wayne Murrell, Oslo University Hospital) were from temporal lobe ventricular wall biopsies obtained from informed and consenting patients undergoing neuro-surgery for medically refractory epilepsy, and approval for use in vitro and in in vivo animal experiments was obtained from the Norwegian National Committee for Medical Research Ethics (reference number 07321b). Briefly, tissue was mechanically dissociated and placed in medium containing 13.2 U/ml of papain (Sigma, St. Louis, MO). After 5 min, 200 U/ml of DNAse (Sigma) was added, and the suspension was passed through a 70-μm strainer (BD Biosciences, San Jose, CA) and resuspended as single cells in a proprietary medium that will be published elsewhere (W.M. Murrell et al., unpublished data). Cells were cultured adherently at 37°C in 6% CO2 and 20% O2. Although a full characterization of these cells has not yet been published, they are viable over many passages in culture (W. Murrell, personal communication) and presumably include bona fide adult neural stem cells.
Human fetal neural progenitor cells (f-NPCs) were from the v-myc-immortalized ReNcell VM cell line (Chemicon) and maintained in maintenance medium (Chemicon) supplemented with 20 ng/ml fibroblast growth factor-2 (FGF2) and epidermal growth factor (EGF; Chemicon) in culture flasks precoated with 20 μg/ml laminin (Sigma). Medium was changed every other day, and cells were detached by adding 3 ml accutase (Chemicon) for 2 min and subcultured when they reached 80% confluency.
U87 glioma cells were obtained from ATCC and maintained in DMEM/F12 (Invitrogen, USA) supplemented with 10% FCS (PAA Laboratories, Fisher Scientific, Norway) or DMEM supplemented with 10% fetal bovine serum (FBS; Sigma, USA) and Penn/Strep (Medprobe, Norway or Lonza, Switzerland).
Primary human glioblastoma tumor stem cells (GSCs) were obtained from tumor biopsy specimens from informed and consenting glioblastoma patients, and approval for use in vitro and in vivo animal experiments was obtained from the Norwegian National Committee for Medical Research Ethics (reference number 07321b) (38,39). Briefly, tissue samples were washed in Leibowitz-15 medium (L-15, Invitrogen) and digested with Trypsin-EDTA (Invitrogen) and mechanically dissociated. Trypsin treatment was blocked by adding 2 mg/ml human albumin (Octapharma Pharmazeutika Produktiones, Austria), and the cells were washed twice in L-15 medium, resuspended as fully dissociated cells and suspension cultured (s-GSCs) in proliferation medium containing 10 ng/ml FGF2, 20 ng/ml EGF (both R&D Systems, Minneapolis, MN, USA), 10 ng/ml leukemia inhibitory factor (Millipore, Billerica, MA), B27-supplement 1:50 (Invitrogen), Penn/Strep (Lonza, Basel, Switzerland), 1 ng/ml heparin (Leo Pharma, Ballerup, Denmark), and 8 mM HEPES (Lonza) in DMEM-F12 (Invitrogen). Cells were cultured at a density of 105 cells/ml in 75-cm2 nontreated cell culturing flasks (Nunc, Roskilde, Denmark). For adherent cultures (a-GSCs), cells were placed in plastic flasks coated with poly-l-ornithine (15 μg/ml; Sigma-Aldrich) in DMEM/F12 containing 4% FCS (PAA Laboratories, Ontario, Canada), HEPES, Penn/Strep, and B27 supplement with retinoic acid at 1:2,000 dilution (Invitrogen).
Lentiviral Transduction
Transfection of 293FT cells (Invitrogen) with emerald green fluorescent protein (EmGFP) construct (Vivid Colors™ pLenti6.3/V5-GW/EmGFP Expression Control Vector, Invitrogen, cat. no. V370-06) using Lipofectamine 2000 solution (Invitrogen) was performed according to the ViraPower Lentiviral Expression manual (Invitrogen). Virus was harvested, concentrated, and stored at −80°C. For transduction, 10 μl concentrated virus was added to 5 × 10⁴ cells/well in 24-well plates, and the cells were incubated for 48 h at 37°C and 5% CO2.
MPIO Labeling Optimization and Parameters
Polystyrene-coated MPIOs of 0.9 μm diameter (containing 48.5 pg magnetite per MPIO) and 2.84 μm diameter (containing 17 ng magnetite per MPIO), labeled with Flash Red dye entrapped in the polystyrene matrix, were obtained from Bangs Laboratories (Fisher, IN, USA; product numbers UMC3F/7482 and MC05F/8298). Labeling was performed initially at a range of MPIO concentrations (dilutions of stock from 1/500 to 1/8,000) and was optimized through dose–effect and time–effect experiments. Dose–effect was assessed and quantified by incubating 105 cells for 24 h with increasing MPIO concentrations (dilutions of stock from 1/4,000 to 1/500) in 800 μl total volume. At the 1/500 dilution, cells were exposed to 1.2 million 2.84-μm MPIOs or 12 MPIOs/cell, and 20.4 million 0.9-μm MPIOs or 204 MPIOs/cell. Time–effect was assessed by incubating 105 cells with 1/500 MPIOs in 800 μl for 3–24 h. In subsequent experiments, when cells reached 90% confluency, 106 cells were incubated with 1/500 MPIOs for 24 h. The medium was then removed, and the cells were washed with PBS three times for 5 min to partly remove excess free and surface-attached MPIOs. In separate cultures, several confocal z-stacks were acquired from different areas of the culture, and the percentage of labeled cells and number of MPIOs per cell were determined. Means and standard deviations were calculated from three or more separate cultures.
Proliferation Rate
Proliferation rate was determined with the Clik-it™ EdU Alexa Fluor® imaging kit (Invitrogen). Cells were incubated with 10 μM of EdU (5-ethynyl-2′-deoxyuri dine) for 5–15 h depending on the cell type. Medium was removed, and cells were fixed with 4% (w/v) paraformaldehyde (PFA) in 0.1 M phosphate-buffered saline (PBS, pH 7.4) for 30 min to 1 h, then washed twice with 3% (w/v) bovine serum albumin (BSA) in PBS, and permeabilized with 0.5% (v/v) Triton X-100 in PBS with 3% BSA for 20 min at room temperature (RT). Detection of EdU was then performed according to kit instructions, and the cells were mounted under coverslips with ProLong Gold Antifade containing DAPI. Counts of DAPI+ and EdU+ nuclei were performed on low-magnification digital fluorescent images in ImageJ (22) using an automatic counting script that split the fluorescent channels, generated a 2-bit threshold, and engaged the “particle counter” option. Typically 103–104 nuclei could be counted in 8–12 images. Proliferation rate was expressed as the ratio of EdU+ nuclei to DAPI+ nuclei.
Mitotic Duration
Time-lapse microscopy using phase contrast on a Cell^R microscope (Olympus Europa, Hamburg, Germany) was used to measure the time between metaphase and cytokinesis, with temporal resolution of 1 frame per 45–70 s depending on cell type.
Random Motility
Time-lapse microscopy using phase contrast over 18–24 h with temporal resolution of 1 frame per 140 s was used to assess the random motility of MPIO-labeled cells. Image sequences were opened in ImageJ, and the XY coordinates of selected cells were tracked using the “Manual Tracking” plug-in (5). Average random motility was calculated as total distance covered divided by elapsed time.
Immunohistochemistry
Cell monolayers on coverslips or tissue sections were fixed and permeabilized as described under “Proliferation rate” except that 10% goat or donkey serum (Gibco) replaced BSA. Fluorescence immunocytochemistry was performed using conventional techniques. Primary antibodies were mouse monoclonal anti-collagen type II (Developmental Studies Hybridoma Bank II-II6B3, 1:100 dilution), mouse monoclonal anti-β-tubulin III (Chemicon, 1:100 dilution), mouse monoclonal anti-nestin (Chemicon, 1:100 dilution), mouse monoclonal anti-tyrosine hydroxylase (TH; Sigma, 1:100 dilution), and biotinylated mouse monoclonal anti-(sex-determining region Y)-box 2 (SOX2; R&D System, 1:100 dilution). Secondary antibodies/ligands were Cy2-conjugated goat anti-mouse IgG (Sigma), Alexa Fluor 488-conjugated goat anti-mouse IgG (Sigma), and Cy2-conjugated streptavidine (Sigma). Cells and sections were counterstained with DAPI and mounted in Vectashield (Invitrogen). Negative controls omitted the primary antibodies.
Fluorescence Microscopy
Fluorescence was visualized with an Axioplan 2 microscope equipped with a Fluoroarc Hg lamp and an RGB Axiocam camera or a 510 Meta laser scanning confocal microscope (both Carl Zeiss, Jena, Germany), using excitation wavelengths of 405 nm (DAPI), 488 (EmGFP), and 561 nm or 633 nm (MPIOs). Flash Red has a reported excitation wavelength of 660 nm, but we observed substantial excitation cross-talk at 561 nm, which can confound multifluorescence microscopy. The emission spectrum after excitation at 561 nm was nearly identical to the emission spectrum after excitation at 630 nm, with a peak at 680 nm (data not shown). Confocal images were generally taken as z-stacks of 0.7–0.9 μm optical sections, 3D rendered using Amira 3.0 TGS software (Mercury, Chelmsford, MA). Cell volumes were measured using ImageJ with the Volumest plug-in (18,26).
Cell Differentiation Assays
Adipocyte
Differentiation of MSCs to adipocytes was induced by adding 50 μM indomethacin (Sigma), 1 μM dexamethason (Sigma), and 0.5 mM isobutyl-methylxanthine (Sigma) to the medium for 3 weeks (medium replenishment twice a week). Parallel control cultures received medium without these drugs. Oil Red O (ORO) staining (9) was then performed to assess increase in fat droplet lipid content. Half of the samples were mounted for morphological analysis by microscopy, and the cell lipid contents of the other half were extracted with 300 μl 96% ethanol and transferred to separate wells of a 96-well plate for densitometry at OD 490 nm. Lipid content was obtained from a calibration curve of ORO. To determine if the differentiation drugs had any toxic effects on the cells, sulforhodamine B (SRB) staining was performed to assay protein content. After ORO staining, 500 μl 10% trichloroacetic acid (TCA) was added to each well, and the cells were incubated for 1 h at 4°C. The cells were washed gently with water, briefly air dried, and then 300 μl 0.4% sulforhodamine B (Sigma) was added for 15 min at RT. The cells were then washed gently but extensively with 1% acetic acid. After drying, protein was extracted by agitation in 300 μl 10 mM Tris, and absorbance was measured at OD 540 nm. Lipid contents were then normalized to protein content.
Osteocyte
Differentiation of MSCs to osteocytes was induced by adding 0.2 mM ascorbic acid (Sigma), 1 μM dexamethason (Sigma), and 10 mM glycerol-2-phosphate (Sigma) to the medium for 3 weeks (medium replenished twice a week). Parallel control cultures received medium without these additives. Alizarin red S staining (9) was then performed to assess calcium deposition. Cellular calcium content was released by 10-min incubation with 100 mM cetylpyridinium chloride and the calcium-bound Alizarin red S measured by densitometry at OD 595 nm, quantified from a standard curve of known concentrations, and normalized to mg/ml total protein of the cell lysate.
Chondrocyte
Differentiation of MSCs to chondrocytes was induced by culturing cells in serum-free DMEM medium supplemented with 10 ng/ml transforming growth factor (TGF)-β2 (R&D Systems, UK), 25 μg/ml l-ascorbic acid 2-phosphate (Sigma), 100 mM sodium pyruvate (Sigma), 40 μg/ml proline (Sigma), and 1:100 ITS + 1 [1.0 mg/ml bovine pancreas insulin, 0.55 mg/ml human transferrin (substantially iron-free), 0.5 μg/ml sodium selenite, 50 mg/ml bovine serum albumin, and 470 μg/ml linoleic acid; Sigma] for 2 weeks (medium replenished twice a week). Parallel control cultures received medium with serum and without these additives. Cell monolayers (on glass coverslips) were then processed for immunohistochemistry for collagen type II.
Neuron
Differentiation of ReNcell VM cells to neurons was induced by seeding 30,000 cells per 12-mm well (24-well plate) containing laminin-precoated glass coverslips and incubating in maintenance medium without FGF2 or EGF for 2 weeks (medium replenishment every 2 days) (8). Differentiation was assessed by morphology and immunohistochemistry for β-tubulin III, nestin, tyrosine hydroxylase, and SOX2. Cells for electrophysiological studies were differentiated by the preaggregration differentiation method (8) with the addition of glial-derived neurotrophic factor (GDNF; Sigma) and dibutyrl cAMP (Sigma) and electrophysiological characterization was made using conventional patch clamp recording techniques (see below).
Electrophysiology
For electrophysiological studies, differentiated ReNcell VM cells were plated on circular coverslips and placed in a recording chamber perfused continuously with artificial cerebrospinal fluid (aCSF) containing in mM: NaCl 128, KCl 3, d-glucose 11, CaCl2 2.5, MgSO4 1, NaH2PO4 1, HEPES 5, and NaHCO3 25. Cells were visualized using a 40x (NA 0.8) water immersion objective and recorded under the direct visual guidance of infrared differential interference contrast video microscopy. Recording electrodes made from borosilicate capillaries (Harvard Apparatus, UK) had tip resistances of 5–8 MΩ when filled with a solution containing (mM): potassium gluconate 135, KCl 20, MgATP 2, Na2ATP 2, GTP 0.3, Hepes 10, MgCl2 2, EGTA 1, and Na2-phosphocreatine 10 at pH 7.3. The fluorescent dye Alexa Fluor 594 hydrazide (50 μM; Molecular Probes) was added to the pipette solution to visualize the cell under recording. Following gigaohm seals and electrode capacitance compensation, whole-cell recordings were made. Responses were amplified and filtered at 5 kHz using a Multiclamp 700B amplifier and digitized at 10 kHz with a Digidata 1440 analog-to-digital converter (Molecular Devices, USA). Data were stored on a personal computer using Clampex 10 data acquisition program (Molecular Devices). Membrane potentials were not corrected for the liquid junction potential between the aCSF and patch-pipette solution.
Fluorescence-Activated Cell Sorting and Flow Cytometry
For injection into animals 2.84-μm MPIO-labeled f-NPCs and GSCs were centrifuged and resuspended in PBS containing 2% FCS and 8 mM HEPES buffer (Lonza, Basel, Switzerland). Cells were sorted and analyzed using a FACSAria flow cytometer (Becton-Dickinson, San Jose, CA) at 488 nm excitation with a 500–530 nm emission filter for GFP and at 633 nm excitation with a 680-nm emission filter for MPIOs. Live cells were gated by using forward and side scatter. Sorting was done using a 100-μm nozzle and a sheath fluid pressure of 20 psi. Sorted cells were pelleted, resuspended in cold PBS, and kept on ice until injection. Sorting increased the proportions of MPIO-labeled f-NPCs and GSCs from about 20% and 2% to about 90% and 40%, respectively.
Injection of Cells or Free MPIOs Into Chicken Embryos and SCID Mice
All animal procedures were approved by the National Animal Research Authority (Approval 1094/2008). Chicken embryos were obtained from Samvirke Kylling (Våler I Solør, Norway). Cell injections into the peritoneum, brain vesicle, and lesioned spinal neural tube of stage 14–17 embryos were performed as described previously (1). CB-17 severe combined immunodeficient (SCID) mice (7–9 weeks old) were obtained from Taconic (Ejby, Denmark). Mice were anesthetized with a subcutaneous injection of Hypnorm (10 mg/ml fluanisone and 0.315 mg/ml fentanyl citrate; Veta Pharma, Leeds, UK) and Dormicum (5 mg/ml midazolam; Roche, Basel, Switzerland) and placed in a stereotactic frame (David Kopf Instruments, Tujunga, CA). Depending on cell type and MPIO-labeling efficiency, 105 or 2 × 1 0 5 cells suspended in 2 μl PBS were injected either subcutaneously in the dorsum of the neck or into the right striatum just below the corpus callosum (coordinates AP 0 mm, RL 2 mm, and DV 2 mm from bregma) using a cannula (Plastic One, Roanoke, VA) attached to a Hamilton syringe (Hamilton Bonaduz, Bonaduz, Switzerland). The needle was left in situ for 2 min postinjection before being slowly retracted.
Magnetic Resonance Imaging
Mice were anesthetized either with subcutaneous injection of Hypnorm/Dormicum (see above) or with isofluorane vapor (Baxter, Deerfield, IL, USA). Internal temperature and respiration rate were monitored during MRI scanning. A 7-T Bruker Biospec MRI system (Bruker Biospin, Ettlingen, Germany) was used to obtain T2*-weighted multigradient echo image sequences with TR (repetition time) = 900 ms, TE (echo time) = 6 ms, and a flip angle of 30°. In preliminary experiments using successive dilutions in gelatin phantoms, we were able to detect as few as three hundred 0.9-μm MPIOs and four 2.84-μm MPIOs For MRI of the neck, field of view (FOV) was 2.2 × 1.65 cm2, with 220 × 165 pixel matrix and 100 × 100 μm2 resolution, 0.7 mm slice thickness (20 slices), number of excitations (NEX) = 8, and 18 min total acquisition time. For MRI of the brain, frontal sections were obtained with FOV 1.8 × 1.4 cm2, 256 × 200 pixel matrix, and 70 × 70 μm2 resolution, 0.5-mm slice thickness (26 slices), NEX = 18 and 54 min total acquisition time. For each tissue, identical MRI para meters were used for all animals at all time points. Mice were imaged several times starting at 2 weeks after cell injection and at weekly or longer intervals thereafter ending at 9 weeks postinjection.
Postmortem Tissue Processing
Two to four days following cell injection, chicken embryos were dissected free from the egg and anesthetized as described previously and fixed in 4% (w/v) PFA in 0.1 M PBS (pH 7.4) for 30 min to 1 h. Two to ten weeks following cell injection, depending on cell type and the development of neurological symptoms, mice were anesthetized as described above and killed by transcardial perfusion with the same fixative. Relevant tissues were isolated and postfixed overnight with the same fixative, cryoprotected, and cryostat-sectioned at 30–50 μm.
Statistics
Statistical testing of differences in averages was performed using either two-way ANOVA with Bonferroni correction (when data characteristics permitted) or by a randomization test (19) when sample sizes were too small to permit conventional parametric or nonparametric tests. The randomization test involves no underlying assumption about the distribution of data points. It uses a random resampling of merged group data points to generate all possible permutations of grouped data points, each of which is then averaged and the averages were ranked. The percentile rank corresponding to the observed average defines the p value.
Results
MPIO Uptake
Upon coincubation of cells with MPIOs, MPIO uptake occurred spontaneously and rapidly. Uptake appeared to be by an endocytotic mechanism and some cell types, particularly MSCs and ASCs, performed this with impressive avidity (see Supplementary Videos 1 and 2; http://www.med.uio.no/imb/english/research/groups/neural-development/videos/boulland-2011-celltrans/). The intracellular location of MPIOs was confirmed by confocal microscopy in all cell types; MPIOs could be located throughout the cell soma but often had a perinuclear propensity (Fig. 1A–H) and could also be found in the proximal portions of neurites.
Characterization of MPIO labeling of different stem and progenitor cell types. (A–H) Confocal images of MPIO-labeled cells in vitro. (A) 3-D rendering of a single ad-NSC containing six 2.84-μm MPIOs. (B–H) Confocal z-axis image stacks on which red and green transects intersect abutting x-axis and y-axis views to demonstrate the intracellular location of specific MPIOs. Scale bars: 6 μm. (I) Labeling efficiency (percentage of MPIO-labeled cells) as a function of cell type for the two MPIO sizes. (J) Uptake efficiency (number of 2.84-μm MPIOs per cell) has a direct, linear relationship to cell volume. The inset at upper left is a higher scale view of the data points for the three cell types with lowest uptake efficiency. (K) Pie diagrams showing the proportions of cells with different ranges of uptake efficiency for 2.84-μm MPIOs. Note that only a minor fraction of f-NPCs and GSCs becomes labeled with the labeling parameters used, and these never contain more than five MPIOs per cell, whereas nearly all ASCs become labeled and more than a third of these contain more than 20 MPIOs per cell. Error bars: SD.
In general, the percentage of labeled cells (“labeling efficiency”) for any given cell type was similar for labeling with 0.9-μm or 2.84-μm MPIOs, although cell types at the low end of the spectrum had distinctly poorer labeling with 2.84-μm than with 0.9-μm MPIOs. Labeling efficiency thus ranged from 17% and 55%, respectively, for 2.84-μm and 0.9-μm MPIOs in f-NPCs, to nearly 100% for both MPIO sizes in ad-NSCs (Fig. 1I). Like f-NPCs, sphere-forming GSCs (s-GSCs) were labeled at low efficiency, and we tested whether this might be because they were grown in floating cultures, where the probability of MPIO contact is diminished. However, when the culture conditions were changed to promote the growth of adherent GSCs (a-GSCs), MPIO labeling efficiency did not improve. Thus, MPIO labeling efficiency is clearly dependent on cell type and relatively independent of dose, time, and culture conditions.
The mean number of MPIOs per labeled cell (“uptake efficiency”) (Fig. 1J) and the distribution of MPIO number per cell (Fig. 1K) could only be determined accurately for 2.84-μm MPIOs, since individual 0.9-μm MPIOs were difficult to discriminate for counting by light microscopy (compare Fig. 1B and F). The mean number of MPIOs per labeled cell varied greatly among the different cell types tested (compare Fig. 1D and E) and was linearly related to cell volume (Fig. 1J). ASCs had remarkably high uptake efficiency, with individual cells often containing 50–100 2.84-μm MPIOs (the highest number observed was 256 2.84-μm MPIOs in a single ASC). To some extent, high uptake efficiency correlated with high labeling efficiency, since cell types with higher labeling efficiency (ASCs, ad-NSCs, MSCs, U87) outranked those with lower labeling efficiency (f-NPCs, s-GSCs, a-GSCs) in average MPIO content.
Dose– and time–response experiments designed to optimize uptake conditions showed that for both 0.9-μm and 2.84-μm MPIOs, the percentage of labeled cells remained nearly unchanged, whereas the number of MPIOs per cell varied directly with both dose and time (Fig. 2). As coincubation of cells with MPIOs at 1/500 for 24 h gave the best labeling, these parameters were used throughout the rest of the study.
Optimizing MPIO labeling: Dose–effect and time–effect. Confocal microscopy of ad-NSCs incubated with 2.84-μm MPIOs at 1/500 or 1/8,000 stock dilutions (A and B, respectively) illustrates the dependency of labeling efficiency and uptake efficiency on MPIO concentration. Labeling efficiency in both ad-NSCs and U87 cells increases markedly with the concentration of 2.84-μm MPIOs but is less concentration-dependent for 0.9-μm MPIOs (C). Uptake efficiency (number of MPIOs per cell) shows even greater dependence on MPIO concentration (D). Confocal microscopy of U87 cells incubated with 0.9-μm MPIOs for 3 h (E) or 24 h (F) illustrates the dependency of labeling efficiency and uptake efficiency on incubation time. Labeling efficiency in ad-NSCs and U87 cells was relatively independent of incubation time (G). Uptake efficiency was highly dependent on incubation time in U87 cells but was relatively independent of incubation time in ad-NSCs (H). Scale bars: 24 μm.
MPIO Labeling Causes Minimal or No Interference with Normal Cell Behavior and Differentiation In Vitro
To determine whether the presence of significant numbers of MPIOs in the cytoplasm has any deleterious effects on cell behavior and differentiation, we first assessed cell proliferation rate, mitotic duration, and random motility in all cell types except ad-NSCs and GSCs and differentiation to specific phenotypes in MSCs, ASCs, and f-NPCs, in vitro. In all cases, the results were obtained from at least three independent experiments in which experimental parameters were essentially identical. Proliferation rate as assessed by incorporation into DNA of the thymidine analog EdU was statistically indistinguishable in MPIO-labeled and unlabeled cells, for both MPIO sizes (Fig. 3A, B). To further examine the effects on cell proliferation, the duration of mitosis (more specifically the time between the easily recognized metaphase and full-blown cytokinesis) was measured in time-lapse video films at relatively high temporal resolution (1 image per 45–70 s) after labeling with 2.84-μm MPIOs (Fig. 3C; see also Supplementary Video 3; http://www.med.uio.no/imb/english/research/groups/neural-development/videos/boulland-2011-celltrans/). Essentially no difference was seen between MPIO-labeled and unlabeled cells (Fig. 3D). During mitosis the MPIOs were clearly associated with microtubules, as they often aligned in parallel rows together with the chromosomes and typically as a consequence became equally distributed between the two daughter cells (Supplementary Video 3; http://www.med.uio.no/imb/english/research/groups/neural-development/videos/boulland-2011-celltrans/).
Minimal effects of MPIO labeling on proliferation, mitosis, and random motility in vitro. (A) EdU labeling (green) and DAPI nuclear staining (blue) to assess proliferation. (A1) MPIO-labeled U87 cells, some of which have EdU+ nuclei (green + blue, arrowhead; arrow shows EdU-negative nucleus). (A2 and A3) unlabeled and 2.84-μm MPIO-labeled ASCs, respectively, with similar proportions of EdU+ nuclei (green + blue, arrowhead; arrow shows EdU-negative nucleus). (A4) Control ASC culture without EdU exposure. (B) Proliferation rates of 2.84-μm and 0.9-μm MPIO-labeled and unlabeled cells are similar. Comparison of proliferation rate (ratio of EdU-labeled/ unlabeled nuclei) in MPIO-labeled cells normalized to unlabeled cells (horizontal line at unity). (C) Video frames showing the progress of mitosis in a 2.84-μm MPIO-labeled U87 cell. Metaphase is at 0 s. Note that during mitosis the MPIOs become distributed between the two daughter cells. (D) Duration of mitosis is unaffected by MPIO labeling. Ratio of mitotic duration (from metaphase to cytokinesis) in 2.84-μm MPIO-labeled versus unlabeled cells is unity (horizontal line). (E) Cell tracking to determine random motility. Each color-coded track shows the movement trajectory of a single unlabeled (E1) or 2.84-μm MPIO-labeled (E2) MSC over the course of approximately 7 h. (F) Velocities (trajectory distance/elapsed time) are the same (horizontal line at unity) in MPIO-labeled versus unlabeled cells except for MSCs. Error bars: SD. Scale bars: 12 μm.
The apparent ease with which cells underwent mitosis while engorged with multiple 2.84-μm MPIOs prompted us to test whether cell movements in general are affected by MPIO labeling. To this end, time-lapse video cell tracking was performed for durations of about 20 h. Cells labeled with 2.84-μm MPIOs seemed just as active and agile as unlabeled cells, undergoing morphometric transformations and directional changes that appeared quite normal (Fig. 3E; see Supplementary Video 4; http://www.med.uio.no/imb/english/research/groups/neural-development/videos/boulland-2011-celltrans/). Quantitation of average random motility over the entire recording duration showed that the overall propensity for movement was essentially the same in MPIO-labeled and unlabeled cells except for MSCs, which were slowed by about 25% when MPIO-labeled (Fig. 3F).
MPIO-labeled MSCs cultured under conditions that promote differentiation to adipocytes, osteocytes, or chondrocytes differentiated to the same extent as unlabeled cells (Fig. 4A–P), as seen both by direct observation of differentiated MPIO-labeled cells (Fig. 4A–M) and by quantitative assays (Fig. 4N, O). The only exception involved adipocytic differentiation by MSCs labeled with 0.9-μm MPIOs. In this case, differentiation clearly occurred as assessed by direct observation (Fig. 4F), but the percentage of increase in lipid content was not statistically significant (Fig. 4N), due to high background staining in the paired undifferentiated cultures. We also noted that the percentage of MPIO-labeled cells fell during the several weeks of culture required for differentiation, both with and without differentiation conditions (Fig. 4P), indicating some loss of MPIOs over time despite a cessation of proliferation.
MPIO labeling does not affect differentiation of MSCs to connective tissue phenotypes in vitro. Adipogenic, chondrogenic, or osteogenic differentiation by unlabeled MSCs (A, D, G, J, L) and MSCs labeled with 2.84-μm MPIOs (B, E, H, K, M) or 0.9-μm MPIOs (C, F, I). Undifferentiated control MSCs (A, B, C, J, K) compared to MSCs differentiated to adipocytes as shown by Oil Red O stained lipid droplets (arrows, D, E, F) to osteocytes as shown by Alizarin staining of calcium deposits (reddish orange color, G, H, I) and to chondrocytes as shown by immunostaining for collagen type II (green, L, M). In control chondrogenic cultures (J, K), no collagen type II immunostaining is detectable even when the fluorescence intensity is increased (background fluorescence higher). Scale bars: 50 μm. The histological staining is red and can obscure the MPIOs, so arrows indicate examples of stained structures and arrowheads indicate examples of MPIO-labeled cells. (N, O) Densitometric quantification of adipogenic and osteogenic differentiation. (N) Percent changes in lipid content/protein content exhibited by unlabeled cells (18%) and MPIO-labeled cells (24% and 5%) upon differentiation are not significantly different (randomization test, p > 0.25 for 2.84-μm MPIO-labeled versus unlabeled, p > 0.8 for 0.9-μm MPIO-labeled versus unlabeled, n = 3). Note that the sensitivity of the Oil Red O densitometric assay is low due to high background labeling in undifferentiated cells. The relatively low percent change for 0.9-μm MPIO-labeled cells was due to a particularly high background level in the undifferentiated cells. (O) Percent changes in calcium deposition/protein content for MPIO-labeled cells and unlabeled cells upon differentiation (about 50% in each case) are not significantly different (randomization test, p > 0.5 for each MPIO size versus unlabeled, n = 3). (P) Percentage of MSCs labeled with 2.84-μm MPIOs decreases after several weeks of culture, with or without differentiation, relative to initial labeling efficiency at 24 h (left column, “MSC”). Statistical significance at p < 0.01 (**) determined with randomization test and two-way ANOVA with Bonferroni correction. Error bars: SD.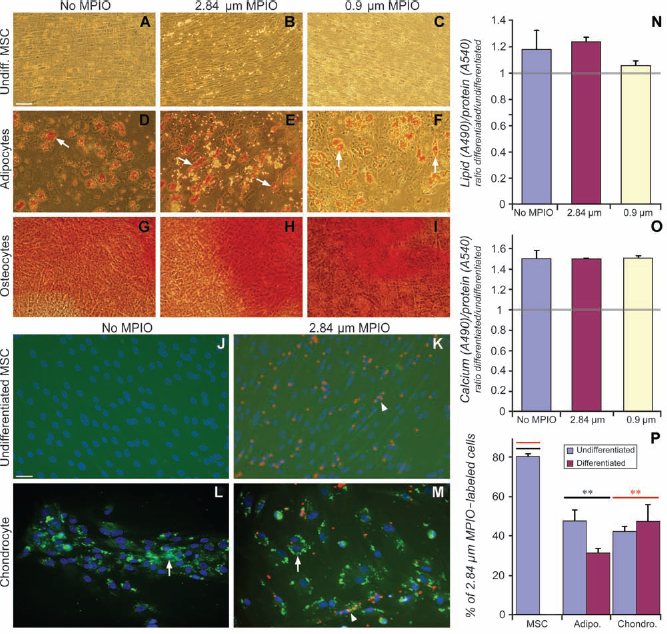
Differentiation of f-NPCs to nestin-, β-tubulin III- or TH-expressing neurons (the markers were assessed separately) occurred to the same extent in MPIO-labeled as in unlabeled cells. Under both conditions, virtually all neurons expressed β-tubulin III and TH following differentiation, and we found no MPIO-labeled neurons that did not express these markers. Moreover, under both conditions, the stemness protein Sox2 was downregulated as a consequence of differentiation (Fig. 5A–J). MPIO-labeled and unlabeled f-NPC-derived neurons both had well-developed neurites (Fig. 5H–K) and similar basic electrogenic properties (membrane potential, input resistance and voltage-dependent potassium current) (Fig. 5L–M).
In vitro neuronal differentiation of MPIO-labeled fetal neural progenitor cells. (A–J) Comparison of morphology and expression of stemness and neuronal proteins by undifferentiated (A–E) and differentiated (F–J) f-NPCs. Cell nuclei counterstained with DAPI. Prior to differentiation, f-NPCs have a fibroblast-like morphology (A), high expression of Sox2 (B, green, arrow), moderate expression of nestin (C, green, arrow), but low expression of β-III-tubulin (D, red) and tyrosine hydroxylase (TH; E, green). After 14 days in differentiation medium, f-NPCs have small, round, phase-bright cell bodies and long neurites (F), virtually no expression of Sox2 (G), moderate expression of nestin (H, green), and high expression of β-III-tubulin (I, red, arrows) and tyrosine hydroxylase (J, green, arrows). Only about 20% of f-NPCs are MPIO-labeled (arrows), and of these virtually all express β-III-tubulin and TH after differentiation. Scale bar: 50 μm. (K–N) Electrophysiological characterization of 2.84-μm MPIO-labeled f-NPCs after differentiation to neurons. (K) Single 2.84-μm MPIO-labeled neuron (arrow) that has been patch-clamped under direct visual guidance using infrared differential interference contrast video microscopy and a 40x (NA 0.8) water immersion objective (left) and then filled with the fluorescent dye Alexa Fluor 594 hydrazide to visualize cell morphology (right). Scale bar: 9 μm. (L) Measurement of input resistances and resting membrane potentials in 2.84-μm MPIO-labeled and unlabeled neurons shows similar distributions. (M) Demonstration of electrogenic IA K+ current in 2.84-μm MPIO-labeled neurons. A double protocol was used to isolate the IA current. First, from a holding voltage of −65 mV, a 1-s hyperpolarizing prepulse to −100 mV was delivered to remove inactivation of the IA conductance and was immediately followed by 500-ms depolarizing pulses in 15 mV increments to activate it (as well as other conductances). Second, the same protocol was followed but with a prepulse to −30 mV to completely inactivate the IA conductance. Offline subtraction of the current responses from the two protocols yielded the IA current in isolation, which is shown in the form of traces (top) and in current–voltage plot (bottom).
MPIO-Labeled Cells Survive, Integrate Into Tissues, and Migrate In Vivo
To follow the fate of MPIO-labeled cells in vivo, we first injected MPIO-labeled EmGFP+ cells into one of three different sites in chicken embryos (abdominal cavity, brain vesicle, and spinal neural tube). Postmortem analysis showed that MPIO-labeled cells could survive and integrate into the various host tissues targeted. Thus, MPIO-labeled ASCs integrated into abdominal organs and brain tissue and adopted complex morphologies after intraperitoneal or intracerebral injection (Fig. 6A–D), and MPIO-labeled f-NPCs and ad-NSCs integrated into the developing spinal cord of chicken embryos and the f-NPCs extended neurites thereafter (Fig. 6E–H).
In vivo fate of MPIO-labeled stem and progenitor cells transplanted into chicken embryos. Different types of cells stably transduced with GFP and labeled with 2.84-μm or 0.9-μm MPIOs were transplanted into stage 14–17 chicken embryos. (A–D) ASCs labeled with 0.9-μm MPIOs. Postmortem confocal microscopy performed 2 days after intraperitoneal (A and B) or 4 days after intracerebral transplantation (C and D) shows that the cells have integrated into host tissues and developed complex morphologies. Dotted lines in (A) demarcate the nephrous tubules. (B) Close-up of the rectangular field indicated in (A), within fatty tissue (Ft). (C) Arrow indicates cells that have integrated into the telencephalon, shown at higher magnification in (D). Lv is the lateral ventricle. (E–H) Neural stem or progenitor cells labeled with 2.84-μm MPIOs and injected into a lesion in the spinal neural tube. One to two days later, both f-NPCs (E and F) and ad-NSCs (G and H) have integrated into the regenerating spinal cord (outlined with white dotted line; DH, dorsal horn; VH, ventral horn) and the f-NPCs have begun to develop neurites (E). Red and green transects in the confocal z-stacks of (B), (D), (F), and (H) intersect abutting x-axis and y-axis views to demonstrate the intracellular location of MPIOs. Scale bars: 90 μm (A, C, E, G) and 9 μm (B, D, F, H).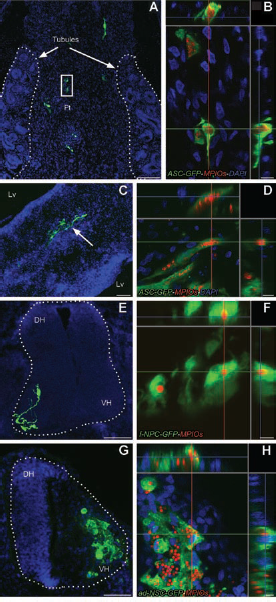
To assess cell fate and track the cells in vivo over longer periods of time using MRI, we injected MPIO-labeled EmGFP+ cells into either subcutaneous fat or the brain of SCID mice. ASCs labeled with 2.84-μm MPIOs and injected subcutaneously into the dorsum of the neck could be seen as an obvious T2* signal drop in adipose tissue three weeks after transplantation (Fig. 7A2), whereas no T2* signal drop was observed in uninjected control mice (Fig. 7A1). Confocal microscopy on postmortem tissue sections revealed large numbers of MPIO-labeled EmGFP+ cells at the location of the T2* signal drop (Fig. 7B, C).
In vivo MRI imaging of MPIO-labeled ASCs transplanted into SCID mouse cervical fat pads. (A1) Noninjected control mouse. (A2) Injected mouse. (A1, A 2) Frontal T2*-weighted MRI scans (TE=6 ms) of the cervical region showing signal drop (between arrows) in the cervical fat pad injected with 2.84-μm MPIO-labeled ASCs 3 weeks earlier. (B) Postmortem view of the fat pad containing numerous GFP-positive ASCs. The inset shows the presence of GFP-positive cells in the back of the neck during the dissection. (C) Close-up with red and green transects in the confocal z-stack that intersect the abutting x-axis and y-axis views to demonstrate the intracellular location of MPIOs. Oc, occipital cerebral cortex; Ic, Inferior colliculus; Cb, cerebellum; Pn, pontine nuclei; Mo, medulla oblongata. Scale bars: 29 μm (B) and 6 μm (C).
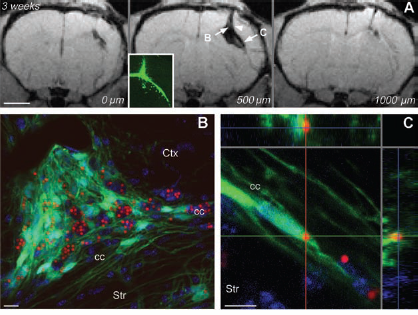
To assess more specifically cell migration in vivo we injected 2.84-μm MPIO-labeled EmGFP+ f-NPCs or GSCs, which are typically motile and invasive, into the brains of SCID mice. Since both cell types have low labeling efficiency, we sorted them by flow cytometry just before injection to enrich the population of MPIO-labeled cells and remove free MPIOs as much as possible. We then injected 2 × 1 0 5 MPIO-labeled cells or MPIOs alone or PBS alone as controls. T2*-weighted scans were made several times between 2 and 9 weeks postinjection. Scans from mice injected with PBS or MPIOs alone showed a single local signal intensity drop in the T2* weighted MR images restricted to the injection site (Fig. 8). Postmortem analysis suggested that the signal drop in PBS control animals was due to a combination of local hematoma, edema, and necrotic debris. In contrast, scans from mice injected with MPIO-labeled cells showed several spots and regions of signal intensity drop in the T2* weighted MR images that extended through several rostrocaudal slices and to the contralateral side of the brain (Figs. 9 and 10), reminiscent of the migratory infiltration that is a characteristic of glioblastoma cells and of the migratory behavior documented for neural progenitors. Confocal microscopy on postmortem tissue sections revealed EmGFP+ MPIO-labeled cells at all sites where signal intensity drop in the T2* weighted MR images was observed (Figs. 9B–D and 10B, C). Thus, MPIO-labeled cells injected into the brain survived, changed their location over time, and could be tracked with MRI for as long as 7 weeks (GSCs) or 9 weeks (f-NPCs) thereafter. We also observed EmGFP+ MPIO-unlabeled GSCs postmortem. Since GSCs take up on average only 1.5 MPIOs per cell and are highly proliferative, they could easily lose MPIO labeling simply by dividing once or twice.
Control injection of free MPIOs or PBS into mouse brain. T2-weighted MRI scans were performed on mice 2 weeks after injection of PBS or 50,000 MPIOs (2.84 or 0.9 μm). For all scans, TE = 6 ms. A high contrast signal drop is present in the injection track after injection of PBS (A, arrowhead), but a larger signal drop was observed in mice injected with MPIOs (B and C, arrowheads). Postmortem histology shows that MPIOs can be found in the area corresponding to the T2 signal drop (D, F and E, G, arrows). Scale bars: 1,500 μm (A–C), 500 μm (D, E), and 100 μm (F, G). In vivo MRI tracking of MPIO-labeled GSCs transplanted into the SCID mouse brain. GSCs were stably transduced with GFP, labeled with 2.84-μm MPIOs, and injected into the corpus callosum [between the neocortex (Ctx) and the striatum, (Str)] on the right side. Frontal T2*-weighted MRI scans (TE = 6 ms) were performed at intervals between 2 and 6 weeks after injection. (A) MRI scans of mice injected with GSCs show a broad signal drop that extends through several rostro-caudal slices (respective longitudinal distances indicated in μm). The inset shows large numbers of GFP-positive MPIO-labeled cells visualized postmortem at the injection site, indicated by the arrowhead. (B–D) Postmortem views (6 weeks after transplantation) of the sites indicated by arrows in (A). GFP-positive, MPIO-labeled GSCs were found in the wall of the lateral ventricle on the ipsilateral (B and C) and contralateral (D) sides. Scale bars: 1,500 μm (A) and 12 μm (B–D). In vivo MRI tracking of MPIO-labeled f-NPCs transplanted into the SCID mouse brain. Frontal T2*-weighted MRI scans (TE = 6 ms) of mice injected with f-NPCs show a broad signal drop that extends through several rostro-caudal slices (A, with respective longitudinal distances indicated in μm) as well as ventrally and temporally to the injection site. The inset shows large numbers of GFP-positive cells visualized postmortem within the area covered by the signal drop. (B and C) Postmortem close-up views (3 weeks after transplantation) of GFP-positive, MPIO-labeled cells that have translocated laterally and temporally along the corpus callosum (cc). Ctx, cerebral cortex; Str, striatum. Scale bars: 1,500 μm (A) and 12 μm (B and C).

Discussion
Various types of paramagnetic iron oxide particles have been used to label and track cells in vivo, including MIONs (2), USPIOs (13), and SPIOs (12,17,35,36). SPIOs in particular have been studied in detail and proven robust and safe enough to warrant clinical trials for tracking of dendritic and other immune system cells, neural stem cells, and islet cells (3). Labeling with each of these particle types provides sufficient contrast to track cells with MRI, but single cell resolution is difficult to obtain due to low intracellular iron oxide density (29,30). MPIOs, which by dint of larger size facilitate single particle detection (12,28,29), represent an improvement in this regard. Our study was motivated by the fact that the effects of MPIO labeling on stem cell integrity and function have been less well investigated relative to SPIO labeling.
Although MPIOs have been used in several studies to noninvasively track human and animal stem or progenitor cells transplanted into animal models and in one small-scale Chinese clinical study (7,12,25,27,29,40,42), few cell types have been investigated and only a few studies have assessed the effects of MPIO labeling on cellular function (7,21,23,24,26). Here, we contribute to a more comprehensive treatment of this issue by assessing the effects of this labeling on cell differentiation and behavior in a variety of human stem and progenitor cell types for MPIO labeling, including several features that have never been studied before, such as the real-time dynamics of cell division and migration and the differentiation of electrogenic properties in neural cells. Our salient findings are as follows: (1) A variety of human stem and progenitor cells of mesenchymal and neural origins can be labeled with MPIOs, but labeling efficiency (percentage of cells labeled) and uptake efficiency (number of MPIOs per cell) vary considerably among the different cell types. (2) MPIO labeling had no noticeable deleterious effects on cell proliferation or mitotic dynamics in any cell type studied. (3) Cell movement (random motility) in vitro was normal except for MPIO- labeled MSCs, which were slowed by about 25% relative to unlabeled MSCs. (4) Biochemical and functional differentiation to adipocytes, chondrocytes, and osteocytes by MSCs and to neurons by f-NPCs was not obviously affected by MPIO labeling. (5) The in vivo behavior of MPIO-labeled MSCs, f-NPCs, and GSCs appeared normal. This included migration over long distances in the brain and elaboration of neurites in the developing spinal cord.
Comparison to other Studies of MPIO Labeling
Proliferation and Mitosis
Other studies that have assessed the effects of MPIO labeling have shown, as here, that proliferation is little affected (7,23,24,27) but have not examined mitotic behavior directly. Our dynamic imaging of mitosis shows that with moderate to high MPIO load (on the order of 25 or more MPIOs per cell) the morphological changes accompanying mitosis are not obviously impeded, and the most dramatic transition from metaphase to cytokinesis occurs at normal speed. Indeed, the MPIOs in this situation appeared to be treated as cell organelles, associating with the mitotic spindle in two parallel rows together with the chromosomes. Thus, at least during a few days in vitro, there seem to be no deleterious effects of MPIO labeling on mitosis-related cytoskeletal functions.
Random Motility and Migration
Random motility in vitro is not noticeably affected by MPIO labeling, even with moderate loads of 10–20 MPIOs per cell, except for a moderate, although statistically significant, diminution of motility in MSCs. Nohroudi et al. (21) also reported an inhibition of motility of MSCs in an in vitro wound-healing assay when MPIO load was high. In contrast to Nohroudi et al. (21) we did not correlate motility to the number of MPIOs per cell, so we cannot say whether our results represent the situation at maximum MPIO load. Nevertheless, we note that at least some cell types appear unaffected even with extraordinarily high MPIO loads, since ASCs exhibited nearly normal motility even though they contained on average over 25 MPIOs per cell and not infrequently as many as 50–100 MPIOs per cell.
Our in vivo observations generally support the in vitro findings. MPIO-labeled migratory cell types, such as GSCs and f-NPCs, are clearly capable of intra- and inter-hemispheric migration after intracerebral injection in the mouse to similar extents as exhibited by unlabeled cells. This is similar to what has been observed after injection of MPIOs into the subventricular zone of rats, whereupon adult neural progenitors residing there become MPIO-labeled and subsequently migrate along their normal route in the rostral migratory stream (33,34).
Differentiation
Differentiation to terminal phenotypes appeared to be normal for all of the human stem and pro genitor cell types examined. Prior studies have demonstrated a normal differentiation of a few selected phenotypic characters by MPIO-labeled human hepatocytes (23,24) and amniotic fluid-derived stem cells (7). Although our analysis is also only partial for any cell type, the variety of phenotypic characters assessed, which include the expression of specific cytoskeletal proteins, the elaboration of large cell organelles, the ability to secrete extracellular matrix components, the expression of neurotransmitter enzymes and electrogenic ion channels, and the acquisition of complex morphologies, suggests that differentiation in general is hardly affected by low to moderate MPIO loads.
In Vivo Imaging
With the MRI protocol used it was possible to visualize and track the intracerebral movement of cells labeled with 2.84-μm or 0.9-μm MPIOs. MRI results were confirmed through postmortem coregistration of MPIO-labeled EmGFP+ cells with the locations of T2* signal intensity drops. In addition, this allowed us to assess the morphological differentation of the MPIO-labeled cells in vivo. The findings provide an in vivo correlate for some of the in vitro findings, namely that MPIO labeling does not appear to impair cell differentation or motility. Relatively high spatial resolution (70 × 70 μm2) was obtained but could in principle be improved with longer scan times. Although we did not attempt to optimize the MRI to achieve single cell detection, it is likely given previous studies (11,29) that this can be accomplished given the MPIO loads we have obtained.
Summary and Perspectives
Our results indicate that MPIO labeling is easily attained in a variety of human stem and progenitor cells with little sign of deleterious effects on proliferative and migratory behavior or on differentiation to terminal phenotypes. We conclude that MPIO labeling is generally nontoxic and suitable for MRI-based in vivo tracking of a broad spectrum of stem cell types in animal models. Further research could be aimed at optimizing MPIO labeling and uptake efficiency for any given stem cell type. In addition, similar analyses of recently developed biodegradable MPIOs will be important for extending MPIO-based tracking to clinical applications in human patients (20). This also has relevance for the potential persistence of MPIOs following the death of labeled cells, whereupon tissue deposition or macrophage scavenging may create signals that do not represent viable MPIO-labeled stem cells, see, for example, Zhang et al. (41).
Footnotes
Acknowledgments
We thank Ola Myklebost and Wayne Murrell for providing the immortalized bone marrow-derived human mesenchymal stem cells and the adult human neural stem cells, respectively; Philippe Collas for providing the primary adipose tissue-derived mesenchymal stem cells and for the use of the Cell^R microscope; Anastasia Afanasieva for lentiviral constructs; Marius Widerøe for assistance in running the MR instrumentation; Christian Brekken for discussions at the initiation of the project; and Kobra Sultani for assistance with histological procedures. This research was supported by grants from the Norwegian Research Council through the Norwegian Center for Stem Cell Research, the Medical Imaging Laboratory for Innovative Future Healthcare, and the Cancer Stem Cell Innovation Center to J.C.G., O.H., and I.A.L. J.-L.B. was supported by a grant from the Health and Rehabilitation Program (Helse og Rehabilitering/Extra). The authors declare no conflicts of interest.
The following author contributions are recognized: Conception and design, collection and assembly of data, data analysis and interpretation, manuscript writing, final approval of manuscript (J.-L.B., D.L.); conception and design, collection and assembly of data, data analysis and interpretation, final approval of manuscript (M.T., E.V.-M.); provision of study material, collection and assembly of data, final approval of manuscript (M.J.); collection and assembly of data, data analysis and interpretation, final approval of manuscript (M.-C.P.); financial support, administrative support, provision of study material, final approval of manuscript (I.A.L.); financial support, administrative support, final approval of manuscript, provision of laboratory facilities and apparatus (O.H.); conception and design, financial support, administrative support, provision of study material, assembly of data, data analysis and interpretation, manuscript writing, final approval of manuscript, provision of laboratory facilities and apparatus (J.C.G.).