
Abstract
X-linked myotubular myopathy (XLMTM) is an isogenic muscle disease characterized by progressive wasting of skeletal muscle, weakness, and premature death of affected male offspring. Recently, the XLMTM gene knock-in mouse, Mtm1 p.R69C, was found to have a similar phenotype as the MTM1 gene mutation in humans (e.g., central nucleation of small myofibers, attenuated muscle strength, and motor unit potentials). Using this rodent model, we investigated whether syngeneic cell therapy could mitigate muscle weakness. Donor skeletal muscle-derived myoblasts were isolated from C57BL6 wild-type (WT) and Mtm1 p.R69C (KI) mice for transplantation into the gastrocnemius muscle of recipient KI mice. Initial experiments demonstrated that donor skeletal muscle-derived myoblasts from WT and KI mice remained in the gastrocnemius muscle of the recipient KI mouse for up to 4 weeks posttransplantation. KI mice receiving syngeneic skeletal muscle-derived myoblasts displayed an increase in skeletal muscle mass, augmented force generation, and increased nerve-evoked skeletal muscle action potential amplitude. Taken together, these results support our hypothesis that syngeneic cell therapy may potentially be used to ameliorate muscle weakness and delay the progression of XLMTM, as application expands to other muscles.
Keywords
Introduction
X-linked myotubular myopathy (XLMTM) is a member of a well-defined subgroup of the centronuclear myopathies characterized by the presence of uniformly small muscle fibers with centrally located nuclei resembling fetal myotubes (6,39). The incidence occurs in approximately 1:50,000 male births worldwide with the onset of clinical signs at or near birth. Affected males have profound weakness, hypotonia, external ophthalmoplegia, and compromised respiratory function (16,21,30,35). Myotubularin, the protein encoded by the MTM1 gene, is a ubiquitously expressed phosphoinositide phosphatase implicated in intracellular vesicle trafficking and autophagy (23,32,38). A MTM1 knockout (KO) mouse model has been established; however, its life span of approximately 8 weeks limits the testing of some therapeutic options (6). Recently, a knock-in mouse model (Mtm1 p.R69C mouse) of XLMTM was developed by introducing a missense change in myotubularin resulting in a mutation similar to the MTM1 exon 4 gene in humans (34), which encodes part of the pleckstrin homology, glucosyltransferases, Rab-like GTPase activators, and myotubularin domain (PH-GRAM). PH-GRAM domain binds the two substrates phosphatidylinositol 3-phosphate (PI3P) and phosphatidylinositol 3,5-bisphosphate (PI3P,5P2) with high affinity, and this interaction is important for proper late endosomal trafficking. Myotubularin-bearing p.R69C binds PI3,5P2 with less affinity than wild-type (WT) myotubularin, so it is predicted that this myotubualrin mutant is hypofunctional (50). Furthermore, these mice have a significantly longer life span than KO MTM1 mice, allowing the assessment of both acute and chronic therapeutic modalities.
A number of treatment approaches for XLMTM have been tested in myotubularin-deficient mice. Both gene and enzyme replacement therapy have shown promising results in preclinical rodent studies (5,7,25). Pharmacological approaches such as inhibition of activin receptors (26) and pyridostigmine administration (12) have also shown therapeutic efficacy.
The task of replacing a missing gene in a subpopulation or all of the postmitotic nuclei of skeletal muscle is daunting (36). Furthermore, additional problems, such as immune response to the vector, have also been encountered (11). Cell therapy remains a viable therapeutic option for treatment of muscle degenerative disorders. Satellite cells obtained from a healthy donor or from the patient offer hope for treating muscular dystrophy (42). Myogenic cell transplantation for Duchenne muscular dystrophy (DMD) disease was developed and optimized in preclinical studies using a DMD murine model (14,43,44). Several adult-derived or purified stem cell populations can be candidates for the treatment of this disease (9,10,29,33,48). However, in some cases, the transplanted cells failed to restore expression of the WT protein, and thus may have limited therapeutic potential (22,51).
In this study we investigated whether injection of syngeneic skeletal muscle-derived myoblasts from WT or Mtm1 p.R69C mice (KI) into the gastrocnemius muscle could improve skeletal muscle function. We observed that KI mice receiving WT- or KI-derived skeletal muscle-derived myoblasts (SkMCs) had increased skeletal muscle mass, force generation, and nerve-induced skeletal muscle action potential amplitude.
Materials and Methods
Animals
All animal studies and protocol were reviewed and approved by Wake Forest University Institutional Animal Care and Use Committee in accordance with the principles delineated in the NIH Guide for the Care and Use of Laboratory Animals (permit number: A10-082). All surgeries were performed under isoflurane (Abbott, Chicago, IL, USA) anesthesia. Animals were euthanized at the indicated time points using cervical dislocation under anesthesia. Experiments were performed in KI (Mtm1 p.R69C) mice [Mtm1 p.R69C mutation in C57BL6 mice (34)] and WT (C57BL6) male mice. Heterozygous female mice were mated with WT male C57BL6 mice for 10 generations. A total of 21 WT mice (WT mice ages: 15 mice at 14 ± 2 weeks, 3 mice at 2 months, 3 mice at 7 months) and 45 KI mice (KI mice ages: 45 mice at 14 ± 2 weeks, 3 mice at 2 months, and 3 mice at 7 months) were used for this study. The breeding pairs (Mtm1 p.R69C and WT mice) were a generous gift from Dr. Christopher R. Pierson (Ohio State University). The breeding and genotyping of WT and KI mice was completed as previously described (34). Mice were kept under a 12-h dark/light cycle and provided a standard mouse chow diet and water ad libitum.
Genotype by RT-PCR
cDNA was isolated from tails of 21-day-old mice by a DNA extraction kit (Invitrogen, Carlsbad, CA, USA). Reverse transcriptase-polymerase chain reaction experiments were performed for identification of the KI genotype using SQ1/LAN1 primer sequence (SQ1: 5′-TG TGGTTGGCAGTTGTCAACC-3′ LAN1: 5′-CCAGAG GCCACTTGTGTAGC-3′). Glyceraldehyde 3-phosphate dehydrogenase (GAPDH) forward primer was 5′-TTGT GATGGGTGTGAACCAC-3′, and reverse primer was 5′-TTCAGCTCTGGGATGACCTT-3′. The genotype of WT and KI mice was completed as previously described (34). All primers were made by Invitrogen. Mice not positive for SQ1/LAN1 were considered to be of the WT genotype.
Isolation and Characterization of Skeletal Muscle-Derived Myoblasts (SkMCs)
The muscle biopsy was collected from the gastrocnemius of WT and KI mice. SkMCs were isolated and characterized according to well-established protocol at our laboratory (3,13). Briefly, biopsy tissue was minced into small pieces and incubated for 2 h in 0.2% type I collagenase enzyme (Worthington Biochem, Lakewood, NJ, USA) at 37°C for isolation of primary SkMCs. SkMCs from both WT and KI mice were transferred to six-well plates (BD Falcon; BD Biosciences, Franklin Lakes, NJ, USA) coated with fibronectin, collagen, and albumin coating mix (AthenaES, Baltimore, MD, USA). Primary SkMCs were incubated in myogenic-inducing cell culture medium [20% fetal bovine serum (Gibco, Grand Island, NY, USA), 10% horse serum (HyClone, Logan, UT, USA), 0.5% chick embryo extract (Seralab, West Sussex, UK), 1% l-glutamine (HyClone), and 1% penicillin/streptomycin (HyClone) in Dulbecco's modified Eagle medium (DMEM; HyClone)]. The myogenic-inducing medium was changed every 3 days until cells reached 80% confluence. To assess doubling time, primary WT and KI SkMCs were trypsinized (0.05% trypsin; HyClone) and plated at 1 × 10⁴ cells per plate in 10% FBS in DMEM. Cell counts were performed at 0, 4, 8, 24, 48, and 72 h using MTS luminescence assay according to manufacturer's protocol (Promega, Madison, WI, USA) (40).
Characterization of myoblast phenotype was assessed by immunofluorescence. WT and KI myoblasts were plated at 1 × 10⁵ cells/well and grown in myogenic medium consisting of 2% horse serum and 1% penicillin/streptomycin in DMEM for 10 days, fixed using 3.7% formaldehyde (Sigma-Aldrich, St. Louis, MO, USA), and stained with antibodies for paired box 7 (Pax7; 1:50; Developmental Studies Hybridoma Bank, Iowa City, IA, USA), myogenic differentiation (MyoD), myogenic factor 5 (Myf5), and desmin (1 μg; Santa Cruz Biotechnology, Santa Cruz, CA, USA). Secondary antibodies were anti-mouse (1 μg; Santa Cruz Biotechnology) for Pax7 and desmin and anti-rabbit (1 μg; Santa Cruz Biotechnology) for MyoD and Myf5. Index of staining was calculated on stained images using Image Pro 6.3 (Media Cybernetics, Bethesda, MD, USA).
SkMC Labeling and Injection
Prior to injection, the WT and KI myoblasts were labeled using chloromethylbenzamido-DiI (CM-DiI; Invitrogen). The labeling method was performed according to the manufacturer's provided methods (15,52). Briefly, 1 million cells were suspended in 1 ml of serum-free DMEM, and 5 μl of cell-labeling solution was added to the cell suspension and mixed well by gentle trituration pipetting. The cell suspension was incubated for 20 min and washed with phosphate-buffered saline (PBS; HyClone) two times. After labeling, the cells were concentrated to 1 × 10⁶ cells/50 μl in PBS/ leg, and 50 μl was injected into the middle of the gastrocnemius muscle of anesthetized 3- to 4-month-old KI mice using a 1-ml syringe (Retractable Technology, Little Elm, TX, USA) fitted with a 26-gauge needle (BD Biosciences). Mice received only one injection. Age-matched WT mice were used as positive controls, while nontreated KI mice were used as disease or negative controls. All KI mice used as negative controls were injected with PBS in a manner similar to cell treated mice.
Muscle Physiologic Function Test
Physiological assessment of muscle force and nerve-evoked skeletal muscle action potential amplitude was assessed at four time points: baseline (prior to cell injection), 1, 2, and 4 weeks postinjection. Muscle force measurements were conducted in the hindlimb of anesthetized mice. Briefly, mice were anesthetized and positioned on a stereotactic frame (Aurora Scientific Inc., Ontario, Canada) allowing the placement of the left foot securely against a footplate, which is connected to a force transducer (100 V, delay 0.006 s, duration 0.0001 s; Aurora Scientific Inc.). Percutaneous stimulation of the tibial nerve stimulated the gastrocnemius muscle, resulting in force being exerted against the footplate. The force of the foot pushing against the footplate was recorded for later analysis using DMA5.0 software (Aurora Scientific Inc.). All muscle force measurements were normalized to rodent body weight. Briefly, nerve-evoked skeletal muscle action potentials were obtained while under anesthesia. The sciatic nerve was exposed, and a ground electrode was placed on the back of the animal. A stimulus was applied to the sciatic nerve using a hook-shaped bipolar tungsten electrode (Cadwell Sierra Wave; Cadwell Laboratories, Inc., Kennewick, WA, USA). Skeletal muscle action potentials were recorded at four locations in the middle region of the gastrocnemius using a disposable monopolar needle recording electrodes that were placed in the midsection of the gastrocnemius muscle. The nerve was electrically stimulated with 6.0 mA using a stimulus generator (Cadwell Sierra Wave; Cadwell Laboratories, Inc.).
Immunohistochemistry Histopathology and Morphometry
Gastrocnemius muscles were isolated, weighed, and fixed using 10% neutral-buffered formalin (Leica Biosystems, Richmond, IL, USA) for 24 h and transferred to 30% sucrose (Sigma-Aldrich) solution for an additional 24 h. The gastrocnemius muscle was placed in Tissue-Tek OCT (Sakura Rinetek, Torrance, CA, USA), frozen in liquid nitrogen, cross-sectioned (10 μm), and then stained using hematoxylin (Sigma-Aldrich) and eosin (Poly Scientific, Bay Shore, NY, USA) (H&E) at 1, 2, and 4 weeks posttransplantation. H&E slides were digitized using a Leica microscope DM4000B with a Retiga 2000RV-Q-imaging camera (100× magnification; QImaging, Surrey, Canada). Single muscle fiber number, diameter, and DiI-labeled cells were determined using Image Pro 6.3 (Media Cybernetics) and expressed as the mean and standard error of the mean (SEM). Cross-sections of fixed and frozen gastrocnemius were cut, washed, and blocked in protein-blocking solution (Dako, Carpentaria, CA, USA) for 30 min at room temperature. Antibodies to desmin (1 μg/ml; Santa Cruz Biotechnology), myosin heavy chain (MyHC) (1 μg/ml; Developmental Studies Hybridoma Bank, Iowa City, IA, USA), and cluster of differentiation 68 (CD68; 1 μg/ml; Abcam, Cambridge, UK) applied overnight at 4°C. The next day, slides were washed in PBS, and fluorescein isothiocyanate-conjugated anti-mouse secondary antibody (Invitrogen) was then applied at 1:200 dilutions for 1 h at room temperature. Slides were rinsed in PBS. Coverslips were placed on the cells using a mounting solution containing 4′,6-diamidino-2-phenylindole (DAPI; Vector Shield, Burlingame, CA, USA) to asses nuclear staining.
Statistics
An unpaired t-test, one-way ANOVA, or two-way ANOVA followed by Bonferroni's multiple comparisons test to assess differences between groups was performed using GraphPad Prism version 6.02 for Windows (GraphPad Software, La Jolla, CA, USA). Significance was defined as p < 0.05 in all tests.
Results
Characterization of KI and WT Mice
KI and WT mice were identified using DNA-PCR. KI mice showed a positive SQ1/LAN1 band (Fig. 1A). Histological analysis of the gastrocnemius muscles in KI mice (3.5 months, Fig. 1B) showed abundant small-sized fibers (black arrows, Fig. 1B) with centrally located nuclei (white arrows, Fig. 1B) and central area defects (gray arrows, Fig. 1B). In contrast, WT muscle fibers were large (black arrows, Fig. 1B) with peripherally located nuclei (white arrows, Fig. 1B). Morphometric techniques were used to assess individual myofiber diameter. Muscle fibers from KI mice ranged from 5 μm to 48 μm, whereas muscle fibers from WT mice ranged from 19 μm to 71 μm (Fig. 1C). The diameter of muscle fibers for the KI mice was significantly smaller than the WT mice (KI: 22.3 ± 0.3 μm, n = 4; WT: 42.3 ± 0.3 μm, n = 4; p < 0.0001) (Fig. 1D). As would be expected, the smaller fiber diameters of the KI mice were associated with an overall decrease in gastrocnemius muscle mass versus that observed in WT mice (KI: 82.8 ± 3.2 mg vs. WT: 165.9 ± 7.7 mg, n = 6, p < 0.0001) (Fig. 1E).

Characterization of KI and WT murine model of XLMTM. (A) Genotype of wild-type (WT) and myotubularin 1 (Mtm1 p.R69C) knock-in (KI) mice was confirmed by DNA-PCR. SQ-1/LAN1 primer confirmed the KI mice, while the WT mice did not show the band. GAPDH was used as an internal control. (B) Skeletal muscle in KI mice shows small diameter [black arrows, KI (B)], central nucleated muscle fibers [white arrows, KI (B)] with central area defects [gray arrows, KI (B)]. In contrast, muscle fibers from WT mice possess large [black arrows, WT (B)] and peripherally located nuclei [white arrows, WT (B)] [hematoxylin & eosin (H&E), scale bar: 50 μm]. (C) The distribution of muscle fiber diameters in KI mice (n = 4, white bars) is shifted to the left of WT mice (n = 4, black bars). (D) The diameter of muscle fibers in KI mice is significantly smaller than that of WT mice (KI: 22.3 ± 0.3 μm, n = 4; WT: 42.3 ± 0.3 μm, n = 4; ****p < 0.0001). (E) Gastrocnemius muscle mass paralleled the data presented for muscle fiber size. Muscle mass of KI mice was significantly less than that of WT mice (KI: 82.8 ± 3.2 mg vs. WT: 165.9 ± 7.7 mg, n = 6, p < 0.0001).
Physiological Characterization of KI and WT Mice
Our next series of experiments was designed to determine whether physiological measures of skeletal muscle force generation and nerve-evoked skeletal muscle compound action potentials differed among genotypes. Skeletal muscle force generation was assessed using tibial nerve stimulation at frequencies ranging from 1 Hz to 150 Hz. WT mice (n = 8) generated greater force than KI mice (n = 7) at all frequencies tested (p < 0.0001, ANOVA) (Fig. 2A). We then wanted to determine whether force development for a given amount of time (s) differed. Force development over time, or the integrated force, was significantly greater in WT mice than KI mice (p < 0.01, ANOVA) (Fig. 2B). Similarly, sciatic nerve-evoked compound muscle action potential amplitudes for WT mice were significantly greater than KI mice (WT: 8.50 ± 0.44 mV vs. KI: 2.05 ± 0.07 mV, n = 5; p < 0.0001) (Fig. 2C).

Force generation and compound muscle action potential in gastrocnemius muscle of KI and WT mice. (A) Gastrocnemius force was measured by tibial nerve stimulation using a wide range of frequencies (1–150 Hz) in KI and WT mice. Force development of WT mice was significantly greater than that observed in KI mice (n = 8, ****p < 0.0001, ANOVA) with significant differences between the groups at all frequencies studied (n = 8, *p < 0.05, **p < 0.01, ****p < 0.0001). (B) To account for the effect of body weight on muscle force development in WT and KI mice, force development was normalized to body weight. Similar to the data presented in (A) WT mice displayed a significantly greater force than that of KI mice (n = 8, ****p < 0.0001, ANOVA), whereas between-group differences were only observed at frequencies ≥50 Hz (n = 8, ***p < 0.001, ****p < 0.0001). (C) Compound muscle action potential (CMAP) amplitude was assessed in both WT and KI mice at 6.0 mA using a stimulus generator. CMAP amplitude was significantly attenuated in KI mice versus WT. The data are presented as the mean ± SEM (n = 4, ****p < 0.0001).
Isolation and Characterization of SkMCs In Vitro
Our next series of experiments was designed to characterize the SkMCs isolated from WT (SkMCs-WT) and KI (SkMCs-KI) mice. Cell doubling time of SkMCs was significantly shorter in WT mice than KI mice (WT: 25.37 ± 1.26 h vs. KI: 36.48 ± 1.67 h, n = 3; p < 0.001) (Fig. 3A). Both the WT and KI SkMCs expressed Pax7, MyoD, Myf5, and desmin, confirming a SkMC phenotype (Fig. 3B). In Figure 3B, MyoD and Myf5 showed weak expressions; however, stained cells could be calculated using Image Pro 6.3 program. There was no significant difference in indices of staining for Pax7 (KI, 48.82 ± 0.030% vs. WT, 36.98 ± 0.012%; n = 3; n.s); however, index of staining of WT SkMCs was significantly higher than KI SkMCs for MyoD (KI, 30.93 ± 0.041% vs. WT, 74.16 ± 0.035%; n = 3; p < 0.0001), Myf5 (KI, 30.93 ± 0.041% vs. WT, 71.40 ± 0.092%; n = 3; p < 0.001), and desmin (KI, 47.07 ± 0.032% vs. WT, 73.33 ± 0.053%; n = 3; p < 0.05). The data suggest that both WT and KI SkMCs are at the stage of myoblastic differentiation; however, a higher expression of myogenic markers was observed in the WT SkMCs than the KI SkMCs.

Characterization of SkMCs from KI and WT mice in vitro. (A) Doubling time was significantly longer in skeletal muscle-derived myoblasts (SkMCs) from KI mice compared to SkMCs from WT mice. The data represent the mean ± SEM (n = 3, ***p < 0.001). (B) Skeletal muscle cell phenotypes were confirmed using Pax7 (green), MyoD (green), Myf5 (green), and desmin (Des; green) antibodies. Nuclei were counterstained with DAPI (blue).
Delivery of Donor-Derived SkMCs in the Gastrocnemius Muscle
Donor-derived SkMCs from WT and KI mice were labeled with CM-DiI (red dye) and injected into the gastrocnemius muscle at 1 million cells/leg. As shown in Figure 4, SkMCs-WT and SkMCs-KI were found in the gastrocnemius muscle at 1, 2, and 4 weeks postinjection. The injected cells did not migrate into adjacent muscles (data not shown). The number of labeled cells was quantified. The number of DiI-labeled SkMCs-WT and KI cells (10×) were 579 ± 40 and 403 ± 40 for week 1 (n = 5, p < 0.001), 536 ± 40 and 364 ± 20 for week 2 (n = 5, p < 0.001) and 427 ± 27, and 303 ± 93 for week 4 (n = 5, p < 0.001), respectively. Furthermore, DiI-labeled donor SkMCs were integrated into (Fig. 4; yellow arrows) or were located (Fig. 4; white arrows) around immature muscle fibers after injection and were associated with the expression of desmin and MyHC (Fig. 4). On the other hand, DiI-labeled donor SkMCs were not colocated with the expression of CD68, a macrophage-specific marker. Spleen tissue was positive control for CD68 (Supplement 1, link: https://drive.google.com/folderview?id=0B32Pyxjw3Slec1ZmZngxcnY4Q3c&usp=sharing).

SkMCs integrate and differentiate into mature muscle cells. Donor-derived SkMCs from WT and KI mice were injected into the gastrocnemius muscle and assessed for desmin and myosin heavy chain (MyHC) at (A) 1, (B) 2, and (C) 4 weeks postinjection. Donor cells expressed Dil (red) and desmin (green) and MyHC (green) in the gastrocnemius muscle of XLMTM model. Nuclei were counterstained with DAPI (blue). White arrow indicates colocalization of DiI (red) with desmin (green) or DiI (red) with MyHC (green), and yellow arrow indicates DiI-labeled donor cells that integrated into immature muscle fibers. These data demonstrate that both WT and KI SkMCs migrate toward small diameter, centrally nucleated muscle fibers.
Effect of KI and WT SkMCs on Muscle Mass and Diameter
Experiments were designed to determine whether KI or WT SkMCs could improve gastrocnemius muscle mass and fiber diameter in KI mice. Gastrocnemius muscles were isolated from KI mice at 1, 2, and 4 weeks after WT or KI donor cell injection. KI mice injected with KI SkMCs (Fig. 5A) displayed a trend for improved muscle mass throughout treatment, but only reached significance at week 4 (KI vs. KI + KI cells, n = 6, p < 0.01), whereas mice treated with WT SkMCs (Fig. 5B) showed increased muscle mass at weeks 2 (KI vs. KI + WT cells, n = 6, p < 0.01) and 4 (KI vs. KI + WT cells: n = 6, p < 0.05). Interestingly, the increase in gastrocnemius muscle mass was not paralleled by improved muscle fiber diameter. Treatment of KI mice with KI SkMC at 1, 2, or 4 weeks (Fig. 5C) was without effect on fiber diameter, whereas KI mice treated with WT SkMC (Fig. 5D) showed a decrease in muscle diameter at week 1 (KI vs. KI + WT cells, n = 5, p < 0.0001) and an increase at week 2 (KI vs. KI + WT cells: n = 5, p < 0.0001).

Summary of SkMC injection on gastrocnemius muscle mass and diameter. Gastrocnemius muscle mass of mice was assessed at 0, 1, 2, and 4 weeks after SkMC injection. KI mice injected with KI SkMCs (A) exhibited improved muscle mass at week 4 (KI vs. KI + WT cells, n = 6, p < 0.01), whereas KI mice treated with WT SkMCs (B) showed an increased muscle mass at weeks 2 (KI vs. KI + WT cells, n = 6, p < 0.01) and 4 (KI vs. KI + WT cells: n = 6, p < 0.05). Interestingly, the improvement seen in gastrocnemius muscle mass with cell therapy was not reflected in the gastrocnemius muscle fiber diameter. There was no effect on muscle fiber diameter in KI mice treated with KI SkMCs at 1, 2, or 4 weeks (C), whereas KI mice treated with WT SkMCs showed a decrease in muscle diameter at week 1 (KI vs. KI + WT cells, n = 5, p < 0.0001) and an increase at week 2 (KI vs. KI + WT cells: n = 5, p < 0.0001) (D). Differences between KI (baseline) and cell-treated groups were considered significant when p < 0.05; significance was indicated as: *p < 0.05, **p < 0.01, ****p < 0.0001. The horizontal line indicated by the black arrow is the mean, while the two dashed lines represent the SEM of WT muscle mass (165.9 ± 7.7 mg, n = 6, A and B) and fiber diameter (42.3 ± 0.3 μm, n = 4, C and D).
Effect of SkMC Therapy on Muscle Force Generation and Action Potential Amplitude
Our final series of experiments assessed the effects of SkMC treatment on muscle force generation and nerve-evoked skeletal muscle action potentials, as an indicator of efficacy of nerve regeneration, in MTM-deficient mice. When the sciatic nerve is stimulated, an electrode can detect the muscle response, which may indicate the regeneration of the neuromuscular junction or the nerve itself. In this experiment, treatment of KI mice with KI SkMCs showed improved muscle force development at week 1 (KI: n = 11 vs. KI + KI cells: n = 6, p < 0.05) and week 2 (KI: n = 11 vs. KI + KI cells: n = 10, p < 0.0001) (Fig. 6A, C, and E, respectively). Treatment with WT SkMCs improved muscle force generation at weeks 1 (KI: n = 13 vs. KI + WT cells: n = 7, p < 0.01), 2 (KI: n = 13 vs. KI + WT cells: n = 10, p < 0.0001), and 4 (KI: n = 13 vs. KI + WT cells: n = 5, p < 0.0001) (Fig. 6B, D, and F, respectively).

Effect of WT and KI cell injection on in vivo force generation in KI mice. The tibial nerve was percutaneously stimulated at frequencies ranging from 1 to 150 Hz to evoke muscle contraction in the gastrocnemius muscle. Force generated in KI mice in the absence of cell treatment (n = 11, filled squares, B, D, and F) was significantly less than in KI mice treated with KI cells at 1 (A, n = 6 p < 0.05,) and 2 (C, n = 10, p < 0.0001) weeks post-cell injection. Furthermore, significance was observed in KI-treated cells at 100 Hz at 2 weeks postinjection (p < 0.05). Similarly, force generated in KI mice in the absence of cell treatment (n = 13, filled squares, A, C, and E) was significantly less than in KI mice treated with WT cells at 1 (A, n = 7 p < 0.01,), 2 (C, n = 10, p < 0.0001) and 4 (E, n = 5, p < 0.0001) weeks post-cell injection. The data are presented as the mean ± SEM. Differences between KI and cell-treated groups were considered significant when p < 0.05; significance was indicated as: *p < 0.05, **p < 0.001, ****p < 0.0001.
Skeletal muscle action potential amplitude was significantly improved in both KI and WT SkMC-treated mice. KI mice treated with KI SkMCs showed improvement at weeks 1 (KI vs. KI + KI cells, n = 5, p < 0.05) and 4 (KI vs. KI + KI cells, n = 5, p < 0.05) (Fig. 7A), whereas KI mice treated with cells from WT animals showed improved action potential amplitude at weeks 1 (KI vs. KI + WT cells, n = 5, p < 0.001), 2 (KI vs. KI + WT cells, n = 5, p < 0.0001), and 4 (KI vs. KI + WT cells: n = 5, p < 0.05) (Fig. 7B).
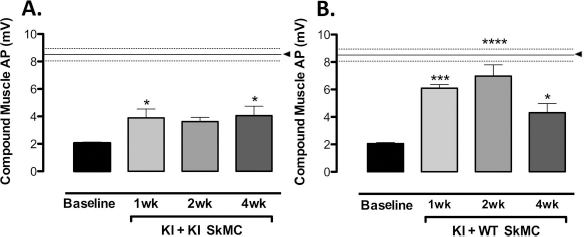
Nerve-evoked action potentials in gastrocnemius muscle before and after WT and KI cell injection. Sciatic nerve stimulation-evoked action potentials were studied in KI mice in the absence (baseline) or presence of KI (A) or WT (B) cells. The amplitude of nerve-evoked action potentials in KI mice injected with WT cells was significantly improved at 1, 2, and 4 weeks postinjection. Furthermore, nerve-evoked action potential amplitude at 2 weeks postinjection approached nerve-evoked action potential amplitude observed in WT mice. Similarly, KI cell treatment was associated with improvement of nerve-evoked action potential amplitude 1 and 4 weeks after injection into KI mice. The data are presented as the mean ± SEM (n = 5 of all groups studied). Differences between KI (baseline) and cell-treated groups were considered significant when p < 0.05; significance was indicated as: *p < 0.05, ***p < 0.001, ****p < 0.0001. The horizontal line indicated by the black arrow is the mean, while the two dashed lines represent the SEM of WT mice (8.5 ± 0.4 mV, n = 5).
Discussion
In this study, we investigated whether syngeneic cell therapy could improve functional outcomes in KI mice. The WT SkMCs express the normal copy of the mutated gene and should be a useful therapeutic product. Whereas the use of the patient's SkMCs at the early stage of disease may also provide a good source for cell therapy without requiring immune suppression, it remains unknown whether these cells can provide functional improvement in MTM patients. We observed that SkMCs isolated from either WT or KI mice were capable of differentiating and exhibited skeletal muscle cell characteristics in vitro. Furthermore, upon transplanting SkMCs from KI or WT mice into the gastrocnemius of KI mice, skeletal muscle mass, muscle force generation, and nerve-evoked skeletal muscle action potentials were increased compared to untreated mice. These results suggest that autologous cell therapy from the patients could be used as a potential treatment modality for the management of XLMTM.
In contrast to DMD, there have been very few studies assessing cell therapy in centronuclear myopathies. In mouse models of DMD, myoblasts have been transplanted into dystrophic muscle, which gives rise to dystrophin-expressing myofibers (14). These studies have led to several clinical trials, which demonstrated the safety of cell therapy, but with variable functional outcomes (17,20,22,28,43–46,49). The variability has been associated with reduced cell survival, inability of cells to migrate to target tissues, increased apoptosis, and/or delayed proliferation (1,24,31). Therefore, our first studies were designed to address these issues. Pax7, MyoD, Myf5, and desmin are expressed in proliferating myoblasts prior to differentiation (8,41). Both WT and KI SkMCs displayed a myoblast phenotype by expressing low levels of Pax7, MyoD, Myf5, and were capable of differentiating as indicated by the expression of desmin in vitro under differentiation induction culture conditions. WT and KI SkMCs were integrated or located adjacent to immature muscles in situ and were associated with the expression of late stage muscle markers, desmin and MyHC. SkMCs can secrete a variety of growth factors, which may influence muscle regeneration after cell transplantation (18,47). Furthermore, there was no indication that these cells migrated outside of the target tissue. Finally, KI and WT SkMCs displayed an immature phenotype; however, there were differences in expression between WT and KI cell myoblast markers. The data also indicated that cells isolated from WT mice had a shorter doubling time than cells from the KI mice. These data suggest that cell populations from KI and WT mice are not strictly equivalent, although both exerted effects.
Histopathological assessment of the gastrocnemius muscle isolated from KI mice showed centrally located nuclei, the presence of numerous small muscle fibers, and central area defects that appear as holes in the muscle fibers, all of which resemble the pathology of skeletal muscle fibers from animal models and humans (19,34,37). Thus, we wanted to determine if KI or WT SkMCs could improve the muscle phenotype of KI mice. Previous reports indicated that satellite muscle cells and adipose tissue-derived stem cells are able to participate in muscle regeneration in a muscle damage model by increasing muscle mass and improving functional capacity after cell transplantation (2,4). Our results using a muscle degeneration disease mouse model support and extend the findings of these earlier studies by unknown expectation. KI mice treated with KI or WT cells displayed significant improvement in muscle mass, yet the improvement in muscle mass was not reflected in larger muscle fiber diameters, which may be due to the short exposure time of the recipient KI muscle fibers with the donated muscle fibers. Additionally, one potential reason for the improvement in muscle mass may be due to a paracrine effect. KI cells do not possess MTM1 protein; however, they are able to secrete growth factors, such as insulin growth factor-1. This could have improved muscle force through paracrine effect of secreted factors. Enhanced muscle functions evidenced by our strength evaluations also support this concept because the spreading and migration of the injected cells were limited under our testing conditions. Moreover, some of the implanted cells were incorporated into native muscle fibers, which may have improved physiological functions. More WT cells were seen in the injected muscle than KI cells at all time points examined. This may also explain the increased improvement in muscle function in the WT group. This initial study assessed a single injection of SkMCs, whereas future studies will assess muscle fiber structure over a longer time period and using multiple injections of SkMCs.
Our next series of experiments were designed to assess physiological outcomes in KI mice after cell therapy. Numerous pharmacological, gene, and cell-based therapies have been used to delay the progression of XLMTM. Muntoni et al. reported that zebrafish with MTM1 knockdown revealed abnormal structure in neuromuscular junctions (37). Acetylcholinesterase inhibitors have been tried for abnormal neuromuscular transmission, but adverse side effects limit their use (27). Cell therapy has been shown to be a promising therapeutic modality for the treatment of muscle degenerative disorders (i.e., MD and DMD) (14), but little progress has been made in the area of cell therapy for the management or treatment of centronuclear myopathies, specifically MTM. Injection of KI and WT SkMCs resulted in significant improvement in tibial nerve-evoked force generation as well as sciatic nerve-evoked skeletal muscle action potentials. One potential explanation for this observation is that the presence of cells contributed to regeneration of neuromuscular junction and/or the related nerve. This, in turn, is believed to enhance muscle function based on the correlation of action potential and muscle markers observed in WT SkMCs.
Similar to muscle fiber studies, future studies will assess physiological outcomes over a longer time period and with multiple injections of SkMCs.
In conclusion, we evaluated syngeneic cell transplantation in the MTM KI mouse model, with the goal of delaying the progression of XLMTM and improving muscle function. Our data show that myoblasts from both WT and KI SkMCs are able to form immature muscle fibers and display expression of late stage muscle markers, desmin and MyHC. Furthermore, to the best of our knowledge, these data are the first to demonstrate improved physiological outcomes following cell transplantation in this model. Taken together, these data demonstrate that syngeneic SkMCs improve functional outcomes in KI mice, suggesting that autologous cells may provide a new therapeutic/ management option for patients suffering from centronuclear myopathies.
Footnotes
Acknowledgments
This study was supported by a grant from the Joshua Frase Foundation. The authors thank Dr. Robert W. Grange for assistance with muscle force measurement and Matthew Borkowski (Aurora Scientific Inc.) for providing the in vivo muscle function apparatus available for this study.