
Abstract
While multiple rodent preclinical studies, and to a lesser extent human clinical trials, claim the feasibility, safety, and potential clinical benefit of cell grafting in the central nervous system (CNS), currently only little convincing knowledge exists regarding the actual fate of the grafted cells and their effect on the surrounding environment (or vice versa). Our preceding studies already indicated that only a minor fraction of the initially grafted cell population survives the grafting process, while the surviving cell population becomes invaded by highly activated microglia/macrophages and surrounded by reactive astrogliosis. In the current study, we further elaborate on early cellular and inflammatory events following syngeneic grafting of eGFP mouse embryonic fibroblasts (mEFs) in the CNS of immunocompetent mice. Based on obtained quantitative histological data, we here propose a detailed mathematically derived working model that sequentially comprises hypoxia-induced apoptosis of grafted mEFs, neutrophil invasion, neoangiogenesis, microglia/macrophage recruitment, astrogliosis, and eventually survival of a limited number of grafted mEFs. Simultaneously, we observed that the cellular events following mEF grafting activates the subventricular zone neural stem and progenitor cell compartment. This proposed model therefore further contributes to our understanding of cell graft-induced cellular responses and will eventually allow for successful manipulation of this intervention.
Introduction
While current clinical treatment options for many neurodegenerative diseases and injuries of the central nervous system (CNS) are mainly based on anti-inflammatory and/or symptomatic therapy, actual regeneration of dysfunctional or lost tissue might be facilitated by means of cell and/or tissue transplantation. The latter is suggested by an increasing number of preclinical studies that contribute to the development of cell-based therapies for a variety of CNS pathologies (15,22,28,30). As such, most of current attention is given to intravenous administration of ex vivo cultured autologous or off-the-shelf allogeneic stem cell populations from mesenchymal or neural origin. Although this is the most clinically applicable and commercially interesting approach for cell-based therapies, currently many doubts arise regarding the actual in vivo survival, migration, immune-modulating properties, and functional integration of intravenously administered cell populations (4,27). Alternatively, direct cell grafting into degenerating or injured CNS tissue might overcome the need for (directed) migration of the cell graft toward the CNS (15,30). Following this approach, it is of utmost importance to clearly define the desired clinical effect: either one aims to graft a (genetically modified) cell population to provide trophic support for degenerating or injured CNS tissue, or one aims at functional integration of the grafted (neural) cell population. Nevertheless, both approaches require a substantial amount of grafted cells to survive, presumably for extended periods of time (months to years dependent on the clinical manifestation). Despite numerous reports claiming successful grafting of fibroblasts, mesenchymal stem cells (MSCs) and neural stem cells (NSCs) in preclinical animal models of CNS diseases and CNS traumata, and even in human clinical trials, a thorough investigation of the grafted cells' fate and the response of the surrounding CNS tissue to the graft is consistently missing in the literature (3,15). Clearly, the latter is of high importance if one wants to further develop the use of functionalized cell-based therapeutics in the CNS.
In agreement with several other literature reports (5,8, 11,12), also our preceding studies demonstrate successful implantation and—to a quantifiable level—survival of the cell graft but also warrant early cell graft mortality associated with tissue damage and a disproportionate endogenous immune reaction toward fibroblast, MSC, or NSC grafts (2,10,13,14,25,26,29,35). Although this might seem highly contradictory with many reports claiming the clinical safety of cell grafting in the CNS, these aspects of cell-based therapeutic intervention in the CNS are rarely studied and in some cases even neglected. Specifically focusing on the use of murine embryonic fibroblasts (mEFs) as cellular implants in the CNS, we previously reported that dramatic postimplantation mortality of the cell graft is followed by extensive microglia/macrophage recruitment and astroglial scarring toward the surviving remnants of the original mEF graft (25). Nevertheless, a small number of grafted cells seem to consistently survive the initial grafting procedure. In a follow-up study, we further reported that survival of an mEF graft in the CNS is supported by the occurrence of new blood vessels within the mEF graft (10). As the establishment of inflammatory responses and neoangiogenesis occurs within 1 to 2 weeks postgrafting, in the study presented here we focus on early (hours to days) posttransplantation events following mEF grafting in the CNS of immune competent mice, on the level of the cell graft itself as well as on the level of endogenous inflammatory, angiogenic, and stem/progenitor cell responses.
Materials and Methods
Animals
Female C57BL/6J-eGFP transgenic mice were obtained via Jackson Laboratories (strain code 003291; Bar Harbor, ME, USA) and further bred in the animal housing facility of the University of Antwerp until use for cell isolation (n=5). Female wild-type C57BL/6J mice, 8-10 weeks of age, were obtained via Charles River Laboratories (strain code 027; Chatillon-sur-Chalaronne, France) and used for grafting experiments (n = 27). For all experiments, mice were kept in a normal day-night cycle (12/12) with ad libitum access to food and water. All experimental procedures were approved by the ethical committee for animal experiments of the University of Antwerp (approval No. 2011-13).
Culture of Murine Embryonic Fibroblasts
eGFP+ mEFs were cultured from eGFP+ embryos of C57BL/6-eGFP transgenic mice (n=5) as described previously (25). Briefly, embryos (E14.5) were harvested, and the liver, spleen, and brain were removed. Next, embryonic tissue was dissociated by mechanical trituration until the cell suspension had no tissue clumps left. The cell suspension was then enzymatically digested by means of trypsin-EDTA (Invitrogen, Life Technologies Europe, Ghent, Belgium)/DNAse-1 (1,000 Kunitz units/50 ml; Sigma-Aldrich, Diegem, Belgium) incubation until a single cell suspension was obtained. The total cell population obtained was plated in a T25 culture flask (one flask per embryo; Greiner Bio-One GmbH, Frickenhausen, Germany) in 10 ml mEF medium, consisting of DMEM containing l-glutamine (Invitrogen) supplemented with 10% fetal calf serum (Hyclone, GE Healthcare Europe GmbH, Diegem, Belgium), 100 U/ml penicillin (Invitrogen), 100 mg/ml streptomycin (Invitrogen). For routine cell culture, mEF medium was replaced every 2-3 days, and mEF cultures were split 1:3 every 4 to 5 days. All cultured cells were incubated at 37°C and 5% CO2. For cell grafting, mEF cultures at passage 3 or 4 were harvested and stored on ice until grafting.
Sham or mEF Grafting
All surgical interventions were performed under sterile conditions. Mice were anesthetized by an intraperitoneal injection of a ketamine (80 mg/kg; Pfizer, Puurs, Belgium) + xylazine (16 mg/kg, Bayer Health Care, Diegem, Belgium) mixture in phosphate-buffered saline (PBS; Life Technologies Europe, Ghent, Belgium) and placed in a stereotactic frame (Stoelting, Dublin, Ireland). Next, a midline scalp incision was made, and a hole was drilled in the skull using a dental drill burr (Stoelting) at the level of bregma and 2 mm to the right side of the midline. Next, an automatic microinjector pump (kdSci-entific, Holliston, MA, USA) with a 10-μl Hamilton syringe (Bonaduz, Switzerland) was positioned above the exposed dura. A 30-gauge needle (Hamilton), attached to the syringe, was stereotactically placed through the intact dura at a depth of 2.5 mm, thereby targeting the injected cell population directly below the right capsula externa. After 2 min of pressure equilibration, 2 μl of PBS (sham graft, n=6) or 1.5 χ 105 eGFP+ mEFs in a volume of 2 μl of PBS (cell graft, n=21) was injected at a speed of 0.7 μl/min. The needle was retracted after another 4 min to allow pressure equilibration and to prevent backflow of the injected PBS or cell suspension. Next, the skin was sutured (Vicryl; Ethicon, Norderstedt, Germany), and a 0.9% NaCl solution (Baxter, Lessen, Belgium) was administered subcutaneously in order to prevent dehydration, while mice were placed under a heating lamp to recover.
Histological Analysis
In order to label hypoxic cells in vivo, mice were injected intraperitoneally 90 min before sacrifice with Hypoxyprobe-1 (HPI Inc., Burlington, MA, USA), according to manufacturer's guidelines. Next, mice were deeply anesthetized via an intraperitoneal injection of 60 mg/kg/BW pentobarbital (Nembutal; Ceva Sante Animale, Brussels, Belgium), transcardially perfused with ice-cold PBS, and perfused fixed with 4% paraformaldehyde (Merck Millipore, Merck KGaA, Darmstadt, Germany). Whole brains were then surgically removed and postfixed in 4% paraformaldehyde for 2 h. Fixed brains were freeze protected via a sucrose gradient (Applichem, St. Louis, MO, USA): 2 h at 5%, 2 h at 10%, and overnight at 20%. Brains were then snap frozen in liquid nitrogen and stored at −80°C until further processing. Histological analysis was then performed according to optimized procedures previously described by us (2). In brief, consecutive 10-μm-thick cryosections were prepared using a microm HM500 cryostat (Microm GmbH, Walldorf, Germany) for all cell-grafted brains starting before the graft site until beyond the graft site, keeping track of both successful and lost slides. Slides were observed by direct immunofluorescence microscopy in order to locate eGFP-expressing cell grafts. Further immunofluorescence analyses were performed using the following antibody combinations: a fluorescein isothiocyanate-labeled rat anti-mouse CD133 antibody (1:100 dilution, 11-1331-80; eBioscience, Vienna, Austria), a phycoerythrin (PE)-labeled rat anti-mouse Ly6G antibody (1:50 dilution, 12-5931-81; eBioscience), a PE-labeled mouse antihuman Ki-67 antibody (1:10 dilution, 556027; BD Pharmingen, Erembodegem, Belgium), a rabbit anti-mouse IBA1 antibody (1:200 dilution, 019-19741; Wako, Neuss, Germany) in combination with an Alexa Fluor® 555-labeled donkey anti-rabbit secondary antibody (1:1,000 dilution, A31572; Invitrogen), a mouse anti-mouse GFAP antibody (1:400 diultion, mab377; Merck Millipore, Merck GKaA, Darmstadt, Germany) in combination with an Alexa Fluor® 350-labeled goat anti-mouse secondary antibody (1:200 dilution, A11068; Invitrogen), a rabbit anti-mouse S100β antibody (1:400 dilution, ab52642; Abcam, Cambridge, UK) in combination with an Alexa Fluor® 555-labeled donkey anti-rabbit secondary antibody (1:1,000 dilution, A-31572; Invitrogen), a rabbit anti-pimonidazole (Hypoxyprobe-1) antibody (1:200 dilution, PAB2627; HPI Inc.) in combination with an Alexa Fluor® 555-labeled donkey anti-rabbit secondary antibody (1:1,000 dilution, A-31572; Invitrogen), and a rabbit anti-mouse CD31 antibody (1:50 dilution, AB28364; Abcam) in combination with a Texas Red-labeled goat anti-rabbit secondary antibody (1:400 dilution, AB6719; Abcam). Slides were counterstained using TOPRO-3 (1/200 dilution; Life Technologies). Following staining, sections were mounted using Prolong Gold Antifade (P36930; Invitrogen). Immunofluorescence images were acquired using an Olympus (Aartselaar, Belgium) BX51 fluorescence microscope equipped with an Olympus DP71 digital camera. Olympus Cell^F Software was used for image acquisition and processing.
Histological Quantification
Quantitative analysis of cell graft survival, hypoxia, angiogenesis, glial cell responses, and subventricular zone (SVZ) activation was performed using ImageJ analysis software (v. 1.47; NIH, Bethesda, MD, USA) and TissueQuest immunofluorescence analysis software (v. 3.0; TissueGnostics GmbH, Vienna, Austria), as previously described by us (14,26). For each of the slides analyzed, the graft site was manually delineated based on eGFP-fluorescence of the eGFP+ mEF graft. The graft site border was then determined as a region extending 100 μm from the mEF graft site. The SVZ was determined as a region extending 50 μm from the ventricle wall. According to previously established procedures (14,26), the following parameters were determined: the total cell density (in nuclei/mm3) within the mEF graft site and within the mEF graft site border (11-18 estimates per cell graft analyzed), the absolute number of eGFP+ mEFs within the graft site (11-18 estimates per cell graft analyzed), the actual mEF cell graft survival provided in percent calculated from the initial number of grafted eGFP+ mEFs (11-18 estimates per cell graft analyzed), the percent of eGFP+ mEFs that are HypoxyProbe-1+ (three to four estimates per cell graft analyzed), the optical density [percent optical density (OD)] of CD31+ blood vessels within the mEF graft site (one to three estimates per cell graft analyzed), the total density of Ly6G+ neutrophils (in cells/mm3) within the mEF graft site (one estimate per cell graft analyzed), the density of IBA1+ myeloid cells (microglia and macrophages) (in cells/mm3) within the mEF graft site, the mEF graft site border (three to four estimates per cell graft analyzed), the density (in cells/mm3) of S100B+ astrocytes within the mEF graft site border (three to four estimates per cell graft analyzed), and the degree of astrogliosis as measured by the percent OD of GFAP expression within the mEF graft site border (three to four estimates per cell graft analyzed). For the SVZ region of interest, the following parameters were determined: the total cell density (in nuclei/mm3, 5-18 estimates per cell graft analyzed), the density of Ki-67+ nuclei (in Ki-67+ nuclei/mm3, three estimates per cell graft analyzed), and the percent OD of GFAP expression (two to four estimates per cell graft analyzed).
Statistical Analysis
All statistical analyses were performed using the statistical software R version 2.15.3 (http://www.r-project.org). Generalized estimating equations (38) were used to evaluate differences between time points for a specific response, taking within and between mouse variability into account. The obtained p values were corrected for multiple testing using the false-discovery rate control. To examine increasing or decreasing trends, the response variables were fitted using linear mixed models. Some of the responses were log or sqrt transformed in order to achieve normality. The estimated marginal mean evolutions are plotted together with the mean values per mouse. A value of p <0.05 was considered to be statistically significant.
Results
mEF Graft Survival Is Highly Compromised by Early Hypoxia-Induced Apoptotic Cell Death Within the Core of the mEF Graft
In earlier studies, we already noted that the viability of mEF grafts highly decreases during the first week after transplantation, and we suggested hypoxia as a potential cause of this event (15). Aiming at a better understanding of the events leading to the decreased viability of mEF grafts, we histologically investigated (i) mEF graft survival, (ii) hypoxia and apoptosis within mEF grafts, and (iii) neoangiogenesis within mEF grafts at different time points early postgrafting. For this, 21 wild-type C57BL/6 mice were grafted with 1.5 χ 105 eGFP+ mEFs and sacrificed at 6 h (n=5), day 1 (n=5), day 3 (n=6), or day 7 (n = 5) postgrafting. In order to detect the presence or absence of hypoxic cells within the mEF graft at different time points, mice received an injection of HypoxyProbe-1, an in vivo marker for hypoxic cells, 2 h before sacrifice. In agreement with our preceding data, a significant (p <0.0001) decrease over time in the number of eGFP+ mEFs within the graft site was observed (Fig. 1A, eGFP/TOPRO3 images, and Fig. 1B). Moreover, the observed decrease in mEF graft viability mainly occurs during the first 24 h postgrafting (p=0.0001, 6 h vs. day 1) and continues to decrease until day 3 postgrafting (p = 0.0035, day 1 vs. day 3). Thereafter, no additional mEF graft mortality was observed. The latter can be explained by the significantly (p <0.0001) decreasing ratio of HypoxyProbe-1+ (hypoxic) versus HypoxyProbe-1- (nonhypoxic) mEFs within the core of the mEF graft site between day 1 and day 3 postgrafting (Fig. 1A, eGFP/HypoxyProbe-1 images, and Fig. 1C). Of note, cellular hypoxia within the core of the mEF grafts subsequently led to apoptotic cell death of affected mEFs, as demonstrated by the high number of eGFP- TUNEL+ mEFs within the graft site at day 1 postgrafting (Fig. 1A, eGFP/TUNEL/TOPRO3 images). In addition, the absence of a further decrease in mEF graft mortality after day 3 postgrafting can also be explained by a significantly (p <0.0001) increasing appearance of CD31+ blood vessels over time, with the observed angiogenic response already being initiated at day 1 postgrafting (p=0.0055, 6 h vs. day 1; Fig. 1A, eGFP/CD31 images, and Fig. 1D). Despite the decreasing number of grafted eGFP+ mEFs, the overall cell density significantly increases over time within the mEF graft site and the mEF graft site border (for both p <0.0001), initiated within the mEF graft site by day 1 postgrafting (p=0.0002) and within the mEF graft site border by day 3 postgrafting (p <0.0001; Fig. 1A, TOPRO3/eGFP images, and Fig. 1E). In agreement with our previous studies, the observed increase in cell density is associated with the recruitment of inflammatory cells, as discussed below.
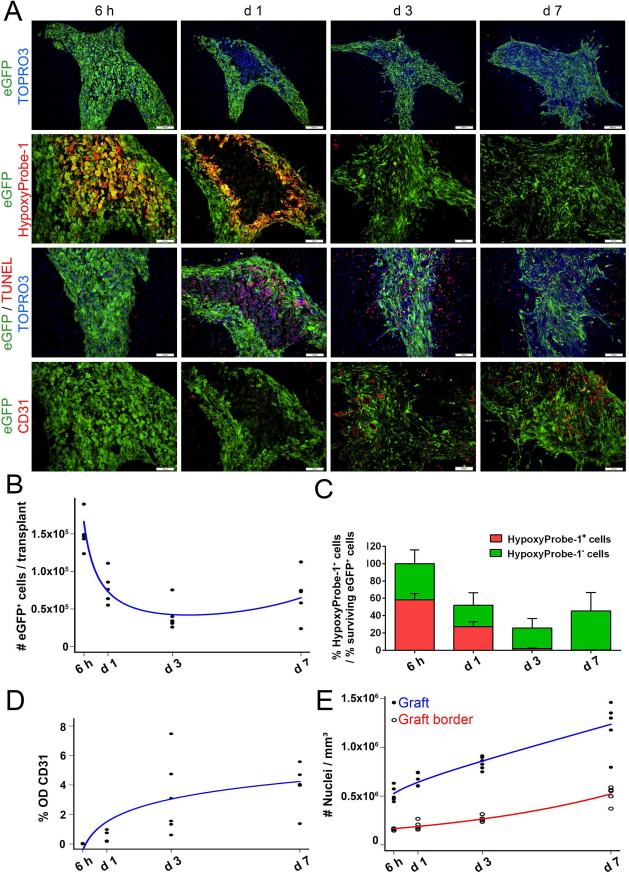
mEF graft survival is highly compromised by early hypoxia-induced apoptotic cell death within the core of the mEF graft. (A) Representative fluorescence images of mEF grafts at 6 h, day 1, day 3, and day 7 postgrafting. The top row shows a low magnification overview (scale bars: 200 μm) of grafted eGFP+ mEFs (shown in green) and TOPRO3+ cell nuclei (shown in blue). The three bottom rows show higher magnification images (scale bars: 100 μm) of grafted eGFP+ mEFs (shown in green), TOPRO3+ cell nuclei (shown in blue), HypoxyProbe-1+ hypoxic cells (shown in red), TUNEL+ apoptotic cells (shown in red), and CD31+ blood vessels (shown in red). (B) Quantification of the TOPRO3+ cell nuclei density within the graft site (filled dots, best fitting model shown in blue) and in the graft site border (open dots, best fitting model shown in red) at 6 h, day 1, day 3, and day 7 postgrafting (each dot represents the average estimate of a single mEF graft, n = 5-6 mEF grafts analyzed). (C) Quantification of the absolute number of surviving eGFP+ mEFs per graft site (filled dots, best fitting model shown in blue) at 6 h, day 1, day 3, and day 7 postgrafting (each dot represents the average estimate of a single mEF graft, n = 5-6 mEF grafts analyzed). (D) Quantification of % eGFP+ mEF graft survival (respective to the initially grafted 150,000 eGFP+ mEFs) at 6 h, day 1, day 3, and day 7 postgrafting. Additionally shown is the % eGFP+ HypoxyProbe-1+ mEFs at each time point (n = 5-6 mEF grafts analyzed). (E) Quantification of the degree of CD31+ blood vessel growth (expressed in % OD, filled dots, best fitting model shown in blue) within the mEF graft site at 6 h, day 1, day 3, and day 7 postgrafting (each dot represents the average estimate of a single mEF graft, n = 5-6 mEF grafts analyzed).
Neutrophil Invasion of the mEF Graft Site Precedes Astroglial Cell Responses and Microglia/Macrophage Recruitment
As we noted in our earlier studies that mEF and MSC grafts become highly invaded and surrounded by IBA1+ myeloid cells (microglia/macrophages) and encapsulated by GFAP+ astroglial scar tissue by week 2 postgrafting (14,25), we here aimed to provide a more detailed time course of the observed endogenous inflammatory responses following mEF grafting. For this, we performed a histological time course experiment and investigated the presence or absence of neutrophils, microglia/macrophages, astrocytes, and glial scar formation. While at 6 h postgrafting no cellular responses can be observed in or around the mEF graft site (Fig. 2A, eGFP/Ly6G, eGFP/S100β/GFAP, and eGFP/IBA1 images for 6 h), the mEF graft site becomes rapidly invaded by high numbers of Ly6G+ neutrophils by day 1 postgrafting (p <0.0001), which remain present at an equal density during the following days (p = 0.976, day 1 vs. day 7; Fig. 2A, eGFP/Ly6G images, and Fig. 2B). At the same time (i.e., day 1 postgrafting), the graft site border already displays a small, but significant (p = 0.0004), increase in the number of S100β+ astrocytes (Fig. 2A, eGFP/S100β/GFAP images for day 1, and Fig. 2C). In addition, S100β+ astrocytes display an activated phenotype as early as day 1 after mEF grafting, as demonstrated by increased GFAP expression (p = 0.0357; Fig. 2A, eGFP/S100β/GFAP images for day 1, and Fig. 2D). However, in contrast to the immediate high influx of Ly6G+ neutrophils within the graft site, both the number of S100β+ astrocytes and the degree of GFAP+ astrogliosis highly increase over time (for both p <0.0001; Fig. 2A, eGFP/S100β/GFAP images, and Fig. 2C, D). Note that at no time point could S100β+ astrocytes or GFAP+ astrogliosis be observed within the graft site (Fig. 2A, eGFP/S100β/GFAP images). On the other hand, IBA1+ myeloid cell responses within the mEF graft site and the mEF graft site border were only apparent from day 3 postgrafting (for both p <0.0001), which thereafter further increased within the mEF graft site and the mEF graft site border (for both p <0.0001; Fig. 2A, eGFP/IBA1 images, and Fig. 2E). Based on the presented data, we conclude that neutrophil invasion of the mEF graft site is the earliest event occurring following mEF grafting in the CNS, which is initially quickly followed by astrocyte proliferation/activation and thereafter by microglia/macrophage recruitment. Note that similar events, although to a lesser extent, occur at 7 days following a control injection of PBS (n = 6) in the CNS (Fig. 2F, eGFP/Ly6G, eGFP/S100β/GFAP, and eGFP/IBA1 images).

Neutrophil invasion of the mEF graft site precedes astroglial cell responses and microglia/macrophage recruitment. (A) Representative fluorescence images of grafted mEFs at 6 h, day 1, day 3, and day 7 postgrafting. High magnification images (scale bars: 100 μm) are shown of grafted eGFP+ mEFs (shown in green), Ly6G+ neutrophils (shown in red), GFAP+ astrogliosis (shown in blue), S100β+ astrocytes (shown in red), and IBA1+ myeloid cells (microglia and macrophages, shown in red). (B) Quantification of the Ly6G+ neutrophil density within the mEF graft site (best fitting model shown in blue) at 6 h, day 1, day 3, and day 7 postgrafting (filled dots, each dot represents the average estimate of a single mEF graft, n = 5-6 mEF grafts analyzed). (C) Quantification of the S100β+ astrocyte density within the graft site border (open dots, best fitting model shown in red) at 6 h, day 1, day 3, and day 7 postgrafting (each dot represents the average estimate of a single mEF graft, n = 5-6 mEF grafts analyzed). (D) Quantification of the degree of GFAβ+ astrogliosis within the graft site border (expressed in percentage OD, open dots, best fitting model shown in red) at 6 h, day 1, day 3, and day 7 postgrafting (each dot represents the average estimate of a single mEF graft, n = 5-6 mEF grafts analyzed). (E) Quantification of IBA1+ myeloid cells within the graft site (filled dots, best fitting model shown in blue) and in the graft site border (open dots, best fitting model shown in red) at 6 h, day 1, day 3, and day 7 postgrafting (each dot represents the average estimate of a single mEF graft, n = 5-6 mEF grafts analyzed). (F) Representative fluorescence images of PBS-injected mice at day 7 postgrafting. High magnification images (scale bars: 100 μm) are shown of autofluorescent inflammatory cells (shown in green), Ly6G+ neutrophils (shown in red), GFAβ+ astrogliosis (shown in blue), S100β+ astrocytes (shown in red), and IBA1+ microglia (shown in red).
mEF Grafting and the Subsequent Neuroinflammatory Responses in the CNS Trigger Cell Proliferation in the SVZ
As neuroinflammation, either disease associated or cell graft induced, has often been linked to increased neurogenic activity, and thus potentially to endogenous repair following neurodegeneration or trauma (18,20,24), we next aimed to evaluate cellular behavior in the SVZ following mEF grafting. For this, we performed a histological time course experiment and investigated total cell density, cell proliferation, and GFAP reactivity in the SVZ at 6 h, day 1, day 3, and day 7 after mEF grafting, as well as at day 7 after control PBS injection. As early as day 1 postgrafting, a significant increase (p = 0.0002) in cell density in the SVZ is observed, which further increases over time (p <0.0001; Fig. 3A, TOPRO3 images, and Fig. 3B). This increase in cell density in the SVZ was further documented by an increased number of Ki-67+ nuclei in the SVZ over time after mEF grafting (p=0.0006), which also was significant as early as day 1 postgrafting (p <0.0001; Fig. 3A, Ki-67 images, and Fig. 3C). As GFAP expression in the SVZ is a potential marker for SVZ NSCs (16), we investigated whether the observed increase in cell proliferation within the SVZ is associated with an increase in GFAP expression. As such, we observed a significant increase over time in GFAP expression in the SVZ after mEF grafting (p <0.0001), being significant by day 1 postgrafting (p <0.0001; Fig. 3A, GFAP images, and Fig. 3D). While GFAP colocalizes with Ki-67+ cells in the SVZ, no colocalization with the NSC marker CD133 (prominin) could be observed (Fig. 3E). However, absence of the CD133 marker does not necessarily indicate that the observed proliferating cell population is not of SVZ NSC origin, but might reflect a more differentiated state of the Ki-67+GFAP+ cell population. Finally, we aimed to investigate whether the observed changes in the SVZ are related to the procedure of mEF grafting or whether they also occur following a control injection of PBS, as the latter also induces a significant inflammatory response (see above). In this context, although equal numbers of Ki-67+ nuclei could be detected in the SVZ of mEF and PBS grafted mice at day 7 (p = 0.104), the overall density of cell nuclei and GFAP expression was significantly lower in the PBS-injected control group compared to the mEF grafted group (p=0.0078 and p <0.0001, respectively).
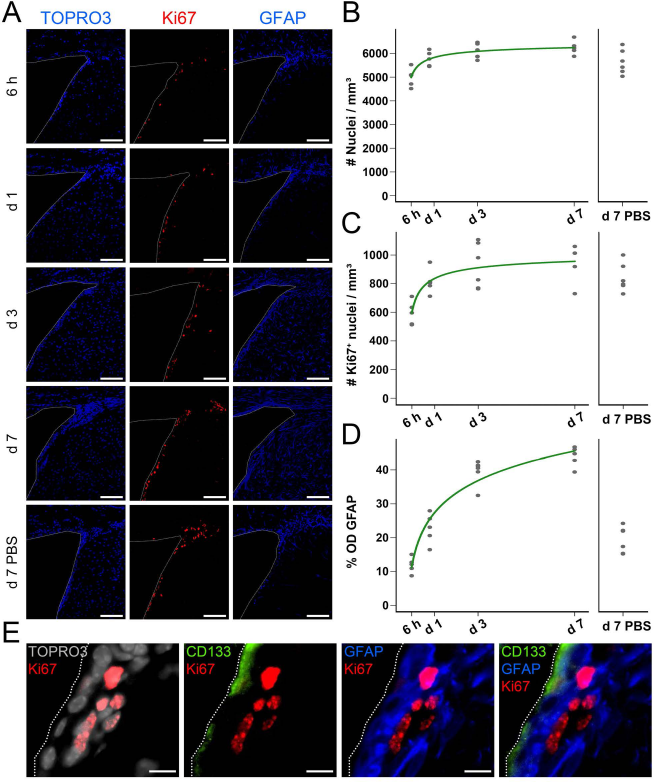
mEF grafting and the subsequent neuroinflammatory responses in the CNS trigger cell proliferation in the SVZ. (A) Representative fluorescence images of the SVZ at 6 h, day 1, day 3, and day 7 post-mEF grafting and at day 7 post-PBS injection. High magnification images (scale bars: 100 μm) on which the ventricle is delineated by a white thin dotted line. TOPRO3+ cell nuclei (shown in blue), Ki-67+ proliferating cells (shown in red), and GFAP+ cells (shown in blue) are shown. (B) Quantification of the TOPRO3+ nuclei density (filled dots, best fitting model shown in green) within the SVZ at 6 h, day 1, day 3, and day 7 post-mEF grafting and at day 7 post-PBS injection (each dot represents the average estimate for a single mouse SVZ area, n = 5-6 mice analyzed). (C) Quantification of the Ki-67+ proliferating cell density (filled dots, best fitting model shown in green) within the SVZ at 6 h, day 1, day 3, and day 7 post-mEF grafting and at day 7 post-PBS injection (each dot represents the average estimate for a single mouse SVZ area, n = 5-6 mice analyzed). (D) Quantification of the degree of GFAP expression (expressed in % OD, filled dots, best fitting model shown in green) within the SVZ at 6 h, day 1, day 3, and day 7 post-mEF grafting and at day 7 post-PBS injection (each dot represents the average estimate for a single mouse SVZ area, n = 5-6 mice analyzed). (E) Representative fluorescence images of the SVZ at day 7 post-mEF grafting. Detailed images (scale bars: 10 μm) show TOPRO3+ cell nuclei (shown in gray), Ki-67+ proliferating cells (shown in red), CD133+ ependymal cells (shown in green), and GFAP expression (shown in blue).
Discussion
Given the inherent invasiveness of a cell-grafting procedure in the CNS and the contrasting ease by which such an intervention creates experimental and clinical hope to cure complex CNS diseases or traumata, a thorough characterization of the cellular events following cell grafting in the CNS is inevitable to claim safety and efficacy of cell-based regenerative therapies. In this study, we have further contributed to the characterization of cellular events following mEF grafting into the CNS. As such, we provide a novel working model that is mathematically derived from the available quantitative histological data describing the temporal patterns of cellular events early postgrafting (Fig. 4). This model offers a strong basis for further exploratory studies and safety evaluations of current cell grafting approaches to treat CNS disease or injury. Although in this study mEFs were used for cell grafting in the CNS, in our preceding studies no substantial differences were observed between mEF and adult bone marrow-derived MSC grafts in the CNS of immune-competent mice (14,25). In addition, we have previously shown that NSC grafts show a similar temporal pattern of cellular events. However, while astrocytes formed a barrier surrounding mEF grafts, they were able to invade NSC grafts (25,26). Therefore, we believe the presented results and model to be representative for cell grafting in the CNS in general, although subtle deviations might occur depending on the cell type grafted.
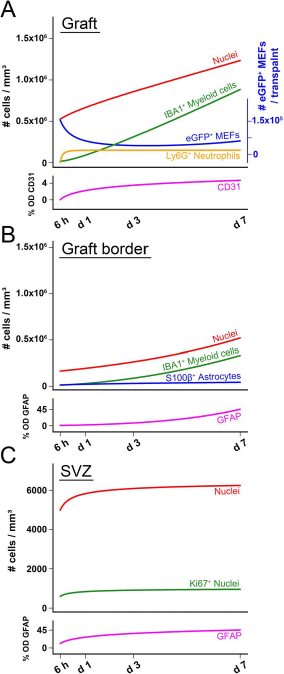
Proposed working model of sequential cellular events following cell grafting in the CNS. Based upon the quantitative histological data acquired, we were able to mathematically model the temporal changes in the observed cellular responses. The different models are shown together as follows. (A) Temporal evolution of nuclei density, IBA1+ myeloid cell density, Ly6G+ neutrophil density, and degree of CD31+ blood vessels density (left y-axis) within the mEF graft site. Additionally, the temporal evolution of the absolute number of grafted eGFP+ mEFs within the graft site is shown (right y-axis, shown in blue). (B) Temporal evolution of nuclei density, IBA1+ myeloid cell density, S100b+ astrocyte density, and degree of GFAP+ astrogliosis within the mEF graft site border. (C) Temporal evolution of nuclei density, Ki-67+ proliferating cell density, and the degree of GFAP expression in the SVZ following mEF grafting.
At the level of the cell graft (Fig. 4A, B), a large proportion of grafted mEFs in the core of the graft site immediately (at 6 h) suffer from hypoxia and undergo apoptotic cell death between day 1 and day 3 postgrafting. At the same early time point following mEF grafting (day 1), a rapid influx of neutrophils occurs within the graft site. Currently, we do not know whether this response is triggered due to mEF graft-derived hypoxic/apoptotic signaling or due to the actual cell grafting procedure. Additionally, it needs to be established whether neutrophils actively contribute to apoptotic death of grafted mEFs or whether their role is limited to phagocytosis of cellular debris. Following these initial events, cell graft survival is observed by day 3 postgrafting, which most likely can be attributed to the appearance of new blood vessels within the mEF graft site. However, the driving force behind the observed neoangiogenesis, which in time occurs very fast, will need further clarification as both neutrophils and mEFs were previously shown to be able to produce vascular endothelial growth factor (VEGF) (10,31). By day 3 postgrafting, microglia/macrophages start to invade and surround the graft site, while reactive astrogliosis is initiated around the graft site. Given our observation that cell graft mortality occurs before their appearance, it is currently not known whether (or how) microglia/macrophages and astrocytes actually contribute to (or influence) mEF graft survival. However, we recently observed a significant in vitro upregulation of VEGF production by mEFs upon coculture with LPS/interferon-γ (IFN-γ)-activated BV2 microglia. These results thus suggest that activated microglia/macrophages, which are present within and surrounding cellular grafts in the CNS, might contribute to cell graft survival in vivo, albeit indirectly (10).
Despite our extensive characterization of several cell types involved during the initial apoptotic and inflammatory events within the core of the mEF graft, it is clear that many open questions remain regarding their exact interplay. As it is currently well accepted that neuroinflammation—dependent on specific environmental conditions—can play a dual role as being detrimental or beneficial to repair following a neurotrauma (36), further profound characterization of immune cell responses following cell grafting is of utmost importance as intracerebral cell grafting is a highly ambiguous therapeutic procedure. As such, on one hand, intracerebral cell grafting initially negatively affects the brain by disrupting the endogenous tissue microstructure during the cell grafting procedure itself (25). Moreover, this procedure is associated with a pronounced cell graft-induced neutrophil invasion, microglial activation, and astrocytic scarring, all processes detrimental in the early stages of neurotrauma (36). However, on the other hand, many (pre)clinical studies have demonstrated the therapeutic value of cell grafting procedures for various neurodegenerative diseases. While the beneficial effects of cell grafting were initially thought to originate from the capacity of grafted stem cells to directly replace lost tissue, it is now suggested that the clinical potential of intracerebral stem cell therapy originates from the ability of grafted stem cells to produce trophic factors that potentially stimulate the endogenous neuroprotective and/or neurorepair processes (15,17,27,28). This current switch from the “cell replacement” working model toward the “bystander effects” working model has also been ascribed to migrating endogenous bone marrow-derived stem cell populations activated following neurotrauma (6,7), as well as to grafted bone marrow and/or various ex vivo cultured mesenchymal stem/stromal cell populations (32,33). However, as many of the proposed mechanisms are still under intensive investigation, this currently vague “bystander effects” working model will most likely turn out to be highly complex, involving the interplay between grafted and endogenous cell types. As such, following our reasoning—although not proven yet—we believe that inflammatory events during the remodeling of cellular grafts in the CNS are directly responsible for the production of neuro(immune)-protective and/or regeneration-inducing trophic factors. This hypothesis is currently under intensive investigation in transgenic mouse models ablating different cell populations involved in the process of cell graft remodeling in the CNS.
On the systemic level (Fig. 4C), we further noted that mEF grafting triggers substantial cell proliferation in the SVZ. Given our observation that an increased number of Ki-67+ cells can be detected as early as day 1 postgrafting, the observed response is most likely triggered by hypoxic or apoptotic signaling by the grafted mEF themselves. On the other hand, as increased proliferation in the SVZ was also observed after a control injection of PBS, although to a lesser extent, we cannot rule out the potential contribution of neutrophil-derived signaling during early SVZ activation. Likewise, the true identity of the proliferating cell population in the SVZ remains elusive, as no single marker currently exists to distinguish between adult neural stem/progenitor cells and astrocytes (9,16,21,23). Nevertheless, it has currently been established that certain endogenous repair mechanisms quickly become activated following stroke (1,19,37). Given the high similarity of cellular and inflammatory events following stroke with the inflammatory events described here after cell grafting, we might argue that—in the case of cell grafting under a pathological condition—cellular events following cell grafting in the CNS activate an endogenous repair mechanism in the SVZ, which in turn can have a beneficial effect on the pathology, either by interfering with the disease progression or by promoting repair.
To further explore the potential of the endogenous SVZ NSCs, we recently investigated whether SVZ NSCs can contribute to remyelination of demyelinated CNS tissue. Although the inflammatory response leading to CNS demyelination induced an increased activity in the SVZ, we observed an increased migration of neuroblasts toward the olfactory bulb, but no contribution to the remyelination of the demyelinated splenium (20). Thus, even if cell graft-induced inflammatory responses trigger proliferation, migration, and differentiation of SVZ NSCs, it still needs to be established whether or not sufficient cells can escape from their developmental function, that is, differentiate into neuroblasts and migrate over the rostral migratory stream to the olfactory bulb, and contribute to a true regeneration process. In this context, an interesting study by Tajiri et al. (34) demonstrated that grafted MSCs in the vicinity of a stroke lesion act as a functional biobridge to attract proliferating SVZ NSCs. As such, this study further underscores the complexity of cell graft-mediated brain repair due to the active interplay between the cell graft, the SVZ NSC compartment, and the actual brain lesion. Based on our study presented here—and the model it brought forward—this highly complex interplay between different brain regions and/or cell-based manipulations deserves more attention in future research. Further contributions to this field will not only increase the credibility of cell-based regenerative medicine approaches but will also highly contribute to safety, and in time clinical efficacy, of these experimental procedures.
Footnotes
Acknowledgment
This work was supported by research grants G.0136.11 and G.0130.11 (granted to Zwi Berneman, Annemie Van der Linden, and Peter Ponsaerts) of the Fund for Scientific Research-Flanders (FWO-Vlaanderen, Belgium), in part by a Methusalem research grant from the Flemish government (granted to Zwi Berneman and Herman Goossens) and in part by funding received from the European Union's Seventh Framework Programme (FP7/2007-2013) under grant agreement No. 278850 (INMiND; granted to Annemie Van der Linden). Debbie Le Blon holds a Ph.D.-studentship from the Flemish Institute for Science and Technology (IWT-Vlaanderen). Chloé Hoornaert holds a Ph.D.-studentship from the FWO-Vlaanderen. The authors declare no conflict of interest.