
Abstract
Ex vivo-expanded buccal mucosal epithelial (BME) cell transplantation has been used to reconstruct the ocular surface. Methods for enrichment and maintenance of BME progenitor cells in ex vivo cultures may improve the outcome of BME cell transplantation. However, the parameter of cell seeding density in this context has largely been neglected. This study investigates how varying cell seeding density influences BME cell proliferation and differentiation on tissue culture polystyrene (TCPS). The highest cell proliferation activity was seen when cells were seeded at 5×10⁴ cells/cm2. Both below and above this density, the cell proliferation rate decreased sharply. Differential immunofluorescence analysis of surface markers associated with the BME progenitor cell population (p63, CK19, and ABCG2), the differentiated cell marker CK10 and connexin 50 (Cx50) revealed that the initial cell seeding density also significantly affected the progenitor cell marker expression profile. Hence, this study demonstrates that seeding density has a profound effect on the proliferation and differentiation of BME stem cells in vitro, and this is relevant to downstream cell therapy applications.
Introduction
Worldwide, corneal disease is the most common cause of blindness 1 . Severe ocular surface damage may be caused by thermal and chemical burns and microbial infection, may result from autoimmune disease (e.g. Stevens–Johnson syndrome), or arise congenitally (aniridia-associated keratopathy) 2,3 . Ocular surface disease develops as a consequence of limbal stem cell dysfunction. The limbus, the junctional area between the transparent cornea and the opaque sclera with its overlying conjunctiva, is believed to contain the self-renewing adult stem cells responsible for normal corneal epithelial regeneration. It has been shown that transplantation of limbal stem cells can be used as a therapeutic intervention in those with severe ocular surface disease 4,5 . Donor tissue can be taken from the normal contralateral eye, but this can compromise the integrity of the normal eye 5 . In many instances, limbal stem cell deficiency is bilateral, requiring the use of allogeneic donor tissue and immunosuppression. Furthermore, the number of limbal stem cells present in the graft may be insufficient to retain graft viability. Therefore, other sources of stem cells are highly desirable. Grafts of buccal mucosa are sometimes used as an alternative to cells taken from the eye 6 –9 . Extensive studies have been conducted to investigate the possibility of using buccal mucosal epithelial (BME) cells as donor tissue, since harvesting those cells avoids invasive surgery required for cells from the limbus 2,9 . Previous studies have confirmed that BME progenitor cells share common characteristics with limbal stem cells and that there is overlap in progenitor marker expression between these populations 10 .
Cultures of BME cells have been used to prepare grafts that can restore corneal defects due to limbal stem cell malfunction 2,7 , but outcomes related to the technique used to prepare the graft still remain to be evaluated 11 . An essential prerequisite of epithelial grafts for long-term restoration of the ocular surface is the presence of cells possessing specific progenitor cell characteristics within the graft tissue. However, there is no definitive marker for BME progenitors, so isolation of an enriched progenitor population using standard cell sorting cytometric techniques is unfeasible. Additionally, during in vitro culture, BME stem cells inevitably undergo differentiation and lose their stem cell phenotype. A parameter that has largely been overlooked in studying BME cell behaviour in vitro is the cell seeding density. The published literature would suggest that intercellular contacts and paracrine signalling are essential for retaining cellular homeostasis in the stem cell microenvironment 12,13 . We speculate that BME progenitor cells may rely on those cues for optimal expansion and maintenance of their properties. These microenvironmental effects in turn depend on the initial cell seeding density. An understanding of this behaviour is highly relevant to clinical applications in BME progenitor cell expansion and delivery to treat ocular surface disease 14 .
In this study, we investigated BME progenitor cell behaviour in vitro in respect to initial cell seeding densities, to reveal the changes in BME progenitor cell proliferation and markers that take place during culture. To evaluate the influence of cell seeding density on cell behaviour, isolated epithelial cells were seeded at 2×10 4 , 5×10 4 and 15×104 cells/cm2. The differentiation trajectory of the cell population was tracked during culture by monitoring changes in expression of p63 15 –19 , cytokeratin19 (CK19) 16 –18 , ATP-binding cassette subfamily G, member 2 (ABCG2) 20,21 and cytokeratin 10 (CK10) 22 –28 . Connexin 50 (Cx50), expressed in the transient amplifying cell population of the cornea but absent from the stem cell population of the limbus 29 –31 , was included in the panel as a potential means to distinguish progenitor populations within the BME cell cultures.
Materials and Methods
BME cell isolation
Rat buccal mucosa tissue was obtained from the oral cavities of 100 g female Wistar rats (n=4, from the Animal Care Unit, South Australia Health and Medical Research Institute, Adelaide, Australia). We isolated buccal tissue from animals under complete anaesthesia based on the guidelines approved by the South Australia (SA) Pathology Animal Ethics Committee. Oral epithelial cells were isolated from the tissue according to previous established protocols with some modification 32 . In brief, tissue was washed several times with sterile phosphate-buffered saline (PBS) containing 100 U/mL penicillin, 100 μg/mL streptomycin, and 250 ng/mL amphotericin B. Samples were then incubated in 2 mg/mL dispase (Sigma Aldrich, NSW, Australia) in MCDB 153 medium (Sigma Aldrich) at 37°C and 5% CO2 for 1 h. The epithelial layer was removed from submucosal connective tissue. The separated epithelial strips were incubated for 10 min in warm (37°C) 0.05% w/v trypsin and 0.02 mM ethylenediaminetetraacetic acid (EDTA) (Sigma Aldrich). The epithelial layer was then gently disaggregated with a needle and micropipette tip in trypsin-EDTA for 5 min to yield a single cell suspension. After addition of MCDB 153 medium containing 10% foetal bovine serum (FBS) (Sigma Aldrich), the cell suspension was centrifuged for 5 min at 200 g. The supernatant was discarded and cells were resuspended in complete MCDB 153 medium: MCDB 153 medium containing 50 pM triiodothyronine (T3) (Sigma Aldrich), 10 ng/mL beta nerve growth factor (R&D Systems), 200 ng/mL hydrocortisone, 5 ng/mL epithelial growth factor (Jomar Bioscience, SA, Australia), 5% insulin-transferrin-selenium (ITS) liquid medium supplement (Sigma Aldrich) and 5% FBS and were incubated in a humidified atmosphere of 5% CO2 at 37°C. Thereafter, 3×10⁴ viable freshly isolated cells were deposited on glass slides by centrifugation at 400 g for 3 min using a Cytospin 4 system (ThermoFisher Scientific, Waltham, MA, USA).
Proliferation studies
BME cells isolated as described above were seeded at densities of 2×10⁴, 5×10⁴ and 15×104 cells/cm2 into CellCarrier 96 well plate (PerkinElmer, Waltham, MA, USA). The seeded BME cells were then cultured for a period of 5 h, 24 h, 48 h, 72 h. 96 h, 120 h and 144 h in complete MCDB 153 medium at 37°C in a humidified atmosphere containing with 5% CO2. To evaluate cell adhesion and proliferation, the media was removed and cells were fixed with 3.7% paraformaldehyde in PBS at room temperature for 15 min then washed two times with PBS before permeabilisation with 0.25% Triton X100 in PBS for 5 min at room temperature. Following three washes in PBS, cells were subsequently stained with 100 μL Hoechst 33342 (2.0 μg/mL, Invitrogen, Carlsbad, CA, USA) in PBS for 15 min at room temperature. Following washing with PBS, cells were imaged with an Operetta high-content imaging system (PerkinElmer). Images were analysed and cell numbers were quantified through nuclei using Harmony software (PerkinElmer).
Cell doubling time was calculated by online software Doubling Time Computing (available from: http://www.doubling-time.com/compute.php). Cell proliferation was also evaluated with a tetrazolium-based colorimetric assay (XTT assay kit; Sigma-Aldrich, Saint Louis, MO, USA), according to the manufacturer’s instructions. Briefly, cells were seeded at seeding densities of 2×10⁴, 5×10⁴ or 15×104 cells/cm2 into flat-bottomed 96-well plates in a final volume of 100 μL of culture medium per well. After the incubation period, 50 μL of the XTT labelling mixture was added to each well. The cells were further incubated for 4 h at 37°C in a humidified atmosphere containing 5% CO2 to allow XTT formazan production. The absorbance was measured with a microplate reader at a wavelength of 450 nm.
Immunofluorescence of epithelial cells
The cytospin smears and epithelial cells cultured on TCPS were fixed with 4% paraformaldehyde for 10 min and were permeabilised with 0.25% Triton X100 for 5 min at room temperature. After washing with sterile PBS without Ca2+ and Mg2+, cells were treated with blocking solution of 10% serum from the species in which the secondary antibody was raised for 30 min to block non-specific binding of the primary antibodies. Samples were then incubated with the selected primary antibody at 4°C overnight. Primary antibodies were specific for p63 (1:200, rabbit polyclonal immunoglobulin (Ig)G, H-137), CK19 (1:100, goat polyclonal IgG, N-13), ABCG2 (1:200, goat polyclonal IgG, D-20), CK10 (1:200, goat polyclonal IgG, K-14), and Cx50 (1:200, mouse monoclonal IgG, B-11). All antibodies were purchased from Santa Cruz Biotechnology (Santa Cruz, CA, USA). Positive and negative controls of immunofluorescence experiments were included to support the validity of staining and identify experimental artefacts. After washing the cells three times in PBS for 5 min each wash, cells were incubated with secondary antibody at room temperature for 60 min. Secondary antibodies were donkey anti-rabbit (FITC), donkey anti-goat (FITC), donkey anti-goat (PE), donkey anti-mouse (FITC) and donkey anti-mouse (CFL 555) at a dilution of 1:200 in PBS containing 1% bovine serum albumin. Counterstaining was performed with Hoechst 33342. Marker expression levels (% positive cells) were assessed by identifying cell nuclei and scoring the co-localised marker expression (nuclear or cytoplasmic as appropriate) as positive or negative. Immunofluorescence analysis was repeated in four independent experiments for each marker. Marker expression scores of a subset of differentiation and stem cell markers were verified using the Operetta high-content imaging system (PerkinElmer). Nuclei were detected using the 4’,6-diamidino-2-phenylindole (DAPI) channel and each nucleus was identified as an object representing a cell. The cytoplasmic region was defined around each nucleus using either fluorescence in the PE or FITC channels. Cell fate and extent of differentiation were obtained by dividing the number of identified positive cells by the total number of cells. Analysis was performed after isolation and incubation time of 5, 24, 48, 72, 96, 112, and 144 h on TCPS.
Statistical analysis
The significance of differences observed between the numbers and proportions of cell populations attached on microarray spots were determined by analysis of variance followed by Tukey’s posthoc test. P<0.05 was regarded as significant.
Results
Analysis of stem cell marker expression in BME populations after isolation
In order to establish a baseline for comparison with later ex vivo cultures, the progenitor content of fresh BME isolate was assessed by immunocytochemistry. The expression of a panel of several cell markers consisting of proteins associated with progenitor epithelial populations (CK19, ABCG2, p63) and differentiated epithelial cells (CK10) was used to assess the identity of the freshly isolated epithelial cell suspensions before seeding on TCPS (Fig. 1). Freshly isolated cells were deposited on glass slides by centrifugation for immunofluorescence analysis.

Immunofluorescence staining of freshly isolated BME cell suspensions, revealing the expression of proteins associated with differentiation and progenitor status before seeding on TCPS. (A) Expression of CK19 (labelled green) and Cx50 (labelled red) were visualised using immunocytochemistry. (B) ABCG2 surface expression (red). Blue signals indicate nuclei of epithelial cells which were stained using Hoechst 33342. (C) Isolated BME cells were labelled for p63 (green) and CK10 (red) expression. (D) p63/CK10 labelled population shown in (C) counterstained with Hoechst 33342. (E) Quantification of marker protein expression in epithelial cells after isolation and prior to seeding on TCPS. The error bars represent the standard error. n=4.
CK19, a progenitor marker in both the limbus and buccal mucosal epithelium 26,33,34 was observed in 51 ± 5% of isolated cells. A high proportion of the isolated cell population (62 ± 2%) expressed p63. Expression of p63 is also associated with progenitor populations in both the buccal mucosa and limbus and was used as a predictor of long-term corneal regeneration after transplant of cultivated epithelial cell sheets 15 –19 . ABCG2 is expressed in a subset of p63+ cells in the limbus, and is proposed to define the stem cell population from transient amplifying progenitor cells 20,21 . It has been reported to mark cell populations in cultivated BME cell sheets. ABCG2 was detected in 31 ± 6% of the cell population. CK10, known to be present in differentiated suprabasal cells within multilayered epithelium 22 –28 , was employed as a negative selection marker. CK10 was expressed by 33 ± 9% of isolated cells. Together, this analysis showed that a progenitor/stem-cell-containing population was successfully isolated from oral mucosal tissue.
Interestingly, the majority of isolated cells (93 ± 1%) of epithelial cells expressed Cx50. Cx50, a gap junction constituent, is expressed within all layers of the corneal epithelium but is excluded from the limbus 29,30 , where the most primitive stem cells are thought to reside. Hence it is a potential marker to differentiate stem cells from transient amplifying cell progeny 31 . In this context, and distinct from the expected peripheral localisation, Cx50 expression was noted to be entirely localised to the nucleus.
Seeding density influences cell proliferation and stem cell marker retention in BME cell cultures
In order to understand the influence of seeding density on ex vivo BME cultures, the isolated epithelial cells from the oral cavities of four rats were seeded in quadruplicate at initial densities of 2×10⁴, 5×10⁴ and 15×104 cells/cm2 onto TCPS. Initially cells were allowed to attach to TCPS surfaces for 5 h before observation. While in the literature, incubation times from 10 min to overnight have been cited for incubation of BME on the substrate 2,35,36 , we observed that a 5 h incubation time provided enough time for cells to adhere on the surface; and that this incubation time was suitable to obtain a high fraction of cells expressing stem cell markers 37 . Cell attachment varied directly with the initial cell seeding density (Fig. 1). At the lowest cell density tested, 2×10⁴ cells/cm2, very few cells (around 710 cells/cm2) attached to TCPS, which was significantly (P≤0.005) lower than for the other initial cell seeding densities. The images presented in Fig. 2A show that cell proliferation was most successful at an initial density of 5×10⁴ cells/cm2. By comparison, seeding at lower cell density (2×10⁴ cells/cm2) or higher cell density (15×104 cells/cm2) gave reduced proliferation after 96 h in culture. As seen in Fig. 2B, the proliferation rate of the BME cells on the TCPS substrate varied considerably, depending on the seeding density. At cell seeding densities of 5×10⁴ and 15×104 cells/cm2, cell numbers increased 2.5-fold and 1.5-fold, respectively, after 144 h in culture, while for cells at the lowest cell seeding density, there was no appreciable change in cell number during 144 h in culture. The maximum proliferation rate was attained at an initial seeding density of 5×10⁴ cells/cm2 with a doubling time of 45 h. At seeding densities higher and lower than 5×10⁴ cells/cm2, the proliferation rate decreased. Under the same culture conditions, the doubling time for initial cell seeding density of 2×10⁴ cells/cm2 was 140 h and for the highest cell seeding density of 15×104 cells/cm2, the doubling time was 74 h. The cell number reached a maximum at 72 h for cultures seeded at a density of 15×104 cells/cm2 and at 96 h for cultures seeded at 5×10⁴ cells/cm2. Proliferation of the cultured cells was also evaluated by XTT assay (Fig. 2C). The findings correlated with cell counting.

The effects of initial cell density on proliferation of BME cells. (A) Fluorescence staining of BME cell after 96 h in vitro, cytoplasm was stained with Phalloidin (red) and nuclear was stained with Hoechst 33342 (blue). The initial seeding density is shown left of image. (B) BME cell number on TCPS from 5 h to 144 h incubation time at 37°C, 95% humidity and 5% CO2. Cells were seeded at different density of 2×10⁴, 5×10⁴ and 15×104 cells/cm2. (C) Cell proliferation was measured by XTT assay. Error bars show the standard error of cell counts. n=4, a = P≤0.01, b = P≤0.005.
We next investigated whether, in addition to influencing the rate of cell proliferation, cell seeding density would affect the differentiation of BME cells during culture via paracrine signalling and other forms of cell–cell communication. An analysis of surface marker expression indicative of stemness or differentiation was carried out each day with the same panel of markers used to assess the BME isolate (Figs. 3 –5). Expression of the stem cell and progenitor markers CK19, ABCG2 and p63 was down-regulated during the observation period for all seeding densities tested (Figs. 3 and 4). However, comparison of the expression of these markers over the 144 h time period revealed changes in the rate of cell differentiation of BME cells that were dependent on the initial seeding density of these cultures. For example, an inverse correlation between initial seeding density and expression of CK19 was noted. A rapid decline in CK19 expression was already evident 5 h after seeding at the highest cell density tested (15×104 cells/cm2). CK19 expression remained around 10% higher in cultures seeded at 2×10⁴ cells/cm2 compared with cultures seeded at 15×104 cells/cm2 throughout the culture period (Fig. 4A). Likewise, ABCG2 expression was retained at a higher level in cultures seeded at 2×10⁴ cells/cm2 than those seeded at higher densities (P≤0.01 from 24 h to 144 h), resulting in 50±3.5% ABCG2 positive cells at the end of culture, 30% higher than the proportion of ABCG2 positive cells in the other cultures (Fig. 4B). For cultures seeded at 15×104 cell/cm2, CK19 and ABCG2 expression was confined to rare small cell clusters sporadically distributed across the cultured population. Immunocytochemical analysis showed these markers to be expressed more homogeneously across the cultures seeded at 2×10⁴ cell/cm2 cells (Fig. 5D, E). The expression profile of the differentiated epithelial cell marker CK10 also indicates a correlation between cell density and differentiation: throughout the culture period, the proportion of CK10 positive cells in cultures seeded at higher densities exceeds those seeded at 2×10⁴ cells/cm2 by greater than 10%.
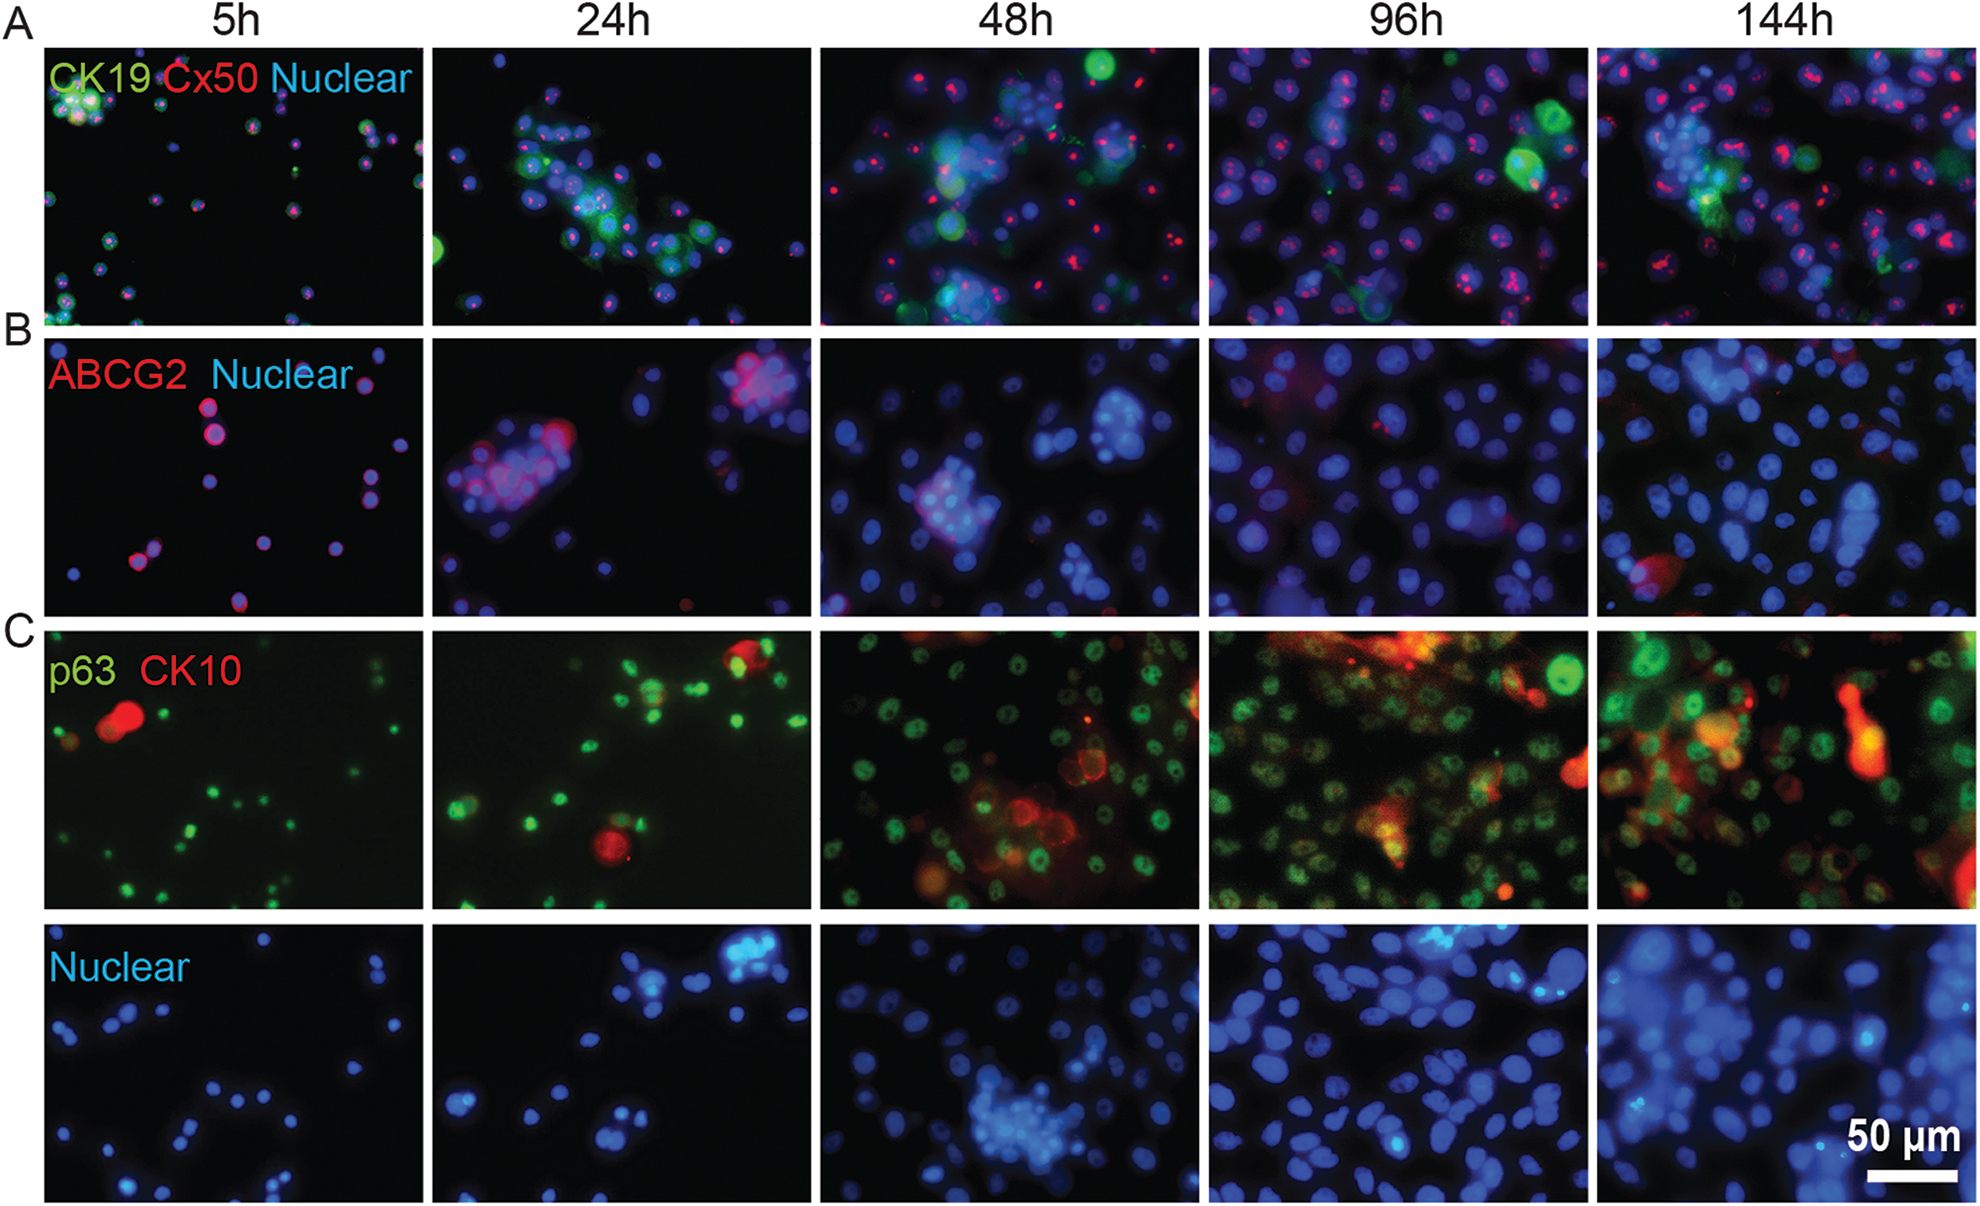
Immunofluorescence staining of cultured BME cells against stem cell and differentiation markers at intervals during 144 h culture. BME cell cultures were seeded at a density of 5×10⁴ cells/cm2. Expression of the marker panel was probed at 24 h intervals after the first day of culture. (A) CK19 (green) and Cx50 (red), (B) ABCG2 (red), (C) p63 (green) and CK10 (red); counterstained panel is shown in second row. Cell populations were counterstained using Hoechst 33342.

Effect of initial cell seeding density on epithelial cell marker expression over the course of 144 h. (A) The expression level of CK19. (B) The expression level of ABCG2. (C) The expression level of p63. (D) The expression level of CK10. (E) The expression level of Cx50. Cells were plated at densities of 2×10⁴, 5×10⁴ and 15×104 cells/cm2. Cells were stained for the specific markers and subsequently quantified by high-content microscopy. The error bars represent the standard error. n=4.

Epithelial cell marker expression is dependent on initial seeding density. In all panels, blue signal marks the nuclei of epithelial cells, stained with Hoechst 33342. (A) Cells were plated at 2×10⁴ cells/cm2 and cultured for 96 h, then were stained against CK19 (green) and Cx50 (red). Yellow arrows mark loss of Cx50 expression in cells that are spatially isolated and possess limited cell contact. (B) Cells were plated at 2×10⁴ cells/cm2 and cultured for 96 h, then were stained against ABCG2 (red). (C) Cells were plated at 2×10⁴ cells/cm2 and cultured for 96 h, then were stained against p63 (green) and CK10 (red). Corresponding Hoechst 33342 staining is shown in the right panel. (D) Cells were plated at 15×104 cells/cm2 and cultured for 96 h, then were stained against CK19 (green) and Cx50 (red). (E) Cells were plated at 15×104 cells/cm2 and cultured for 96 h, then were stained against ABCG2 (red). (F) Cells were plated at 15×104 cells/cm2 and cultured for 96 h, then were stained against p63 (green) and CK10 (red). The corresponding nuclear staining is shown in the right panel.
In contrast with ABCG2 and CK19, expression of p63 was best maintained using an intermediate cell density (5×10⁴ cells/cm2). Little difference in p63 expression was seen 15,16 between cultures seeded at 2×10⁴ cells/cm2 and 15×104 cells/cm2. In addition to stem cells 38 , p63 is also expressed by young early transient amplifying cells in the buccal epithelium 10 . The increase in p63 expression noted in cultures seeded at 5×10⁴ cells/cm2 compared with cultures seeded at higher and lower densities might reflect the greater proportion of partially differentiated progenitor cells in these populations.
Cx50 expression was down-regulated during the culture period at all seeding densities. Expression in cultures seeded at 15×104 cells/ cm2 rapidly decreased from 87±3% to 33.5±4% after 144 h. However, cells seeded at 2×10⁴ and 5×10⁴ cells/cm2, retained Cx50 expression at 71±4% and 70±6.5% of the BME cell population, respectively, after 144 h in culture. Similar to the pattern observed in freshly isolated BME cells, Cx50 was again observed to localise almost entirely to the cell nucleus across all time points and culture conditions. Loss of Cx50 expression was noted in cells spatially isolated from other cells (Fig. 5A). The down-regulation of Cx50 expression more closely reflected trends seen in ABCG2 and CK19 than CK10, suggesting Cx50 levels are indicative of progenitor content, rather than differentiation, in these BME cultures.
Discussion
The transplant of ex vivo cultivated buccal epithelial cells is now an established means to treat limbal stem cell deficiency, with treated patient cohorts numbering in the hundreds 14,39,40 . Increased interest in this technique has led to the recent establishment of a rat animal model to optimise surgical parameters 41 . In this study, we describe how adherence to TCPS may be used to isolate and propagate progenitor cell-rich populations from rat BME cells. We demonstrate that TCPS, the conventional substrate for laboratory tissue culture, is able to support robust cell proliferation, without necessitating the use of feeder layers. This work therefore contributes to the current drive in the field to obtain defined conditions for tissue engineered epithelial cell sheets 9,42,43 .
BME cells were observed to attach to TCPS surfaces within 5 h. Based on surface marker expression of CK19, ABCG2 and p63, the proportion of stem cells in this population adherent on the surface of the TCPS at this time was higher compared with freshly isolated cells, indicating a positive selection effect. BME cells on TCPS after 5 h incubation also contained fewer CK10 positive cells compared with freshly isolated cells. This suggests that the progenitor cell population can be partially enriched through selective adhesion to TCPS. Similar results were observed in previous studies in which limbal stem cells were partially purified from mixed cell populations based on attachment to a collagen-based substrate 31 .
Continued culture of the BME isolate on TCPS revealed that the extent of growth and the doubling time of BME cells varied depending on the initial cell density. A dependence of cell proliferation on the cell seeding density has been shown in prior studies with other primary cells 37,44 –47 . The increased rate of proliferation observed when seeded at higher densities may be associated with transition to differentiation, which is supported by the higher proportion of differentiated cells appearing under these conditions. A minimum seeding density (greater than 2×10⁴ cells/cm2) was required to initiate cell proliferation. Little or no net growth is often observed below a critical initial cell density 12,13,48 , which has been attributed to a paucity of intracellular contacts and paracrine signals 12 . Previous work comparing the cultivation of canine oral mucosal epithelial sheets at different densities on microporous cell culture inserts noted that cell sheet integrity and stratification was optimal when cultures were seeded at a similar density (4–5×10⁴ cells/cm2) 43 .
Subsequently, immunofluorescence staining was employed to examine how the marker expression profile of the BME cell populations varied as culture on TCPS progressed, since changes in differentiation rate in response to initial cell seeding density have also been described for other cell types such as human umbilical vein endothelial cells and mesenchymal stem cells 12,49,50 . We examined both putative progenitor (CK19, ABCG2 and p63) and differentiation markers (CK10 and Cx50). Upon comparing the BME cell marker expression profiles with respect to cell seeding density during 144 h culture, significant differences in the expression of markers were observed. The expression of the BME progenitor cell marker ABCG2 when cells were seeded at very low density was 4.3-fold and 2.5-fold higher than when cell seeding density was 5×10⁴ and 15×104 cells/cm2, respectively. The deviation in differentiation trajectory between cultures seeded at 2×10⁴ cells/cm2 and those seeded at higher densities was evident from early in the culture. In several cancer cell models, ABCG2 positive cells have been noted to be tolerant of low seeding density 35,51 ; conversely, ABCG2 expression is increased at low cell densities 52 . The initial cell seeding density affected CK19 expression in a similar manner to ABCG2, but the influence of density was less marked. Expression of the differentiated cell marker CK10 also indicated that stem cells are best retained at low seeding densities. In all three cell density groups, the percentage of CK10 positive cells increased with time in culture, indicating differentiation is present even at the lowest seeding densities, where growth appears almost arrested.
The retention of progenitor markers at low cell densities may reflect the limited capacity of epithelial stem cells to participate in intercellular signalling 53 . In light of this, both the high proportion of cells expressing Cx50 and the nuclear localisation of this protein were intriguing. While Cx50 has been used as a negative selection marker for limbal epithelial stem cells 33 , there are no direct data comparing the expression of Cx50 in BME cell cultures. In our hands, Cx50 negative cells occurred as a very rare population in low density cultures, and only in cells that did not contact other BME cells in these cultures. Cx50 is typically localised to the plasma membrane where gap junction channels are formed between cells, but has also been reported in the nucleus 54 . Connexins have been revealed to possess a number of functions in addition to gap function intercellular communication, which include growth regulation and differentiation control 55 . Nuclear expression of Cx50 has recently been reported in ependymal stem cells, which lose expression upon differentiation 56 . We observed a similar down-regulation of Cx50 expression in cultures with higher levels of differentiation (as assayed by CK10 content).
In summary, surface marker analysis across the course of the 6-d culture indicated that lower cell seeding densities were beneficial for the retention of stem cell characteristics in the BME cell population. However, cell proliferation in cultures seeded at the lowest density trialled (2×10⁴ cells/cm2) was limited. Transplantable ex vivo cultured BME grafts must form a confluent monolayer of cells, ideally featuring a high progenitor component to facilitate a successful graft. In this culture system, high cell proliferation must be balanced against maintenance of the progenitor cell population. A seeding density of 5×10⁴ cells/cm2 both retains high stem cell marker expression, particularly of p63, and promotes robust growth.
To conclude: a range of ‘microenvironment’-related features must be optimised to ensure maintenance of BME stem cells properties for cell therapy. This study confirms that cell density is a controlling factor of BME cell proliferation and differentiation. Controlling the initial cell seeding density may enhance cell proliferation, thus potentially leading to differentiation. Here, we have demonstrated that seeding densities of 5×10⁴ and 15×104 cell/cm2 appeared to be associated with enhanced BME cell proliferation. Cells seeded within this seeding density range also demonstrated pronounced cell differentiation as confirmed by immunofluorescence staining of the cell markers. However, at a low cell seeding density of 2×10⁴ cell/cm2 poor cell proliferation but strong maintenance of stem cell markers was observed. Therefore, initial cell seeding density should be considered to investigate the effect of microenvironment on cell behaviour. The results of this study provide useful information with regard to the optimisation of tissue engineering protocols for culturing epithelial cells.
Footnotes
Ethical Approval
Approval was obtained from the institutional animal care and use committee at SA pathology (114A/12).
Statement of Human and Animal Rights
This study was carried out according to the recommendations of guidelines for laboratory animal care and safety from the Australia Health and Medical Research Institute and University of South Australia.
Statement of Informed Consent
The Statement of Informed Consent is not applicable in this study.
Declaration of Conflicting Interests
The authors declared no potential conflicts of interest with respect to the research, authorship, and/or publication of this article.
Funding
The authors disclosed receipt of the following financial support for the research, authorship, and/or publication of this article: This work was supported by ‘NHMRC Australia Project grant’, grant agreement No. 595901.