
Abstract
The subcutaneous adipose tissue provides a clear advantage over other mesenchymal stem cell sources due to the ease with which it can be accessed, as well as the ease of isolating the residing stem cells. Human adipose-derived stem cells (hADSCs), localized in the stromal–vascular portion, can be isolated ex vivo using a combination of washing steps and enzymatic digestion. In this study, we report that microfragmented human lipoaspirated adipose tissue is a better stem cell source compared to normal lipoaspirated tissue. The structural composition of microfragments is comparable to the original tissue. Differently, however, this procedure activates the expression of antigens, such as β-tubulin III. The hADSCs derived from microfragmented lipoaspirate tissue were systematically characterized for growth features, phenotype, and multipotent differentiation potential. They fulfill the definition of mesenchymal stem cells, although with a higher neural phenotype profile. These cells also express genes that constitute the core circuitry of self-renewal such as OCT4, SOX2, and NANOG, and neurogenic lineage genes such as NEUROD1, PAX6, and SOX3. Such findings suggest further studies by evaluating Microfrag-AT hADSC action in animal models of neurodegenerative conditions.
Keywords
Introduction
Autologous transplant of adipose tissue is an established therapeutic procedure used for the repair of a variety of tissue damage. Recent biological studies have shown that the potential for tissue regeneration can be enhanced using adipose-derived stem cells (ADSCs) (13). The subcutaneous adipose tissue provides a clear advantage over other mesenchymal stem cells (MSCs), due to the ease with which adipose tissue can be accessed (under local anesthesia and with minimum patient discomfort), as well as the ease of isolating stem cells from the harvested tissue (8, 36). Stem cell frequency appears to be significantly higher in adipose tissue than in bone marrow (4). MSCs are multipotent, self-renewing cells with the capacity to differentiate, in vitro, into cells of mesenchymal origin, including osteoblasts, adipocytes, and chondrocytes that give rise to bone, fat, cartilage, and muscle tissues in vivo (40).
Human ADSCs (hADSCs) localize in the stromal–vascular fraction (SVF) of subcutaneous adipose tissue (9) that consists of a heterogeneous mesenchymal population of cells including adipose stromal and hematopoietic stem and progenitor cells, endothelial cells, erythrocytes, fibroblasts, lymphocytes, monocyte/macrophages, and pericytes (12, 33).
When SVF cells are seeded into a culture, a subset of elongated cells begins to adhere to the tissue culture plasticware. These cells can be further purified using a combination of washing steps and culture expansion with media similar to that used for bone marrow MSCs in order to deplete most of the hematopoietic cell population from the SVF cells and differentiate them into classical mesodermal tissues (like bone, fat, and cartilage) after isolation and under specific stimuli (55). According to recent reports, hADSCs (with appropriate stimuli) can differentiate into neurons, cardiomyocytes, hepatocytes, and pancreatic cells (44, 46) and possess clinical potential for vasculogenesis (28), osteogenesis (45), and neuronal repair (52).
The International Society of Cell Therapy has provided guidelines for the definition of MSCs based on (a) their plastic adhesion proprieties, (b) immunophenotype (CD73+, CD90+, CD105+, CD166+, CD11b/14-, CD19/CD73b-, CD34-, CD45-, HLA-DR-), and (c) multipotent differentiation potential (adipogenic, chondrogenic, and osteogenic) (6, 10).
In this study, we report that human microfragmented adipose tissue (mean fat particle areas 1,036 ± 0.106 μm2 for a cluster of cells), although structurally and cellularly comparable to original adipose tissue, presents a sensibly higher number of stromal cells positive for β-tubulin III and results in an optimal source of hADSCs that does not require enzymatic treatment for obtaining MSCs. This latter property is preserved as such even after storage at −80°C. The resulting hADSCs have cell surface markers and differentiation properties typical of MSCs but are highly enriched in classical neuronal protein markers.
Materials and Methods
Ethical Disclosure
The ethical committee of the University of Milan approved the design of this study. Thirty subjects (11 males and 19 females between the ages of 28 to 80 years) were enrolled at Istituto Image (Milan, Italy). An informed consent was obtained from all the patients. All specimens were verified for the presence of HIV (1 and 2), hepatitis C virus, hepatitis B virus, and cytomegalovirus. All specimens tested negative (demographic characteristics are detailed in Supplementary Table 1, https://sites.google.com/site/goriolab/).
Lipogems Processor LGP P0
This equipment is a mechanical automatic shaker that has been designed and constructed to function in conjunction with Lipogems® device LP1 Main and LP3 Main (Lipogems International SRL, Milan, Italy), which are constructed according to EC directives (PTC/IB2011/052204). Patients' lipoaspirated tissues were introduced into the Lipogems® device containing the beads that are responsible for the fragmentation of the fat tissue. Lipogems® Processor LGP P0 determines the force and direction of bead shaking, while the duration of mechanical fragmentation is determined by the specification of the washing time (50) that promotes the elimination of liquid lipidic fraction (oil) and hematic tissue remnants originally present in the patient lipoaspirate. The space orientation of the Lipogems® device, the frequency of shaking, and the acceleration of the beads can be selected according to the desired conditions. In our specific case, the fragmentation was achieved using these parameters: shaking time 6 min, oscillation frequency five cycles/s, pitch frequency 0.3 cycle/s, and pitch axis −40°.
Histological Analyses of Lipoaspirate Tissue and Microfragmented Lipoaspirate
Histological analyses were performed on fresh or cryopreserved lipoaspirated adipose tissue (with or without microfragmentation) on samples coming from the same subject. Briefly, formalin-fixed (overnight, 4°C) and paraffin-embedded tissue samples were processed for conventional histopathological examination and immunohistochemistry. Standard 4-μm-thick tissue sections were stained with hematoxylin and eosin (Sigma-Aldrich, St. Louis, MO, USA) and were examined by direct wide-field light microscopy. Four immunohistochemistry, paraffin samples were sectioned (4 μm thickness), deparaffinized, and rehydrated in xylene (VWR International, Radnor, PA, USA) and graded concentrations of ethanol to distilled water. Then they were rinsed with phosphate-buffered saline (PBS; Life Technologies, Carlsbad, CA, USA), treated with blocking solution [PBS + 1% V/V fetal bovine serum (FBS; Euroclone, Pero, MI, Italy, for 1 h at room temperature], and incubated with primary antibodies overnight at 4°C. After treatment with primary antibodies, the sections were washed with PBS and incubated with appropriate secondary antibodies. Antigen-retrieval slides were placed in a water bath containing ethylendiaminetetraacetic acid 1 mM, pH 9.0 (EDTA; Sigma-Aldrich) for 30 min at 95°C. Endogenous peroxidase activity was quenched with 3% hydrogen peroxide (Carlo Erba, Milan, Italy) in distilled water for 10 min. Staining was performed with 3,3′ diaminobenzidine (Dako EnVision detection kit, Cernusco sul Naviglio, Milan, Italy) as a chromogen. In control determinations, primary antibodies were omitted and replaced with equivalent concentrations of unrelated IgG of the same subclass. The following primary antibodies were used: vimentin (1:5,000; Dako Cytomatic Cernusco sul Naviglio, Milan, Italy), S100 (1:2,000; Novocastra, Leica Microsystems Srl, Milano, Italy), microtubule-associated protein 2 (MAP-2; 1:500; Chemicon, Billerica, MA, USA), glial fibrillary acidic protein (GFAP; 1:500; Dako Cytomatic), β-tubulin III (1:6,000; Covance, Rome Italy), human nestin (1:2,000; Millipore, Vimodrone, Milan, Italy), and Nanog (1:1,000; Novus, Littleton, CO, USA). Immunoreactivity was evaluated, and positive cells were quantified using 50 high-magnification histological fields (40×). Results were expressed as number of positive cells per histological power field (hpf).
For immunofluorescence studies, sections (4 μm thick) were rinsed with PBS, treated with blocking solution (as above), and incubated with the following primary antibodies: anti-β-tubulin III (1:6,000; Covance), anti-vimentin (1:5,000; Dako Cytomatic), and anti-FABP4 (1:200; Cell Signaling Technology, Beverly, MA, USA) overnight at 4°C. After treatment with primary antibodies, sections were washed with PBS and incubated with secondary antibodies (Alexa Fluor® 555 goat anti-mouse or Alexa Fluor® 488 goat anti-rabbit 1:1,000; Molecular Probes®, Invitrogen, Life Technologies, Carlsbad, CA, USA) for 2 h at room temperature. Sections were washed in PBS, nuclei were stained with 4′,6-diamidino-2-phenylindole (DAPI) (1:1,000) and then mounted using the FluorSave Reagent (Calbiochem, Merck Chemical, Darmstadt, Germany). Sections were analyzed by confocal microscopy. As negative reference for the confocal analysis, we used consecutive sections that were stained by omitting primary antibodies and replaced them with equivalent concentrations of unrelated IgG of the same subclass. The zero level was adjusted on this reference and used for all of the further analyses (we used a new zero reference for each new staining). β-Tubulin III-positive cells were counted in four fields taken in the same section. The β-tubulin III-positive cells were present in a group of three consecutive sections that were averaged. We repeated this count each 100 μm. Results were expressed as percent of positive cells per hpf. DAPI supplied the total number of cells since it is a nuclear staining. This quantification was performed with sections from three different patients.
Isolation and Culture of Human Adipose Tissue-Derived Mesenchymal Stem Cells (hADSCs)
Human adipose tissue samples were obtained from elective liposuction procedures under local anesthesia (lidocaine; AstraZeneca, London, UK). This procedure involved an infiltration step in which a solution of saline and the vasoconstrictor epinephrine (2 μg/ml; Key Customer Solutions S.A.S, Basiglio, Milan, Italy) was infused into the adipose compartment to minimize blood loss and contamination of the tissue by peripheral blood cells.
hADSCs From Lipoaspirates
Stem cells from lipoaspirates were purified following previously published methods to obtain cells from the stromal-vascular portion in the presence of enzymatic digestion with liberase H1 (Roche Applied Sciences, Monza, Italy) in PBS for 30 min at 37°C (23, 39). Enzyme activity was neutralized with an equal volume of Dulbecco's modified Eagle's medium (DMEM-low glucose; Euroclone) containing 10% FBS, and the infranatant was centrifuged for 10 min at 920 × g (1). The cellular pellet was dissolved in the same media utilized for Microfrag-AT hADSCs (see below). The resulting cell populations were termed processed lipoaspirate (PLA)-derived MSCs (PLA-derived hADSCs).
hADSCs From Mechanically Microfragmented Lipoaspirate
Stem cells from microfragmented lipoaspirated product, by means of the Lipogems® device, were obtained either by product processing through centrifugation or direct seeding of microfragmented product into the medium culture. In the course of processing, the centrifugation was at 920 × g for 10 min, and pellets were dissolved in αMEM (Euroclone) supplemented with 20% FBS, antibiotics (1% penicillin/streptomycin, 0.3% amphotericin B; Euroclone), and l-glutamine (1%; Euroclone) or in stem cell medium (SCM) consisting of DMEM/F12 (Euroclone), 20 μg/L human recombinant epidermal growth factor (EGF; Life Technologies), and 10 μg/L basic fibroblast growth factor (bFGF; Life Technologies), 2 mmol/L L-glutamine, 33 mmol/L glucose, 9.26 g/ml putrescine, 6.3 μg/L progesterone, 5.3 μg/L sodium selenite, 0.0025 g/L insulin, and 0.1 g/L grade II transferring sodium salt (Sigma-Aldrich) (2) supplemented with 10% FBS and antibiotics (as above). As a control, a share of all samples of microfragmented adipose tissue were treated with liberase H1, as described before, and the pellet was dissolved in the same culture media used above. The resulting cell populations were termed Microfrag-AT-derived hADSCs.
All cell cultures were maintained at 37°C in a humid atmosphere containing 5% CO2. After 2 weeks, the nonadherent fraction was removed, and the adherent cells were cultured continuously, while the medium was changed every 3 days. Before seeding, cell samples were tested for viability by means of trypan blue (Sigma-Aldrich) exclusion test. To prevent spontaneous differentiation, cells were maintained at a subconfluent culture level; therefore, when both SCM cells and αMEM cells reach 85% confluence, they were detached from the plate by 0.05% trypsin/EDTA solution (Euroclone), collected by centrifugation (520 × 5 min), and expanded in culture for many passages or cryopreserved at −80°C in the presence of dimethyl sulfoxide (DMSO; 10%; Sigma-Aldrich). After 4 weeks (or later, up to 12 months) cells were recovered from cryopreservation and kept in culture with αMEM medium or SCM.
Cell Growth Analysis
Analysis was performed by cell counting to determine the proliferative capacity of hADSCs obtained from microfragmented adipose tissue and PLA-derived hADSCs from six patients, which were maintained in culture (either in αMEM or SCM). The analyses were performed for cells at culture passage 2, fresh, and cryopreserved for 1 month or more. Cells were seeded onto 48-well culture plates (Corning Life Sciences, Corning, NY, USA) and maintained in culture in growth medium. Live cells were counted by trypan blue exclusion at 85% confluence. Cell doubling times (DT) and numbers (CD) were calculated from hemocytometer counts (Neubauer Chamber; VWR International Radnor, PA, USA) and cell culture time (CT) for each passage by the following formula: CD = ln(Nf/Ni)/ln2 and DT = CT/CD, where DT is the cell doubling time, CT is the culture time, CD is the cell doubling number, Nf is the final number of cells, and Ni is the initial number of cells. The experiments were performed at least three times for each point reported in the curve (41, 48).
Cell Cycle and G-Banding Karyotype Analyses
Cell cycle analyses were performed by using the propidium iodide (PI; Sigma-Aldrich) incorporation method (38). Briefly, 5 × 10⁵ cells were collected and fixed for 15 min at 4°C in ice cold (-20°C) 70% ethanol. The fixed cells were resuspended and centrifuged. The cell pellet was treated with RNase (Sigma-Aldrich) to remove RNA and stained with 25 μg/ml PI at 37°C for 1 h in the dark. DNA content was analyzed by Cytomics FC 500 (Beckman Coulter, Cassina de Pecchi, Milan, Italy). Under these conditions, quiescent cells (G0/G1) were characterized by the minimal RNA content and uniform DNA content. The results of the study were expressed as mean ± SEM. Cytogenetic analyses were performed on in situ cultures obtained by inoculating Microfrag-AT hADSCs directly onto a coverslip inside Petri dishes containing 2 ml of media (αMEM or SCM). Cells were treated with colcemid (0.02 μl/ml; Life Technologies) for 90 min in hypotonic solution (1:1 Na citrate 1%/Nacl 0.3%; Sigma-Aldrich) and fixative solution of 3:1 methanol/acetic acid (VWR International) that was replaced twice. At least 25 QFQ banding metaphases were observed for each sample. The images were acquired using a fluorescence microscope (BX 60 Olympus) and analyzed with the Powergene PSI system (Newcastle upon Tyne, UK).
Immunophenotipic Characterization
Cultures of Microfrag-AT hADSCs at different passages were phenotypically characterized by fluorescence-activated cell sorting (FACS). After trypsinization, cells were washed, and 1 × 10⁵ cells were resuspended in 250 μl PBS w/o Ca2+ and Mg+ for staining with the following antibodies: anti-CD44 (BD Biosciences, Milan, Italy), anti-CD90 (Millipore), anti-CD34 (Mylteni Biotec, Calderara di Reno, BO, Italy), anti-CD45 (BD Biosciences), anti-CD146 (Biocytex USA), anti-CD31 (Mylteni Biotec), anti-CD56 (Mylteni Biotec Italy), anti-CD105 (Serotec, Biorad, Segrate, MI, Italy), anti-CD144 (R&D Systems, Minneapolis, MN, USA), anti-CD166 (BD Biosciences), anti-CD133/2 (Mylteni Biotec), anti-CD73 (BD Biosciences), and antivascular endothelial growth factor 2 (VEGFR2; R&D Systems). All antibodies were used at a final concentration of 1 μg/250 μl. Samples were fixed with 4% paraformaldehyde (Sigma-Aldrich) and then analyzed by flow cytometry (FACS Vantage; BD Biosciences) using a specific software (CellQuest Pro; BD Biosciences). The same procedure was utilized in the immunophenotypic characterization of hADSCs obtained from cryopreserved (1 month or later) mechanically microfragmented product and for PLA-derived hADSCs. The results of the analysis were expressed as mean ± SEM.
Indirect Immunofluorescence of hADSCs Obtained From Microfragmented Adipose Tissue
After seeding (3.5 × 10³ cells/cm2) onto glass slides, cells were grown until 85% confluence. They were then fixed with 4% paraformaldehyde. After saturation [4% BSA (Sigma-Aldrich), 0.3% Triton X-100 (VWR International)] and permeabilization, cells were incubated overnight at 4°C with primary antibodies against human nestin (clone #196908, 1:200; R&D Systems), vimentin (polyclonal, 1:100; Santa Cruz, Heidelberg, Germany), GFAP (polyclonal, 1:1,000; Covance), octamer-binding transcription factor 4 (OCT4; clone 81, 1:400; Chemicon), β-tubulin III (clone TUJ1, 1:500; Covance), MAP-2 (polyclonal, 1:200; Millipore), and erythropoietin receptor (EpoR; clone H-194, 1:200; Santa Cruz). Cells were rinsed and then probed 45 min with secondary antibodies Alexa Fluor 488 or 543 anti-mouse, rabbit, or goat (Invitrogen). Nuclei were counterstained with DAPI (2 μg/ml in PBS; Sigma-Aldrich), and glasses were mounted with FluorSave™ (Millipore). Images were taken using a Leica SP2 confocal microscope with He/Kr and Ar lasers (Heidelberg, Germany). In negative control experiments, primary antibodies were replaced with equivalent concentrations of unrelated IgG of the same subclass. The quantification of positive cells was performed by considering a minimum of nine independent fields (three fields/three coverslips/treatment) of photomicrographs captured with a 20× objective. Total counts of each marker of immune-reactive cells were performed, and the number of positive cells was expressed as the percentage to the total cells. DAPI supplied the total number of cells since it is a nuclear staining.
RNA Extraction and qRT-PCR Analyses
Total cellular RNAs were extracted using TRI Reagent® (Sigma-Aldrich), according to the manufac turer's instructions. RNA purity and quantity were assessed by Nanodrop (Fisher Scientific, Illkirch Cedex, France) (A260/A280 1.8–2 was considered suitable for further analysis), possible contaminating DNA was removed, and cDNA was prepared from 1 μg of RNA using high- capacity RNA-to-cDNA Kit (Applied Biosystems).
Quantifications of all gene transcripts were performed by real-time retrotranscriptional polymerase chain reaction (RT-PCR) using a TaqMan® Array Plate 32 (Life Technologies) on Step One Plus™ (Applied Biosystems) for the expression of 18s rRNA, and GAPDH, HPRT1, and GUSB detection were used as the internal controls. The primer pairs used were a) SOX2, Hs01053049_s1; b) NANOG, Hs04260366_g1; c) OCT4, Hs04260367_gH; d) nestin, Hs04187831_g1; e) NEUROD1, Hs01922995_s1; f) PAX6, Hs00240871_m1; g) SOX3, Hs00271627_s1; h) SSEA1, Hs01106466_s1; i) Musashi1, Hs01045894_m1; j) CD90, Hs00264235_s1 (Life Technologies).
PCR conditions consisted of 1 cycle of 50°C for 2 min, followed by exposure at 95°C for 10 min, 40 cycles of 95°C for 15 s, and 60°C for 1 min. HPRT1 and GUSB were used as invariant housekeeping genes. The quantitative expression of genes of interest relative to the housekeeping gene was calculated. This reference gene, which is also known as endogenous control, provided a basis for normalizing sample-to-sample differences. The data were only used if the calculated PCR efficiency ranged between 1.85 and 2.0. Template and reverse transcription negative controls were also included in all amplification experiments.
In Vitro Differentiation
Adipogenic Differentiation
hADSCs from mechanically microfragmented adipose tissue and PLA-derived hADSCs were seeded (6 × 10³ cells/cm2) in adipogenic medium following already published protocols (24, 25). The adipogenic medium consisted of DMEM high glucose (Euroclone) supplemented with 10% FBS, 1 μmol/L dexamethasone (Sigma-Aldrich), 0.5 mM 3-isobutyl-1-methyl-xanthine (Sigma-Aldrich), and 10 μM insulin (Sigma-Aldrich). After 2 weeks in culture, cells were fixed in 10% formaldehyde for 1 h and stained with Oil red O (Sigma-Aldrich) (15, 24) solution to show lipid droplet accumulation. For the quantification of intracellular lipid accumulation of Oil red O, the stained lipid droplets were eluted with 100% isopropanol (VWR International) for 10 min. The optical density was measured at 500 nm by spectrophotometer (Lambda Bio, Parkin Elmer, Monza, Italy) (24, 25).
Osteogenic Differentiation
hADSCs from mechanically microfragmented adipose tissue and PLA-derived hADSCs (9.5 × 10³ cells/cm2) were seeded in osteogenic medium containing DMEM low glucose, 10% FBS, 10 nM dexamethasone, 200 μM ascorbic acid (Sigma-Aldrich), and 10 mM β-glycerol phosphate (Sigma-Aldrich) (31). Cells were maintained in culture for 3 weeks and then fixed in 70% ethanol and stained with 1 mg/ml Alizarin red S dye (Sigma-Aldrich) to detect mineralized matrices (26). Intracellular alkaline phosphatase (ALP) activity was measured colorimetrically using an Alkaline Phosphatase Colorimetric Assay Kit (Abcam, Cambridge, UK), which uses p-nitrophenyl phosphate (pNPP) as a phosphatase substrate. Cell lysate was prepared using three cycles of freeze–thaw in deionized distilled water. Thirty microliters of the cell lysate was added to a 96-well plate with 50 μl assay buffer and 50 μl pNPP. The samples were shielded from direct light at room temperature for 1 h. After this, 20 μl Stop solution (3 N NaOH) was added to the wells, and the plate was read at 405 nm in a microplate reader (Programmable MPT Reader; Giorgio De Vita, Rome, Italy) (26).
Spheroid Formation
hADSCs derived from mechanically microfragmented lipoaspirate and cells obtained from processed lipoaspirate adipose tissue were grown in αMEM medium with FBS (20%) to reach 85% confluence at passage 1. After trypsinization, cells were seeded into the 96-well plate (5 × 10³/well) in neurosphere medium containing bFGF (20 ng/ml) and EGF (10 ng/ml) in the absence of serum (29). For passaging, spheroids were mechanically dissociated by gentle pipetting and transferred into a new well at the same cell dilution described above. For the immunofluorescence assays, spheres were fixed with 4% formaldehyde and permeabilized with 0.1% Triton X-100, then incubated overnight at 4°C with the following primary antibodies: human nestin (clone #196908, 1:200; R&D Systems), vimentin (polyclonal, 1:100; Santa Cruz), and GFAP (polyclonal, 1:1,000; Covance). The spheres in suspension were rinsed and subsequently probed 45 min with secondary antibodies Alexa Fluor 488 or 543. Nuclei were counterstained with DAPI (2 μg/ml in PBS). Stained spheres were spotted on glasses and mounted with FluorSave™ (Millipore). Images were taken using a Leica SP2 confocal microscope with He/Kr and Ar lasers. In negative control experiments, primary antibodies were replaced with equivalent concentrations of unrelated IgG of the same subclass.
Statistical Analysis
Data are expressed as mean ± SEM. The two-way analysis of variance (ANOVA) and Bonferroni's posttest were applied using Prism 5 software (GraphPad Software, Inc., La Jolla, CA, USA) assuming a value of p < 0.05 as the limit of significance.
Methods for cell protein extraction, Western blotting, negative control of gene expression, and supplemental figures and tables can be found at the supplementary site https://sites.google.com/site/goriolab/.
Results
Immunohistochemical Features of Mechanically Microfragmented Adipose Tissue and Lipoaspirate
Paraffin-embedded sections of lipoaspirate and microfragmented lipoaspirate obtained from the same donors were studied by means of immunohistochemistry and compared. Microfragmented fat tissue showed a structure similar to that of lipoaspirate, while nonadipose cells of the SVF had a comparable distribution (Fig. 1A), as evidenced by H&E and mesenchymal marker vimentin shown at low magnification. The quantification of the specific distribution of nestin-positive cells were 0.95 ± 0.03 positive/hpf in lipoaspirate samples and 0.98 ± 0.05 cells/hpf for microfragmented fat tissue. The difference is not significant as shown in Table S2 (Fig. 1A).

Histology and immunohistochemistry of lipoaspirated adipose tissue with or without microfragmentation. Comparative immunohistochemical analyses were performed on fresh tissues, after their cryopreservation at −80° for 72 h, and on the pellet of cells obtained after the fresh tissue centrifugation (920 xg for 10 min; pellet). Comparative histological analyses were performed on tissue samples obtained from the same subject. The analyses were performed on three different cases with similar results. The pictures shown were obtained from case 20 and are representative of the other investigated cases. (A) Scale bars: 100 μm (H&E, vimentin, and S100), 25 μm (nestin and β-tubulin III in Microfrag-AT), and 50 μm (β-tubulin III, lipo aspirate). (B) Scale bars: 25 μm (vimentin, nestin, and β-tubulin III in Microfrag-AT) and 50 μm (β-tubulin III, lipo aspirate). (C) Scale bars: 50 μm (vimentin and β-tubulin III); 25μm (nestin).
It is becoming increasingly evident that physical forces in the microenvironment play a key role in regulating many important aspects of cell biology. Some authors have suggested that both adipose- and bone marrow-derived MSCs may express nestin and other markers in response to manipulation, such as cytoskeletal disruption and extreme stress (14, 27, 35). The expression of neural markers such as β-tubulin III (TUJ1) was investigated in lipoaspirate and microfragmented lipoaspirate tissue samples. In contrast to lipoaspirate, microfragmented tissue product (either fresh or frozen) and pellets of cells obtained by centrifugation of microfragmented product expressed the neuronal precursor marker β-tubulin III (0.18 ± 0.03 positive cells/hpf) (Fig. 1A–C). Lipoaspirate samples always resulted negative (p < 0.0001) (Fig. 1A–C, Table S2).
The specific higher expression of β-tubulin III in microfragmented adipose was also confirmed by the confocal analysis. This method appeared to be more efficient in revealing a very abundant labeling of numerous positive cells (85.5 ± 11.61%), while few and barely positive cells were found in lipoaspirated tissues (9.7 ± 1.2%, p < 0.0001) (Fig. 2A). As general markers of adipose tissue, we followed vimentin and fatty acid-binding protein 4 (FABP4) and observed that the distribution of their cellular labeling did not show differences between microfragmented and lipoaspirated adipose tissue suggesting that in both cases the number of stromal cells was not affected (Fig. 2B, C). The quantification of the expression of β-tubulin III, FABP4, and vimentin is shown in Table S3. Eventual cell proliferation was detected by staining with Ki-67 antibody and hematoxylin counterstaining of the tissues. The Ki-67 labeling index for the stromal part of fat tissue was determined by counting the number of Ki-67-positive nuclei per total number of nuclei. The microfragmentation procedures did not increase the minute number of positive cells (data not shown).
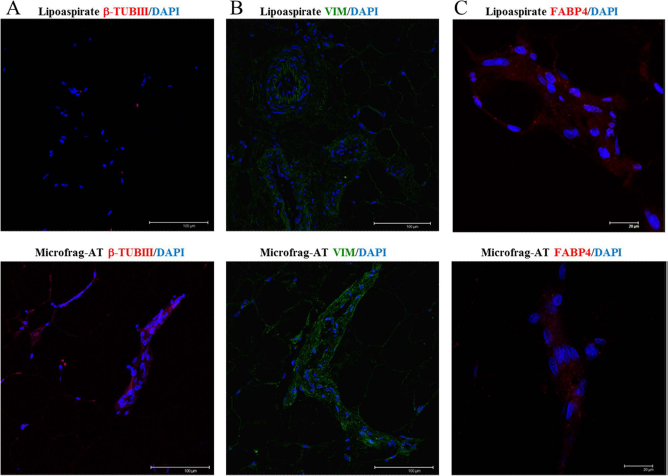
β-Tubulin III differential expression in lipoaspirated adipose tissue with or without microfragmentation. The expression of β-tubulin III (A), vimentin (B), and FABP4 (C) was investigated by immunofluorescence. β-Tubulin III and FABP4 are shown in red, vimentin in green; nuclei were stained with DAPI and are shown in blue. The pictures shown were obtained from case 20 and are representative of the other investigated three cases. Scale bars: 100 μm (A and B), and 20 μm (C).
hADSCs Cultures From Fresh or Cryopreserved Microfragmented Lipoaspirates
The adipose tissue collected during liposuction surgery was processed by means of mechanical fragmentation. hADSCs were obtained with or without liberase H1 enzymatic digestion (39). Live morphology (captured by means of EVOS® microscope apparatus, AMG; Life Technologies) of these cells (Fig. S2A–D) presented a fibroblast-like phenotype comparable to that of cells obtained from lipoaspirate processed by means of classical enzymatic digestion (Fig. S1G, H). hADSCs, obtained with or without enzymatic digestion, are able to grow in mesenchymal classic medium (αMEM) and in neural SCM (28) (Figs. S1 and S2).
With very similar efficiency, hADSCs can be obtained also by directly plating microfragmented fat without centrifugation processing (Figs. 3E, F and S1) that commonly is utilized in preparative methods to achieve stem cell extraction from adipose tissue (55, 56). In standard conditions (without treatment with liberase H1, but with centrifugation processing of Microfrag-AT), it becomes possible to isolate 5 × 10⁵ hADSCs from 1 ml of microfragmented product. Cells maintained either in αMEM or SCM express mesenchymal stem markers such as vimentin and nestin (Fig. 3). Moreover, cells maintained in αMEM are flat, large with few short processes (Fig. 3, upper line), while those grown in SCM appear slim and elongated with one or few elongated processes (Fig. 3, lower line).

Morphological and phenotypic features of Microfrag-AT hADSCs and PLA-derived hADSCs. The expression of stem markers (vimentin and nestin) was investigated by immunofluorescence in αMEM and SCM cultures at passage 0; cells were from the same case (Number 5, Table SI) and are representative of all cell cultures presented in this study. (A, C, E, and G) Cells grown in αMEM. (B, D, F, and H) Cells grown in SCM. The pictures shown are qualitatively representative of the cell phenotype only, and no quantitative difference was observed; the field chosen for the acquisition was casual. (A and B) Cells were obtained from mechanically microfragmented adipose tissue processed only with centrifugation (see Materials and Methods for details). (C and D) Cells were obtained from centrifuged mechanically microfragmented adipose tissue previously treated with enzymatic treatment (see Materials and Methods for details). (E and F) Cells were obtained from mechanically microfragmented adipose tissue product directly plated in culture. (G and H) Cells designate PLA-derived MSCs obtained by classical preparation (see Materials and Methods for details). Vimentin is showed in red, nestin in green, and DAPI in blue. Scale bars: 100 μm.
hADSCs can be obtained and grown in culture also when the microfragmented fat has been preserved at 4°C from 24 to 72 h (Fig. S2A, B) or cryopreserved at −80°C in the presence of cryoprotectant agent (10% DMSO) even for a long time (at least 12 months). Such cells can be kept in culture without any apparent modifications of their typical features (live pictures Fig. S1C, D). Since they are different from fresh tissue, it is necessary to use αMEM medium to obtain cells from cryopreserved fragmented specimen (Fig. S2E, F). No hADSCs could be obtained when lipoaspirate was frozen and stored at −80°C.
Proliferative Features of Microfrag-AT-Derived hADSCs
In order to investigate the growth capability of purified hADSCs obtained from microfragmented fat, expansion curves of cell populations obtained from different cases (Fig. 4A) were established. The CD of hADSC cultures from microfragmented adipose tissue were comparable among the different cases at the same time points. Cells obtained from microfragmentation of fresh tissue grew quite well for several passages, then entered a phase of slower growth (around the 12th passage). The CD was calculated in the exponential phase; the values of 5.04 ± 0.9 days and 4.69 ± 0.7 days were obtained in αMEM and SCM cultures, respectively (Fig. 4A). Conversely, PLA-derived hADSCs (obtained without liberase H1 treatment and maintained in the same culture conditions of Microfrag-derived hADSCs) attained slower growth quickly, even after a few CDs (Fig. 4A, enlarged detail). Similar data were also obtained and reported previously by other authors (54). No differences in growth curves were observed when Microfrag-AT-derived hADSCs were put in culture after cryopreservation using the two kinds of medium (Fig. 4B). In contrast, the cryopreserved PLA-derived hADSCs presented a sluggish rate of growth when put in culture after cryopreservation (Figs. 4B and S1).

Expansion curves of Microfrag hADSCs and PLA-derived hADSCs. Each point of the growth curves represent the mean ± SEM of counts for cells obtained from six cases. (A) Cells obtained from fresh tissue; (B) cells obtained from fresh tissue and then cryopreserved for at least 1 month. Boxes show the details of growth curves during the first 10-day growth of PLA-derived cells obtained only by centrifugation.
Cell Cycle and Chromosomal Stability
The DNA content was analyzed by Cytomics FC 500, and the cell cycle was analyzed with ModFit software (Verity Software House, Topsham, ME, USA). The results show that 15.88 ± 1.09% of Microfrag-AT-derived hADSCs cultured in αMEM in S + G2/M (active proliferative phase) and 78.93 ± 0.35% were in G0/G1 phase (quiescent phase). Cultures of cells in SCM medium displayed 21.19 ± 1.42% in S + G2/M phase, with the remaining cells (75.52 ± 0.31%) in G0/G1 phase (Fig. 5A). Study results demonstrated that less than 0.6% of hADSCs grown in both media were in apoptosis. Similar results have been obtained after cryopreservation (data not shown). Microfrag-AT-derived hADSCs maintained in both growth media did not present any chromosomal rearrangement, as assessed by QFQ banding performed at early (Fig. 5B) and late passages (data not shown). Chromosome number was normal in all analyzed samples of Microfrag-AT-derived hADSCs (n = 4).

Cell cycle and karyotype analysis. (A) Cell cycle patterns were investigated by FACS after PI staining on early and late (not shown) passages with similar results. Analyses were performed in Microfrag-AT hADSCs obtained from different cases (n = 4), and the mean ± SEM was reported in the table. The cell cycle analysis presented in the figure refers to case 14 (Table S1) and was performed at passage 5. (B) Karyotype analyses were performed on early (passage 5) and late (passage 12, not shown); passage for Microfrag-AT hADSCs was maintained in both media with similar results. Micrographs refer to hADSCs of two different cases (for αMEM case 17 and for SCM case 20, Table S1) and are representative of the same analyses performed in the other three cases.
Flow Cytofluorometry Detection of Mesenchymal Cell Surface Markers
Although many efforts had been made toward the characterization of surface markers of MSCs, a specific marker capable of identifying a uniquely homogeneous mesenchymal cell population is yet to be identified. Many phenotypic profiles useful for the study of cell–cell interactions and cell–environment are, however, well known (37). Microfrag-AT-derived hADSCs, purified from three different subjects, randomly chosen and grown in SCM or in αMEM medium at 90% confluence, were studied by means of FACS analyses. These data highlight that the expression of surface markers were very similar in hADSCs from microfragmented fat samples obtained from different individuals (Fig. 6). Microfrag-AT-derived hADSCs, maintained in either media, express the same surface markers at comparable percentages, with higher values (about 90%) for known mesenchymal markers (such as CD44, CD73, CD90, CD105, and CD166) (Fig. 6). Not surprisingly, endothelial (CD31, CD34, CD144, and CD146) and hematopoietic (CD45, CD133) markers were less represented (Fig. 6). The expression of some markers was modified by the longer maintenance in culture of Microfrag-AT-derived hADSCs. In particular, the expression of CD31 and CD105 increased significantly in both media with more passages (p < 0.0001). In hADSCs maintained for longer time in αMEM, there was an increase in CD56, CD144, CD146, CD166, and KDR expression, concurrent with a decrease in CD34 (p < 0.0001) (Fig. 6A). These aspects were different in cultures maintained for longer time in SCM, where a significant decrease in CD34 (p < 0.05), CD45 (p < 0.0001), CD133 (p < 0.0001), CD56 (p < 0.005), CD144 (p < 0.0001), and KDR (p < 0.0001) could be observed (Fig. 6B). This profile of cell surface proteins was preserved for the most part also when cryopreserved cells were grown in culture; the major difference was a higher expression of CD31 (p < 0.0001) and KDR (p < 0.0005) (Fig. 6C). The profile of hematopoieticrelated markers was comparable between cells derived from freshly microfragmented tissue and those from lipoaspirate, with perhaps a small increase in endothelial markers (CD144, CD146, CD31, CD34, CD105, and KDR) in the Microfrag-AT-derived cells (Fig. 6D).

Cell surface phenotype of Microfrag-AT-derived hADSCs. (A and B) Cell surface phenotype was investigated by FACS (see Materials and Methods for details) on hADSCs obtained from fresh microfragmented adipose tissue maintained in αMEM (A) and SCM (B) media at early (passage 2, white bars) and late passage (passage 12, black bars). The assay was performed in three different cases; each case at each passage was investigated in triplicate. Mean ± SEM of the three different cases are reported in the graphs. *p < 0.05; **p < 0.005; 096368914X681603p < 0.0001 (passage 12 vs. passage 2). (C) Cell surface phenotype of hADSCs was obtained from cryopreserved microfragmented adipose tissue. This analysis was performed at passage 2 in three different cases, and the mean ± SEM was reported in the graph (black bars). ***p < 0.0005, 096368914X681603p < 0.0001; cells from fresh microfragmented tissue versus cells from cryopreservation. (D) Cell surface phenotype was performed on PLA-derived hADSCs maintained in αMEM medium at passage 2. This analysis was performed in three different cases, and the mean ± SEM was reported in the graph (gray bars).
Adipogenic and Osteogenic Differentiation
The differentiation ability of Microfrag-AT-derived hADSCs was investigated in vitro, and differentiation experiments were set up for the evaluation of the mesenchymal commitment. By using a 2-week-long classical adipogenic differentiation approach (see Materials and Methods for detailed protocol), it was observed that after adipogenic induction of hADSCs in αMEM, the cell morphology changed into a rounder shape within 5 days (data not shown), then accumulated small bubble-shaped Oil red O-positive-lipid droplets in cytoplasm (Fig. 7). The quantification of lipid accumulation was determined by measuring the absorbance at 500 nm after the extraction of the triglycerides stained with Oil red O, Microfrag-AT hADSCs reached a value of 0.45 ± 0.021, while PLA hADSCs were at comparable differentiation with an absorbance of 0.53 ± 0.019. The type of fat accumulation was qualitatively different from that observed in cells grown in αMEM when Microfrag-AT hADSCs were grown in SCM. In this condition, fat was accumulated in smaller and more numerous droplets; in contrast, PLA-derived hADSCs grown in SCM accumulated fat in a normal fashion. Also, in this condition, the amount of triglyceride accumulation was quantified after Oil red O extraction; hADSCs from microfragmented AT reached an absorbance of 0.35 ± 0.011 nm and PLA hADSCs 0.48 ± 0.035 nm. In general, microfragmentation produced hADSCs that accumulated less fat than those obtained from regular lipoaspirate, but the difference was significant only when cells were grown in SCM.
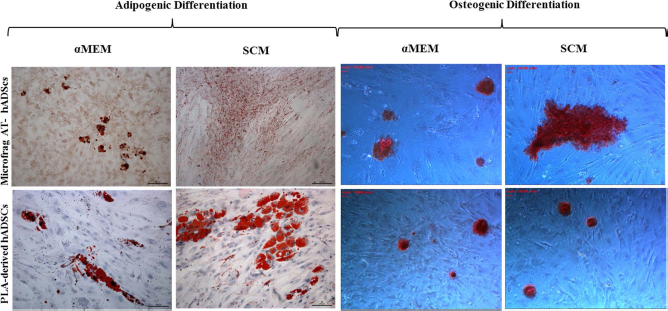
In vitro differentiation capability of Microfrag-AT hADSCs and PLA-derived hADSCs. Cells were differentiated in vitro (as described in the Materials and Methods section). Adipogenesis was revealed by Oil red O staining for lipid droplets. Osteogenic differentiation was evidenced by the formation of mineralized matrices as shown by Alizarin red staining. Scale bars: 100 μm for adipogenic pictures and 100 pixels for osteogenic pictures. Data are representative of two different experiments for four cases.
Cultures of Microfrag-AT-derived hADSCs in osteogenic medium reached almost complete confluence within a week of seeding. Later, cells formed aggregates, characterized by the presence of amorphous material deposits, that were positive by Alizarin red S staining (Fig. 7). Quantitative assay of intracellular ALP activity confirmed these results and revealed that ALP activity was 0.14 ± 0.02 μmol/L in Microfrag-AT hADSCs grown in αMEM and 0.21 ± 0.03 μmol/L in Microfrag-AT hADSCs grown in SCM. AP activity of PLA hADSCs was comparable in both media and reached a value of 0.15 ± 0.04 μmol/L.
Spheroid Formation by Microfrag-AT-Derived hADSCs
Bone marrow MSCs capable of forming spheroids in culture have been shown to have higher efficiency in differentiation (37). Furthermore, adipose stem cells show improved viability and developmental plasticity under defined serum-free media conditions after being grown as spheroid (53). In contrast, fibroblasts stop proliferation and undergo cell death when they are forced to form spheres (20, 51). Aiming at the generation of spheroids, hADSCs were incubated with serum-free medium normally used for the formation of neurospheres (29). It appeared that Microfrag-AT-derived hADSCs spontaneously form spheres within 24 h. About 50% of the Microfrag-AT-derived hADSCs formed large spheres, reaching a mean diameter of 100 μm after 7 days of culture (Fig. 8A). The remaining hADSCs formed small floating aggregates. When this culture is disaggregated mechanically and placed in culture again under the same growth conditions, the second passage in culture of spheres had higher efficiency, with only the remaining 30% of cells forming small clusters. PLA-derived hADSCs, however, failed to form such aggregates at both first and second passage. These latter hADSCs did not float and were 100% adherent, even after 2 weeks of culture in spheroid medium (Fig. 8A). This different response is a further confirmation that microfragmentation causes the induction of specific molecular changes that enhance the plastic and adaptive properties of hADSCs in response to extracellular signals. The sphere-forming assay was performed by plating 5 × 10³ Microfrag-AT hADSCs/cm2 that gradually detached and aggregated, forming an average of 35.70 ± 4.34 spheres/cm2 within 10 days. Mouse adult neural precursor cells obtained from the subventricular zone were used as positive controls; in this case, the formation of spheres was markedly superior (Fig. 8A). Immunofluorescence detection of specific proteins such as nestin, vimentin, and GFAP shows that spheres are positive for these markers as expected (Fig. 8B).

Formation and characterization of Microfrag-AT hADSC-derived spheres. (A) After being cultivated in neurosphere medium for 7 days, Microfrag-AT hADSCs formed spheres (upper line). PLA-derived hADScs (lower line) failed to form spheroids. The assay was performed with cells at passage 1. Data are representative of two different experiments for two cases. To perform the neurosphere-forming assay Microfrag-AT hADSCs (αMEM) and classical neural stem cells from the subventricular zone of adult CD1 mice were cultured in neurosphere-forming medium (Materials and Methods). The number of spheres formed in each well was quantified after 7 days and 12 days for SVZ and hADSCs, respectively. The experiment was performed twice in triplicate for each cell type and at passages 2 and 7 without observing significant differences. Data are expressed as the mean of two independent experiments with similar results reporting mean ± SEM. (B) The expression of nestin, vimentin, and GFAP was investigated by immunofluorescence in spheres formed by Microfrag-AT hADSCs (αMEM). Nestin is shown in red, vimentin and GFAP are shown in green, and nuclei were stained with DAPI (blue). Scale bars: 25 μm.
Neural Marker Expression in Microfragmented Fat-Derived hADSCs
To implement the characterization of Microfrag-AT-derived hADSCs, the expression of cellular markers was evaluated by immunocytochemical methods. Sixty percent of cells expressed mesenchymal marker vimentin and stem cell marker nestin at approximately 100% when these hADSCs were kept in culture in αMEM (Fig. 9A, B). A very high level of positivity for neural markers, such as TUJ1 (neuron-specific class III β-tubulin), O4 (oligodendrocyte marker), GFAP (Fig. 9A, B), and MAP-2 (Fig. S3) were also detected. When these hADSCs were grown in SCM medium, most markers remained at the same extent of expression, but almost 40% of cells showed levels of EpoR (p < 0.05, Fig. 9A, B). Similar results were achieved when the same immunocytochemistry analyses were performed in hADSCs obtained from cryopreserved, mechanically microfragmented adipose tissue product (data not shown). The expression of the same markers was also investigated in hADSCs obtained from lipoaspirate adipose tissue and grown in αMEM. As shown by other authors (as well as in this current study), a reduced percentage of cells capable of expressing β- tubulin III, GFAP, and O4 was observed in this study (p < 0.05) (Fig. 9C) (19, 34); moreover, these cells did not express EpoR at all (Fig. 9C).

Neural marker expression. (A) The expression of neural markers (nestin, vimentin, OCT4, GFAP, β-tubulin III, and EpoR) was investigated by immunofluorescence in αMEM and SCM culture from the same case. (B) Quantification was performed by counting the number of cells positive for the staining. Positivity was expressed as a percent of the total cells. (C) Quantification of neural marker expression was analyzed in PLA-derived hADSCs. Data are expressed as the mean of three independent experiments for each case (n = 9) with similar results ± SEM: *p < 0.05 SCM versus αMEM. Nestin, OCT4, and β-tubulin III are shown in red; vimentin, GFAP, and EpoR are shown in green; DAPI in blue. Scale bars: 100 μm.
Expression of Embryonic and Neurogenic Stem Cells Markers
By means of real-time RT-PCR (TaqMan technology), a goal of this study was to investigate molecular determinants of self-renewal and plasticity indicators. The results show that Microfrag-AT-derived hADSCs grown in either media, expressed spontaneously and at similar level embryonic stem cell genes, such as SOX2, NANOG, OCT4, and SSEA1 (Figs. 10A and S4A). Moreover, the gene profile assays showed that hADSCs grown in both media were also positive for the expression of genes involved in neurogenic lineage, such as nestin, neurogenic differentiation 1 (NEUROD1), MUSASHI1, PAX6, and SOX3 (Fig. 10B). In particular, the neurogenic characterization of gene-expression profiles highlighted that αMEM culture were positive for PAX6 and negative for SOX3. SCM culture showed an opposite expression profile regarding these last two genes (Fig. 10B). The expression of some of the previously investigated genes have been investigated by real time RT-PCR with SYGR technology including, as a negative control, the cDNA from a differentiated cell type (human oral mucosa) we checked (Fig. S4B). It was confirmed that SOX2, NANOG, OCT4, nestin, and NEUROD1 are expressed in Microfrag-AT hADSCs (Fig. S4B).
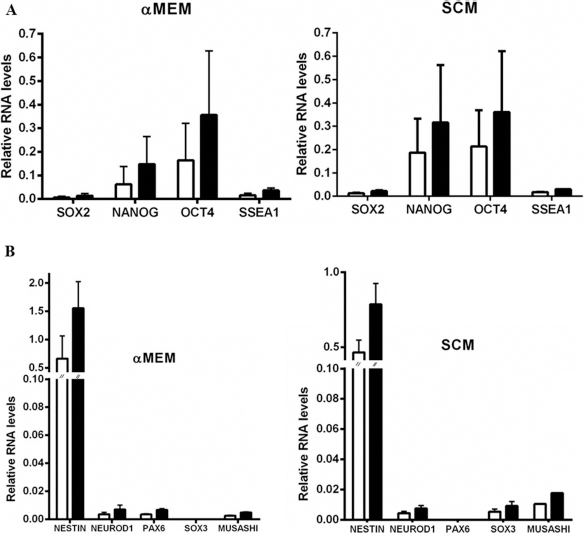
Pluripotency-associated endogenous gene expression. (A) Expression of SOX2, NANOG, OCT4, SSEA1, and (B) expression of nestin, NEUROD1, PAX6, SOX3, and MUSASHI1 in microfragmented-AT hADSCs maintained in αMEM and SCM was investigated by quantitative real-time RT-PCR. The assay was performed in triplicate in four different cases with similar results. The quantitative expression of genes of interest relative to the housekeeping gene HPRT1 (white columns) and GUSB (black columns) was calculated. Data are expressed as the mean of four independent experiments ± SD. Analysis of results for statistical significance was performed with the Student's t-test.
Discussion
ADSCs and the fat itself as a source represent one of the major fields of research in regenerative medicine. A great advantage is represented by the minimally invasive accessibility to adipose tissue and its ready availability (42). In the present study, we report that a population of stem cells, termed Microfrag-AT-derived hADSCs (with multilineage potential and expressing self-renewal transcription factors typical of multipotent stem cells), can be obtained following mechanical microfragmentation (mean fat particles area 1,0361249±12490.106 μm2) of fresh or cryopreserved human adipose tissue. The characteristics of microfragmented-AT-derived hADSCs have been investigated through the use of different approaches, such as flow cytometry, real-time RT-PCR, and immunocytochemistry. These hADSCs were isolated from the adipose tissue donated by several patients, and reproducibly fulfill the general definition of MSCs by both phenotypic and differentiation capability criteria (3). They also show a definite higher level of expression of neural markers that is accompanied by the ability to form neurospheres. Moreover, the procedure to obtain microfragmented-AT-derived hADSCs is relatively fast, safe, and does not require enzymatic digestion with collagenase (55, 56) or liberase H1 (39). Notably, by directly plating microfragmented adipose tissue product in culture, it is possible to obtain a large amount of cells.
The mechanical fragmentation of the adipose tissue was likely the key factor that triggered fine intrinsic changes in the tissue source, in spite of the fact that the morphological analysis of the fragmented tissue exhibited a remarkably preserved stromal structure that retained its typical constitutive elements at the same density and quantitative distribution. This structural definition was also maintained after cryopreservation of the fragmented tissue. In contrast, even a simple immunocytochemical staining revealed that the mechanical microfragmentation caused some changes in gene expression in the tissue; specifically, a markedly higher percentage of adipose tissue stromal cells was observed and expressed positive immune-peroxidase labeling for the neuronal marker β-tubulin III. Such a labeling was totally absent in the lipoaspirate. This information was reinforced by the more efficient confocal microscope analysis, where the lipoaspirate showed a very limited positivity to β-tubulin III that reached 100% in the case of the microfragmented tissue. Particularly noteworthy was the observation that these molecular features were also maintained in the microfragmented adipose tissue stored up to a year at −80°C (Fig. 1A). These suggestive results and possible properties of the microfragmented tissue are being clarified by molecular approaches specifically designed to identify them.
A population of stem cells retaining typical characteristics of surface markers of classical adipose tissue stem cells and MSCs was obtained when the microfragmented adipose tissue was subjected to culture in vitro, either by processing through centrifugation or by means of direct plating. Flow cytometry analyses showed that microfragmented-AT hADSCs, expanded in classical MSC medium or in SCM, express classical mesenchymal markers such as CD44, CD73, CD90, CD105, and CD166 (3, 30). The endothelial (CD31, CD34, CD144, and CD146) and hematopoietic (CD45, CD133) markers were much less represented and (as expected) the expression of some of these markers was modified at higher number of passages (11). In particular, a time-dependent decrease in CD133/2 marker was observed in microfragmented-AT hADSCs grown in SCM/negative CD133. Such human neural stem cells exhibited higher efficiency in colony formation than CD133-positive cells (47). This effect could be related to the likelihood that CD133 expression appears linked to cell cycle phase in neural stem cells (17). It would be interesting to additionally investigate whether CD133 expression might be related to the cell cycle phase in the case of our isolated cells. The CD105 increase in both media or the opposite situation for CD144 and CD146 in the two media had been also reported recently by other authors, who showed that these variations can be ascribed to the presence of supplements such as growth factors, cytokine (interleukin 6), ascorbic acid, or transferrin in the culture medium (11). CD31 (platelet endothelial adhesion molecule 1) is a classic marker of endothelial cells and their progenitors, and KDR mediates the VEGF-induced endothelial proliferation, survival, migration, tubular morphogenesis, and sprouting. Cryopreservation of Microfrag-AT hADSCs enhances CD31 and KDR levels. Thus, it is possible that these cells may be more prone to an endothelial fate following cryopreservation (6, 13).
A hallmark of MSCs is their multipotency and ability to give rise to tissue of mesenchymal origins, such as osteoblastic, chondrogenic, and adipogenic lineages. These features were present in hADSCs obtained from microfragmented-AT product and were also preserved at higher passages, although the in vitro test of fat accumulation demonstrated qualitative and quantitative differences between microfragmented fat-derived cells and those obtained from lipoaspirate. This observation again indicated that subcellular changes were triggered by the microfragmentation of the adipose tissue with reduced ability to form fat and a higher ability to form bone precursors. This indication is further supported by the higher propensity toward neural phenotype of these cells, compared to classical PLA-derived hADSCs. The aggregation of MSCs into 3D spheres may increase their ability to differentiate and enhance their potential therapeutic properties (43). In contrast, this study found that only microfragmented-AT-derived hADSCs efficiently formed spheres when grown in neurosphere-forming medium (in the absence of mitogenic stimuli) and expressed molecular markers typical of a neuronal lineage at very high levels when grown in basal growth conditions. In addition, EpoR was expressed when these cells were grown in SCM. These findings provide further evidence that microfragmentation of lipoaspirated adipose tissue changed some molecular features in the tissue resident cells so that hADSCs obtained in this condition became more plastic and adaptive to the extracellular signals.
Approaches aimed at understanding the molecular changes triggered by the microfragmentation are now in full development and will be subject to a near future publication.
NANOG, OCT-4, and SOX-2 are three transcription factors expressed at high levels in embryonic stem cells. They regulate the expression of other genes during development and are found at high levels in the pluripotent cells of the inner cell mass. The downregulation of these three transcription factors correlates with the loss of pluripotency and self-renewal, as well as the beginning of subsequent differentiation steps (22). These genes are expressed in some MSCs such as breast milk stem cells (16), bone marrow stem cells (21), and term amniotic fluid stem cells (32). The gene profile assays of the current study found that Microfrag-AT hADCs, grown either in αMEM or SCM culture media, expressed OCT4, OCT4-dependent SOX2, and NANOG (transcription factors responsible for embryonic stem cell self-renewal with pluripotency) (7). Through gene expression profiles, this study demonstrated that these cells express neurogenic lineage factors, such as NESTIN, NEUROD1, MUSASHI1, PAX6, and SOX3 (Fig. 8B). Also, the immunofluorescence staining indicated a higher expression of neural stem markers in microfragmented-AT hADSCs, which consequently coexpressed nestin, β-tubulin III, GFAP, and O4. Notably, the above phenotypic profile was reported at lower extent by other authors in MSCs obtained from different sources, such as amniotic fluid (5), nucleus polposus (34), bone marrow (49), and adipose tissue (18). The ability of undifferentiated MSCs to express immature and mature proteins typical of other tissues without any induction may support their plasticity and ability to differentiate easily into many tissues (19). These features suggest the pluripotent nature of Microfrag-AT hADSCs and highlights their novelty for regenerative studies, and those focused on molecular determinants of stem cells.
In conclusion, the mechanical microfragmentation of adipose tissue by means of Lipogems® apparatus has provided several positive discoveries concerning the properties of this tissue and its derived MSCs. This procedure did not modify the content in stromal structures and cells, but rather activated a variety of molecular changes such as the expression of β-tubulin III. These molecular changes are suggestive of the potentially higher usefulness in regenerative medicine of microfragmented fat tissue, compared to the lipoaspirate. In addition, our study showed that AT-hADSCs can be obtained without enzymatic digestion from frozen microfragmented fat tissue.
Footnotes
Acknowledgments
We acknowledge the outstanding assistance and scientific support of Drs. E. Parati, D. Tosi, R. Adami, S. Navone, E. Orpianesi. This work was supported by grants from “Neurogel en Marche” Foundation, FAIP, and “La Colonna” Foundation. C.T. is the inventor of the Lipogems® device (PTC/IB2011/052204) and President of Lipogems, Inc. No other relationships/conditions/circumstances present a potential conflict of interest.