
Abstract
We evaluated whether 1,5-anhydroglucitol (1,5-AG) (GlycoMark®), a test for measuring postprandial glucose and glucose variability, could be a tool for assessing short-term glycemic control in islet cell transplant (ICT) subjects. Data of 21 subjects, with type 1 DM and allogenic islet transplantation, who had concomitant fructosamine, HbA1c, 1,5-AG (n = 85 samples), and capillary glucose self-monitoring measurements (n = 2,979) were analyzed retrospectively at different time points after ICT. A significant negative association was observed between 1,5-AG and HbA1c (p = 0.02), but not with fructosamine. When HbA1c was divided in quartiles as <5.6, 5.6–5.9, 5.9–6.2, and >6.2, a decrease of an estimated 0.70 ± 0.30 μg/ml in 1,5-AG was associated with each quartile of increase in HbA1c (p < 0.0001). There was a significant decline of 1.64 ± 0.3mg/dl in postprandial glucose values for each 1 unit increase in 1,5-AG (p < 0.0001). For those with HbA1c ≥ 6.0% when 1,5-AG was ≥8.15 μg/ml, the mean estimated glucose level was 103.71 ± 3.66 mg/dl, whereas it was 132.12 ± 3.71 mg/ dl when 1,5-AG was <8.15 μg/ml. The glucose variability (Glumax - Glumin) in subjects with 1,5-AG <8.15 μg/ml was 46.23 mg/dl greater than the subjects with 1,5-AG ≥8.15 μg/ml (HbA1c ≥ 6.0%). There was no significant association between GlycoMark and glucose variability where HbA1c < 6%. 1,5-AG significantly associated with postprandial glucose levels and glucose variability in ICT recipients with near-normal HbA1c (6.0–6.5%) levels. These findings suggest that 1,5-AG can be used to differentiate those ICT subjects with higher glucose variability despite having near-normal HbA1c. However, prospective studies are needed to evaluate the association between GlycoMark levels and the parameters of graft dysfunction/failure.
Introduction
The effectiveness of islet cell transplantation (ICT) in subjects with type 1 diabetes mellitus (T1DM) can be measured by stabilization of glucose metabolism, elimination of severe hypoglycemic episodes, and restoration of hypoglycemia unawareness. However, insulin independence with adequate metabolic control was rarely prolonged beyond 2 years (5,21,27). The early prediction of in vivo islet graft dysfunction may allow for therapeutic interventions. Suboptimal graft function could contribute to progressive islet exhaustion and precipitate graft dysfunction, even in the patients with normal glycated hemoglobin (HbA1c) levels (2). Therefore, ICT recipients should be followed closely to detect progressive islet dysfunction, as early intervention(s) may slow down its progression (10).
Currently, the available biochemical methods to predict graft dysfunction are measurement of fasting and postprandial glucose (PPG), C-peptide, and HbA1c levels (2,5,21,27). Although HbA1c is the standard method for glucose assessment that reflects the glycemic control within the last 90 days, it lacks the ability to reflect short-term (within 2 weeks) glycemic fluctuations (15). On the other hand, fructosamine (FA), which is a product of nonenzymatic glycolyzation of albumin, reflects the short-term average glycemic control within the last 2–3 weeks (4). Although the clinical use of FA has been validated, the variability within the subjects and the normal ranges are limiting the use of this assay (16). Both HbA1c and FA are poor predictors of early glycemic fluctuations in ICT recipients prior to graft dysfunction (11).
Recently 1,5-anhydroglucitol (1,5-AG; GlycoMark®), a major six-carbon dietary monosaccharide, has been proven to be a good marker of short-term glycemic control and has been proposed as an indicator of PPG and glycemic variability, especially in the patients whose HbA1c levels are at or near target ranges (3,6–8,17,18,20,22). It has also been evaluated as a biomarker for hepatocyte nuclear factor-1α (HNF-1α) maturity-onset diabetes of the young (MODY) (24). The plasma 1,5-AG level is maintained at a constant steady state during normoglycemia due to a large body pool compared with the amount of intake. However, the elevation of serum glucose concentrations above renal threshold (>180 mg/dl) competitively inhibits the renal tubular reabsorbtion of 1,5-AG depending on the duration and magnitude of glucosuria. The serum 1,5-AG levels were shown to decrease sensitively and rapidly as a result of transient elevations of serum glucose within a 2-day to 2-week period (7). Thus, 1,5-AG may be considered for measuring daily glycemic excursions in ICT recipients, who have achieved near-normal average glucose and HbA1c levels. In this article, we evaluated the plasma 1,5-AG levels of ICT recipients as an alternative early marker of glucose excursions and its association with other parameters of glucose metabolism: HbA1c, FA, mean fasting, postprandial, and overall capillary glucose levels.
Materials and Methods
Subjects and Definitions
Data of subjects with T1DM who had received allogeneic ICT in our center according to previously described protocols were analyzed retrospectively during 2008–2009 (1,5,11,13,14,21,25). A total number of 21 subjects who had concomitant serum 1,5-AG, FA, HbA1c measurements, and self-monitoring capillary glucose measurements were included (Table 1). The study protocol was approved by the University of Miami Institutional Review Board (IRB), and each subject gave written informed consent.
Capillary glucose values, HbA1c, FA, and 1,5-AG were measured at different time points. The “mean fasting glucose” and “mean postprandial glucose” values were calculated from capillary glucose measurements (at least three times/day) collected a week prior to serum analyses of HbA1c, FA, and 1,5-AG. In addition, the “daily mean glucose values” were calculated from all of the glucose measurements (at least four times/day) including fasting, PPG, and bedtime during a week prior to serum analyses. The “glucose variability” was defined as the difference of maximum glucose value and minimum glucose value (Glumax - Glumin) of the daily measurements during the previously mentioned time period. Capillary glucose values were measured with OneTouch® Ultra® (Life Scan, Inc., Milpitas, CA, USA) with update calibration provided by DRI-Miami.
Insulin independence was defined as detectable C-peptide levels and stable glycemic control (fasting capillary glucose < 140 mg/dl and 2-h postprandial capillary glucose levels < 180 mg/dl) for at least 2 consecutive weeks (12). Graft dysfunction was defined as positive C-peptide levels and fasting and/or 2-h postprandial capillary glucose levels >140 and >180 mg/dl, respectively, on three or more occasions over a week or two consecutive monthly HbA1c values >6.5% (12).
Patients' Characteristics and Laboratory Findings
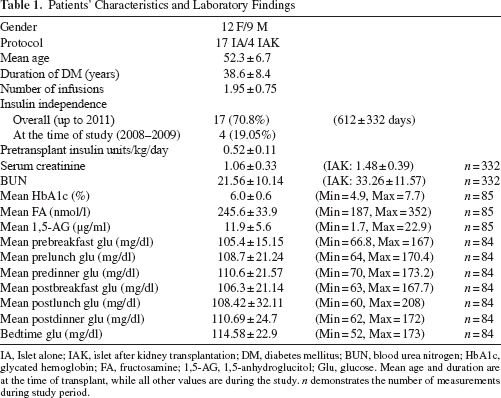
IA, Islet alone; IAK, islet after kidney transplantation; DM, diabetes mellitus; BUN, blood urea nitrogen; HbA1c, glycated hemoglobin; FA, fructosamine; 1,5-AG, 1,5-anhydroglucitol; Glu, glucose. Mean age and duration are at the time of transplant, while all other values are during the study. n demonstrates the number of measurements during study period.
Laboratory Analysis
Blood urea nitrogen (BUN) and serum glucose concentrations (mg/dl), determined by the hexokinase method, were measured in a Roche Cobas 6000 analyzer (Roche Diagnostics, Indianapolis, IN, USA) using the manufacturer's reagents and procedures. HbA1c levels were measured by high-performance liquid chromatography (HPLC) automated analyzer [Variant II Hemoglobin Testing System®, BioRad, Richmond, CA, USA; normal range 4.27–6.07%, <2% inter- and 1.7% intra-assay coefficient of variation (CV)]. FA levels were assessed by colorimetry method (Roche FA assay®, Hoffman-La Roche, Basel, Switzerland; normal range 190–270 nmol/L; 3.7% inter- and 3.7% intra-assay CV). 1,5-AG (GlycoMark®) was measured using an enzymatic colorimetric assay (GlycoMark®; Tomen America, New York, NY, USA). Values under 10 μg/ml are indicative of elevated post-meal glucose levels in moderately uncontrolled patients (HbA1c 6.5% to 8.0%); the normal range for 1,5-AG in moderately uncontrolled patients is 6.0–9.9 μg/ml. C-peptide was measured by double antibody radioimmunoassay (Diagnostics Products Corp., Los Angeles, CA, USA; 0.1–5.0 ng/ml detection limit; <10% inter- and intra-assay CV, 20% cross-reactivity with proinsulin).
Statistical Analysis
Data from this study are clustered: each patient had measures taken over multiple time points for each variable. All analysis is based on linear or logistic (depending on the outcome under consideration) regression methods using generalized estimating equations to accommodate correlation arising from this repeated-measures design. Results are reported below as means and standard errors. The significance level was defined as α = 0.05. Data from the patients were collected using a web-based electronic case record form. The statistical analysis was performed using SAS 9.2 software.
Different assessments were performed in this investigation. First, we estimated and tested the association between 1,5-AG and both mean fasting glucose and PPG. Second, the relationship between HbA1c/FA and 1,5-AG was assessed to see if there were any significant associations between these measures Third, the value of 1,5-AG was studied as to its usefulness as an informative marker for an individual patient's glycemic control.
Results
Twenty-one patients (12 female and 9 male) with T1DM who received allogeneic ICT in our center were included in this study. Of these 21 patients, 4 received ICT after kidney and 17 received ICT alone. The mean age at the date of first infusion was 52.3 ± 6.7 years with a mean duration of the diabetes of 38.6 ± 8.4 years. All of the study subjects were presenting hypoglycemia unawareness, and 66% of them had microvascular complications before ICT. The mean HbA1c was 7.4% at the time of ICT. Insulin independence was achieved in 17 (70.8%) of them with a mean duration of 612 ± 332 days during overall follow-up, but at the time of this study, 4 of the patients were insulin independent, and 17 of them were on insulin with an average of 0.51 units/kg/day (Table 1).
During the overall study period, 85 serum samples were collected, and mean FA, HbA1c, and 1,5-AG of all collected samples were 245.6 ± 33.9 nmol/l, 6.0 ± 0.6%, and 11.9 ± 5.6 μg/ml, respectively. Both HbA1c and FA were investigated as to their potential associations with 1,5-AG levels. Results of analysis revealed a significant association between 1,5-AG and HbA1c. When HbA1c was studied in quartiles as <5.6, 5.6–5.9, 5.9–6.2, and >6.2, a decrease of an estimated 0.70 ± 0.30 μg/ml in 1,5-AG levels was associated with each quartile of increase in HbA1c (p < 0.0001) (Fig. 1). There was no significant association between FA and 1,5-AG (data not shown).
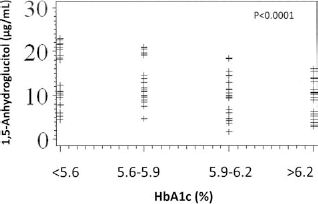
Graphical representation of the decrease in 1,5-AG in relation with an increase in HbA1c when divided in quartiles. Results of analysis revealed a significant association between 1,5-anhydroglucitol (1,5-AG) and glycated hemoglobin (HbA1c). When HbA1c was studied in quartiles as <5.6, 5.6–5.9, 5.9– 6.2, and >6.2, a decrease of an estimated 0.70 ± 0.30 μg/ml in 1,5-AG levels was associated with each quartile of increase in HbA1c (p < 0.0001).
Subjects performed a total of 2,979 capillary glucose measurements including fasting, postprandial, and bedtime (at least four per day). Mean glucose pre-/postbreakfast, lunch, and dinner including bedtime are described in Table 1. A negative and significant association was found between 1,5-AG levels and PPG after breakfast. Results showed that there was a significant decline of 1.64 ± 0.3 mg/dl in PPG values for each 1 μg/ml increase in 1,5-AG (p < 0.0001) (Fig. 2a). However, there was no significant association between HbA1c and PPG levels (Fig. 2b).
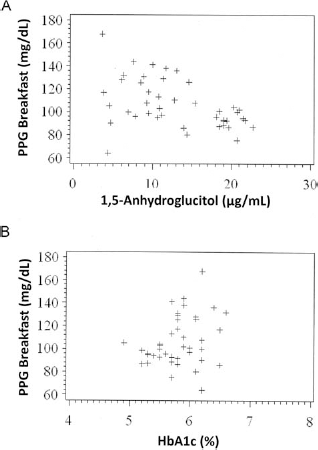
Scatter plot of postprandial glucose (PPG) levels. PPG levels compared with (A) 1,5-AG (GlycoMark) (B) HbA1c. Results showed that there was a significant decline of 1.64 ± 0.3 mg/dl in postprandial glucose values for each 1 μg/ml increase in 1,5-AG (p < 0.0001) (A). However, there was no significant association between HbA1c and PPG levels (B).
Data were analyzed to determine if 1,5-AG levels could be informative for daily mean glucose values, as well as for glucose variability. There was no significant association between 1,5-AG and daily mean glucose values in the patients with low HbA1c—defined as HbA1c <6.0% (Fig. 3a). However, when HbA1c was higher (HbA1c ≥ 6.0%), 1,5-AG significantly differentiated in those with higher mean glucose levels and in those with lower glucose levels (Fig. 3b). On the other hand, we see that for high values of GlycoMark (1,5-AG ≥ 8.15), glucose values throughout the day remain lower than for those with lower GlycoMark values (1,5-AG < 8.15 μg/ ml) in the patients with HbA1c ≥ 6.0% (Fig. 3b). For these patients, when 1,5-AG ≥ 8.15 μg/ml, the mean estimated glucose level is 103.71 ± 3.66 mg/dl, whereas it is 132.12 ± 3.71 mg/dl when 1,5-AG < 8.15 μg/ml. Thus, the difference in mean glucose levels when 1,5-AG is high versus low is estimated to be 28.41 ± 4.98 mg/dl (p < 0.0001). Another approach to the data is to explore how 1,5-AG values are able to predict days where glucose values will ever be “too high.” Here we defined days where glucose values exceeded 130 at any point in the day and analyzed the data to see if there was an association with 1,5-AG, and we found that GlycoMark had a significant association with this marker of uncontrolled glucose (data not shown). When the HbA1c level is higher, the higher GlycoMark levels are protective against uncontrolled glucose defined in this way [odds ratio; OR = 0.06, 95% confidence interval (CI) = 0.01, 0.24], but when HbA1c levels are lower, there is no such relationship between GlycoMark and uncontrolled glucose. There was no significant association between GlycoMark and glucose ranges where HbA1c is lower than 6%.

Association between 1,5-anhydroglucitol values and mean capillary glucose values. Illustration of the association between 1,5-anhydroglucitol values and mean capillary glucose values in patients with (A) HbA1c < 6% and (B) HbA1c ≥ 6%. No “linear regression analysis” was performed.
There was a significant association between 1,5-AG levels and daily glucose variability—described as (Glumax - Glumin)—when adjusted for HbA1c. The value of (Glumax - Glumin) in subjects with 1,5-AG < 8.15 μg/ml was 46.23 mg/dl greater than the subjects with 1,5-AG ≥ 8.15 μg/ml (HbA1c ≥ 6.0%). An example of the behavior of PPG and 1,5-AG in two different subjects followed longitudinally shows reciprocal trends (Fig. 4).

HbA1c, 1,5-AG, fasting, and postprandial glucose measurements in two patients. Patient 1 is a 64-year-old white female with 44 years of type 1 diabetes mellitus (T1DM). She received two islet infusions in 2002 and a supplemental infusion in January 2009 (arrowhead); the reduction of HbA1c and the increment in 1,5-AG can be observed after islet cell transplantation (ICT) reflecting better glycemic control. Patient 2 is a 44-year-old white female with 26 years of T1DM. She received one islet infusion in 2006. Three years after islet infusion, PPG started to increase, and 1,5-AG levels decreased reflecting deterioration of metabolic control. In both subjects, PPG and 1,5-AG demonstrated reciprocal trends. FG, fasting glucose.
Discussion
Islet transplant recipients have certain particularities that differentiate them from the T1DM population. Some recipients may have conditions or treatments such as dapsone use, erythropoietin administration, or iron deficiency that interfere with HbA1c measurements (12,19). In addition, it takes at least 2 months to see the effect of glucose exacerbations on HbA1c levels. On the other hand, the FA is less prone to have clinical interferences and reflects glucose control in a shorter period of time compared to HbA1c. However, this assay has limitations related to wide normal ranges and within-subject variability, and in a recent study, FA failed to reflect early graft dysfunction in ICT patients (11). HbA1c and FA strongly associate with fasting glucose and average glucose levels, but for the subjects with normal HbA1c, the postprandial glucose levels were considered as an indicator of overall glycemic control (9,23,26). In this study, we showed that 1,5-AG had a significant correlation with postprandial glucose levels in ICT recipients who had near-normal HbA1c levels (6.0–6.5%).
ICT recipients may require additional care to avoid postprandial hyperglycemic peaks in order to prevent graft dysfunction. Detecting glycemic fluctuations can allow for early interventions on current treatment, which may help the graft before progressing to failure. Therefore, practical markers are needed that reflect rapid changes in glycemia. This marker should be metabolically stable, demonstrating low biological variability and easily measured, in order to predict graft dysfunction, therefore preventing irreversible changes in metabolic control. According to our findings, 1,5-AG can be an accurate marker, reducing the burden of frequent capillary readings and complex metabolic dynamic tests.
In conclusion, we showed that 1,5-AG was not only associated with PPG and mean fasting glucose levels, but also significantly associated with glucose variability. These findings may suggest that 1,5-AG can be considered to compare or differentiate the ICT subjects who had near-normal similar HbA1c (6.0–6.5%) but higher glucose variability. However, prospective studies that will be designed with standardized glucose measurements are needed in ICT recipients in order to evaluate the association between GlycoMark levels and the parameters of graft dysfunction/failure.
Footnotes
Acknowledgment
This work was supported by NIH grants MO1RR16587, 1RO1-DK55347, and IU42 RR016603, Diabetes Research Foundation International 4-200-946, and the Diabetes Research Institute Foundation. The authors thank the staff of the Clinical Cell Transplant Program for their continued support. E.M.L.P. researched data, contributed to discussion, wrote manuscript, reviewed/edited manuscript. N.C.B. researched data, contributed to discussion, wrote manuscript, reviewed/ edited manuscript. S.M. wrote manuscript, analyzed data, contributed to discussion, reviewed/edited manuscript. M.I. Del O.G. researched data. V.L. researched data. A.C. reviewed/edited manuscript. E.H. researched data. C.R. researched data, contributed discussion, reviewed/edited manuscript. R.A. researched data, contributed to discussion, wrote manuscript, reviewed/edited manuscript. The authors declare no conflicts of interest.