
Abstract
The biology of cells transplanted with bone grafts is incompletely understood. Focusing on the early angiogenic response postgrafting, we report a mouse femur graft model in which grafts were derived from mice transgenic for a firefly luciferase (FLuc) bioluminescence reporter gene driven by a promoter for the angiogenic signaling molecule vascular endothelial growth factor (VEGF). Upon transplantation into wild-type (wt) mice, in vivo bioluminescence imaging (BLI) permitted longitudinal visualization and measurements of VEGF promoter activity in the transplanted graft cells and demonstrated a lag period of 7 days posttransplantation prior to robust induction of the promoter. To determine cellular mediators of VEGF induction in graft bone, primary graft-derived osteoblastic cells (GDOsts) were characterized. In vitro BLI on GDOsts showed hypoxia-induced VEGF expression and that this induction depended on PI3K signaling and, to a lesser degree, on the MEK pathway. This transcriptional regulation correlated with VEGF protein production and was validated in GDOsts seeded on demineralized bone matrix (DBM), a bone graft substitute material. Together, combined imaging of VEGF expression in living animals and in live cells provided clues about the regulation of VEGF in cells post-bone grafting. These data are particularly significant toward the development of future smart bone graft substitutes.
Keywords
Introduction
Cells transplanted as part of bone grafts provoke a complex osteoangiogenic response (7,24,42,43) that leads to osteointegration and subsequent remodeling of the graft (27). The pivotal importance of a graft's angiogenic capacity in successful grafting was first recognized scientifically in the 1950s in studies comparing “preserved” bone grafts (28,45), but the cellular cues underlying graft vascularization posttransplantation are still under investigation. Among the known angiogenic factors in the extracellular matrix, vascular endothelial growth factor (VEGF) has gained the most attention as it is required for proper osteogenesis during long bone development (13). Additionally, VEGF is involved in the postnatal repair of fractures (1,44) and bone defects (44,51), and it also plays a role in distraction osteogenesis (8). Consistent with an anticipated role of VEGF in bone graft cells, VEGF has been detected in clinical bone graft samples (46–48). However, surprisingly little is known about the in vivo biology that drives the cellular VEGF expression postgrafting, despite the successful use of VEGF in gene therapy for augmentation of devitalized bone grafts (20). Given that the cell population in bone grafts resumes function only in vivo, the aim of this study was to collect data on VEGF expression under physiological conditions, within the intact network of all regulation pathways, directly in vivo. Because molecular imaging has emerged as a technique that permits the noninvasive in vivo visualization and measurement of molecular and cellular biology in tissues (5,14,31,56), including musculoskeletal tissues (3,4,22,32,39), we hypothesized that it is suited to uncover the regulation of VEGF in bone grafts.
The absence of a molecular imaging technique that can monitor VEGF expression specifically in bone cells or mineralized tissues prompted us to foster the imaging approach illustrated in Figure 1. Bone grafts were derived from established transgenic mice in which a VEGF promoter drives the expression of the bioluminescence reporter gene firefly luciferase (FLuc) (55). The same transgenic mice have been used recently for successful imaging of VEGF expression in cancer development (53). Using isografting as a model of clinical autografting, a femur graft bone was directly transplanted into wt recipient mice. This created hybrid mice in which the graft bone is specifically labeled with the reporter gene and permitted imaging of VEGF expression at the tissue level directly in the living subject. In a concomitant “deconstructive” approach, graft bone was also used to derive primary bone precursor cells, referred to as graft-derived osteoblastic cells (GDOsts). Taking advantage of the FLuc reporter gene, in vitro imaging on the cellular level allowed us to identify signaling pathways controlling the VEGF promoter. Collectively, in this report, we show that these imaging-based in vivo and in vitro analyses deliver data potentially relevant for targeting the VEGF pathway in future bone graft substitutes.

Experimental design. Femur grafts were derived from donor mice transgenic for the imaging reporter gene VEGF-FLuc and directly transplanted into wild-type (wt) recipients for noninvasive, longitudinal in vivo BLI imaging of VEGF expression on the tissue level. The grafts were also used as source of osteoblastic cells, termed GDOsts, which were utilized to analyze signaling pathways by in vitro BLI on the cellular level. (1) Bioluminescence image of a graft isolated from VEGF-FLuc mice shows light emission, while a control graft (2) from a wt animal emits no background bioluminescence; color bar: 10,000 (black)–100,000 (gray) photons/s/cm2/steradian). Abbreviations: BLI, bioluminescence imaging; DBM, demineralized bone matrix; GDOsts, graft-derived osteoblastic cells; VEGF-FLuc, vascular endothelial growth factor (promoter)-firefly luciferase.
Materials and Methods
Materials
All chemicals and the small molecule inhibitors (U0126, LY294002) were procured from Sigma (St. Louis, MO, USA) unless noted otherwise. The cell lines were obtained from ATCC (Manassas, VA, USA). d-Luciferin was purchased from Caliper Life Sciences (Hopkinton, MA, USA).
Animals
Animal work was carried out under the auspice of an animal protocol approved by the Institutional Animal Care and Use Committee. A total of 154 inbred Friend leukemia virus B (FVB/N) female mice 8–12 weeks of age were studied. Wild-type (wt) and animals transgenic for FLuc under control of an approximately 3-kb human promoter-containing relevant regulatory elements (37) were originally obtained from Xenogen (Xenogen/ Caliper Life Sciences).
Bone Grafting
Mice were subjected to standard ketamine/xylazine anesthesia (Sigma). The lower right extremities were shaved and disinfected. Then, a 20-mm incision was made along the knee, and the subcutaneous tissue was prepared. The patella was mobilized along the patella tendon starting from the lateral side and the patella dislocated to the medial aspect. Continuing in a proximal direction, the quadriceps muscle was dissected from the dorsal muscles, and the femur bone was exposed. Next, the muscle was separated from the femur moving distal to proximal. The exposed femur was secured with forceps, while two bicortical holes were drilled, under water cooling, through the femur both proximal and distal (approximately 1 mm proximal to the femur condyles). Using microsurgery scissors (Fine Science Tools, Foster City, CA, USA), the perforated bone was carefully cut, and the graft was resected. For graft placement in recipients, a 23-gauge needle (BD, Franklin Lakes, NJ, USA) was used to drill a hole in the proximal intracondylar space, and a 25-gauge needle (BD) was carefully pushed into the intramedullar space. The donor graft was threaded onto the needle pin (BD) and was anchored within the distal femur part. The length of the pin was adjusted to fit the medullary space, the patella was relocated, and the muscles and the patella tendon were sutured from the lateral side. Last, the skin was closed using suture and/or wound clips (BD).
Bone Histology
Specimens obtained on posttransplant day 5 (PTD5) (n = 3) and PTD21 (n = 3) were fixed in 4% paraformaldehyde or 10% neutral buffered formalin, decalcified in 10% EDTA (pH 7.4), and then embedded in paraffin. Sections of 7 μm thickness were mounted on glass slides and stained using the modified Goldner's Masson trichrome (TriCh) method, hematoxylin and eosin (H&E), picosirus red (PR), or safranin-O (S-O) with hematoxylin counterstain according to standard histology protocols. Images from stained sections were acquired using a Mirax scanner (Carl Zeiss, Thornwood, NY, USA) except for slides illuminated under polarized light, which were captured using a Nikon Microphot FXA (Nikon Instruments, Melville, NY, USA).
Cell Culture and Characterization
The GDOsts were prepared from either the femur or the skull based on a modified standard protocol (2). Bone was removed surgically from the sacrificed animal under aseptic conditions and carefully cleaned from any soft tissues and bone marrow. The prepared bone had a white-translucent appearance. One femur or skull flap was transferred per well on a 12-well plate and mechanically cut to small pieces of approximately 1 mm2 prior to incubation between 14 and 20 days. Bone cells were grown in 1.5 ml of α-modified Eagle medium (α-MEM) supplemented with 10% fetal bovine serum (FBS), 2 mM of glutamine, 100 units/ml of penicillin, and 100 μg/ml of streptomycin. For the first 7 days of culture, 100 μg/ml of 2-phospho-l-ascorbic acid (Fluka, Buchs, Switzerland) was added to the medium. In addition to primary cells, the stable mouse osteoblastic cell lines 7F2 (male) (49), MC3T3-E1 subclones 24 and 4 (gender unknown) (54), and C3H/10T1/2 (gender unknown) (40) were studied. The supplemented α-MEM was used to culture 7F2, 24 and 4 cells, while Dulbecco's modified Eagle's medium (DMEM) high glucose supplemented with 10% FBS and 100 units/ml of penicillin and 100 μg/ml of streptomycin was used to culture C3H/10T1/2 cells. All cells were grown as monolayers on tissue culture plastic under a humidified 5% carbon dioxide atmosphere.
Osteogenic differentiation of cells was initiated by addition of 100 μg/ml of 2-phospho-l-ascorbic acid, 10 mM of β-glycerophosphate, and 10 nM of dexamethasone to the cell culture medium; no additives were added to the controls. After 21 days, cells were fixed with 10% formalin and stained for calcium deposition with alizarin red S.
Hypoxia and Inhibitor Treatment
For hypoxia experiments, femur GDOst cells were plated at 200,000 cells/well or 10,000 cells/well in 12- or 96-well plates (Corning, Corning, NY, USA) in a total volume of 1.5 ml or 0.1 ml, respectively. For inhibitor studies, cultures were seeded directly either onto plastic or onto demineralized bone matrix (DBM; Osteotech, Eatontown, NJ, USA). The DBM was carefully cut from a 15 × 15-mm sheet that was split horizontally in half. After 24 h, the medium was changed, and plates were transferred to a hypoxia chamber (HERAcell, Kendro Laboratory Products, Newtown, CT, USA) and incubated at 37°C for 48 h in an atmosphere containing 1% oxygen, 94% nitrogen, and 5% carbon dioxide. Inhibitors were prepared as stocks in dimethyl sulfoxide (DMSO) and used as follows: U0126, 20-mM stock, used at 1 μM (0.1×), 10 μM (1×), or 100 μM (10×); LY294002, 40-mM stock, used at 2 μM (0.1×), 20 μM (1×), or 200 μM (10×). Femur GDOst cell viability posthypoxia and inhibitor treatments were assessed by a 3-(4,5-dimethylthiazol-2-yl)-2,5-diphenyl tetrazolium bromide (MTT) assay using a commercially available kit (Roche Applied Science, Indianapolis, IN, USA). Absorbance was measured as [A570 nm–A690 nm] using a Model 680 Microplate Reader (Bio-Rad, Hercules, CA, USA). The assay, however, was not compatible with DBM due to dye uptake by the biomaterial.
Bioluminescence Imaging (BLI)
Animals were injected intraperitoneally with 150 mg/ kg d-luciferin in a total volume of 100 μl of PBS, and subsequently anesthetized with 2% isoflurane (Sigma) in oxygen. After 10 min, bioluminescence images were acquired for 10 min in the light-tight chamber of an IVIS imaging system (Xenogen/Caliper Life Sciences) and coregistered to a photographic image. Image analysis and quantification were carried out using Xenogen's proprietary Living Image software.
In vitro luciferase bioluminescence assays were carried out in 12- or 96-well plates. Prior to measurement, the medium volume was adjusted to 1.5 ml or 100 μl, respectively, and then mixed with an equal volume of 2 mM of d-luciferin solution in medium. The IVIS system was used to measure light emission from the sample.
Reverse Transcriptase Polymerase Chain Reaction (RT-PCR)
Cells were harvested by trypsination and stored as cell pellets at −80°C, while tissues were flash frozen on dry ice and then kept at −80°C. Total RNA was extracted from cells using the RNeasy kit (Qiagen, Germantown, MD, USA). Transplant tissue was mechanically pulverized in liquid nitrogen using a ball mill (Retsch, Haan, Germany) and resuspended in Trizol (Invitrogen) prior to the RNeasy procedure. All RNA was subjected to an on-column digestion with DNase I (RNase-free DNase Set, Qiagen). Primer sequences are listed in Table 1. Amplifications were carried out using the One-Step RT-PCR kit (Qiagen) in a total volume of 50 μl. Samples were reverse transcribed at 50°C for 30 min, and then DNA polymerase was activated at 95°C for 15 min. Subsequent PCR was carried out for 33 cycles with denaturation at 94°C for 45 s, annealing at 55°C (Table 1) for 45 s, and amplification at 72°C for 1 min, followed by a single 10-min incubation at 72°C. Fifteen-microliter aliquots of each reaction mixture were separated by size on a 1.5% agarose gel followed by photographic documentation under ultraviolet (UV) light in the presence of 0.2 μg/ml ethidium bromide. Gel band mean intensities relative to glyceraldehyde-3-phosphate dehydrogenase (GAPDH) were analyzed using the gel-analyzing function in ImageJ (NIH, Bethesda, MD, USA).
RT-PCR Primers
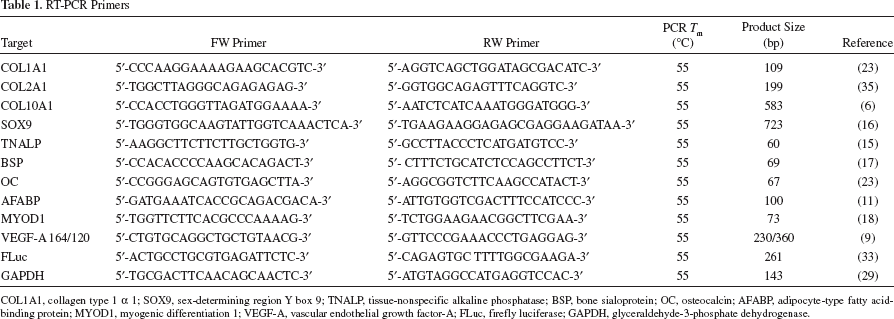
COL1A1, collagen type 1 α 1; SOX9, sex-determining region Y box 9; TNALP, tissue-nonspecific alkaline phosphatase; BSP, bone sialoprotein; OC, osteocalcin; AFABP, adipocyte-type fatty acid-binding protein; MYOD1, myogenic differentiation 1; VEGF-A, vascular endothelial growth factor-A; FLuc, firefly luciferase; GAPDH, glyceraldehyde-3-phosphate dehydrogenase.
Enzyme-Linked Immunosorbent Assay (ELISA)
Enzyme-linked immunosorbent assay (ELISA) for mouse VEGF was performed in 96-well plates using the Quantikine Immunoassay Kit (R&D Systems, Minneapolis, MN, USA) according to the manufacturer's instructions. Supernatant samples of 50 μl in volume were assayed undiluted. For colorimetric measurement and analysis, the Model 680 Microplate Reader, controlled by Manager 5.2.1 software, was used.
Statistical Analysis
Statistical comparisons were made using the GraphPad Prism software. For analysis, in vivo or in vitro data were subjected to ANOVA, with Bonferroni correction, or a two-tailed, unpaired t test, respectively. A value of p < 0.05 was considered significant.
Results
Healing of a Segmental Femur Graft in Mice
To study bone grafting in vivo, a mouse model was used. The femur cortical bone was cleared of bone marrow and placed into a defect of similar dimensions as a graft, stabilized by an intramedullary pin. Figure 2 shows histological analysis at two different timepoints postgrafting. On PTD5, there was no detectable integration of the graft, and cellularity within the marrow cavity was limited (Fig. 2A). Little cellular activity was also seen in the intersections between graft and host femur (Fig. 2B). However, new bone formation was detected on the periosteal and particularly endosteal surface of the graft (Fig. 2B–D). This osteogenic response was not associated with cartilage formation (Fig. 2E). Distant from the graft, cell infiltration into the muscle was detected but resolved over the following 17 days. In contrast to PTD5, the graft was fully incorporated into the host bone on PTD21 (Fig. 2F). The graft–host intersections were connected by bony calluses within a network of newly formed trabeculae, which encompassed reconstituted bone marrow compartments (Fig. 2G, I). An extended osteogenic remodeling response was also seen along large parts of the original graft bone (Fig. 2I). As expected, cartilage remains were only detected in the remodeling callus (Fig. 2J).

Characterization of the bone grafting model. (A–E) PTD5 is shown. (A) Full view of the femur graft, showing no appreciable graft incorporation and a lack of viable bone marrow components where the graft was stabilized by an intramedullary pin, as illustrated by the empty white space in the shape of a needle. However, the onset of intramembranous bone formation along the graft was apparent. (B) Donor graft and recipient femur interfaces lacked cellularity. Grafts showed endosteal bone formation, while a cell population exhibiting pronounced hematoxylin staining infiltrated the adjacent muscle tissue. (C) A polarized light view of the graft/recipient interface demonstrated an endosteal graft reaction adjacent to the bone marrow compartment as indicated by the disorganized collagen fibers, which have a white-yellow, wispy appearance under polarized light. (D) A similar endosteal reaction was observed in the recipient bone. (E) Safranin-O staining was negative within the graft/recipient interface at PTD5, indicating the absence of cartilage, a marker for endochondral bone formation. (F–J) PTD21 is shown. (F) The graft was completely incorporated into the recipient femur bone as demonstrated by the formation of a viable cancellous bone bridge at the graft/recipient interfaces at both ends of the transplanted graft. The bone marrow compartment was significantly reconstituted, and the muscle cell infiltration was resolved. (G) Mature callus contained a network of trabeculae surrounding the graft/recipient interface. (H) The mature callus revealed newly formed woven bone within the callus and (I) an extensive osteogenic remodeling response at the recipient femur as detected by the disorganized collagen fibers. (J) The graft/recipient bone interfaces healed through endochondral bone formation and presented a bony cancellous callus, including cartilage remains as detected by the staining with safranin-O. New bone formation (periosteal or endosteal reaction) is denoted by an arrow. The graft/recipient interfaces are marked with arrowheads. The donor graft is denoted by an asterisk (*). Abbreviations: BM, bone marrow; H&E, hematoxylin and eosin; PL, polarized light; PR, picosirius red; PTD, posttransplant day; S-O, safranin-O; TriCh, modified Goldner's Masson trichrome method.
Expression of VEGF Is Induced in Femur Grafts In Vivo
To assure proper VEGF-FLuc reporter gene function, we compared FLuc expression to endogenous VEGF expression as well as VEGF protein production and found, as previously reported (55), good correlation (Fig. 3). Next, we aimed to determine the in vivo induction of the VEGF promoter in graft bone. Grafts were derived from VEGF-FLuc transgenic donors. Repeated noninvasive BLI measurements were carried out postgrafting. Figure 4 shows images taken sequentially from a single mouse after grafting of bone from VEGF-FLuc transgenic donors. In lateral projection (Fig. 4 A–F), VEGF expression from the graft tissue was evident on PTD1 (Fig. 4A). It remained at the PTD1 level for the first week after grafting (Fig. 4A–D). Subsequently, a pronounced increase in light signal emission was seen over the next 7 days; a further increase was detected over the following 7 days albeit at a reduced magnitude. These data defined the onset of VEGF promoter induction in grafted bone to occur approx imately between PTD7 and 14. Similar observations were made for the supine projections of the same animal (Fig. 4G–L).
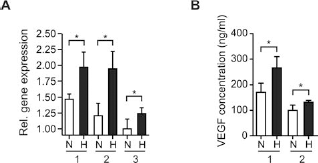
Validation of reporter gene activation in bone precursor cells from VEGF-FLuc mice. (A) RT-PCR comparison of expression of the VEGF promoter-driven reporter gene FLuc (1) to endogenous VEGF164 (2) and VEGF120 (3). (B) Corresponding ELISA for measurement of VEGF protein secretion from cell cultures derived from VEGF-FLuc (1) or wt control mice (2). Plotted data represent mean values (n = 4) with standard deviations. Abbreviations: H, hypoxia; N, normoxia.
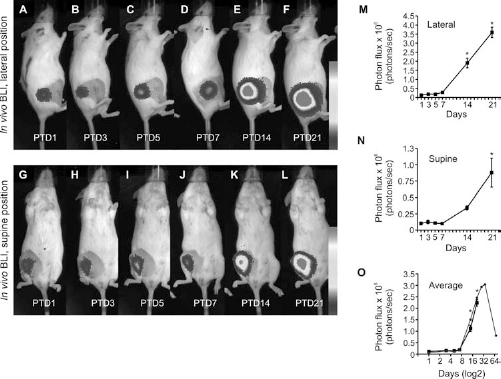
Noninvasive, repeated in vivo imaging of VEGF promoter induction in transplanted grafts in living mice. (A–L) Quantitative bioluminescence images were taken from a single animal representing a typical experimental group. At each PTD, consecutive images were acquired in lateral (A–F) and supine (G–L) positions. Imaging revealed the onset of VEGF promoter induction in bone grafts in living mice. Quantitative analyses of the dynamic changes in BLI signal were also measured (M–O). As reference, imaging data obtained from a scout animal from over a period of 64 days are presented with a dot line (compared with the square line) (O). An asterisk denotes statistical significance using multiple comparisons between all PTDs. Plotted data represent mean values (n = 4) with standard deviations. Bar: (A–F) 5,000 (dark gray)–100,000 (light gray) photons/s/cm2/steradian; (G–L) 5,000 (dark gray)–40,000 (light gray) photons/s/cm2/steradian. Abbreviation: PTD, posttransplant day.
Quantitative analysis of BLI data showed in lateral position a 6.8-fold light signal increase (p < 0.001) between PTD7 and 14 (Fig. 4M). A further increase of 1.9-fold (p < 0.05) was observed over the following 7 days but was less pronounced compared with the increase observed between PTD7 and 14 (Fig. 4M). The magnitude of signal increase in the supine projection between PTD7 and 14 was 3.3-fold (p < 0.001) and thus approximately a 50% reduction, compared with the lateral position (Fig. 4N). Similar to the measurements in the lateral position, a further increase on PTD21 was reduced to 2.6-fold (p < 0.001). Collectively, there was no statistically significant change in light signal from the grafting site between PTD1 and 7 (Fig. 4O), but there was a significant signal increase of 5.9-fold (p < 0.001) between PTD7 and 14 and a further twofold (p < 0.001) increase between PDT14 and 21 (Fig. 4O).
Graft-Derived Osteoblastic Cells (GDOsts) Are Bone Precursors
To help us understand the regulation of VEGF expression on a cellular level in an in vitro model, primary bone precursor cells were isolated from the bone graft. Prior to functional analysis, these GDOsts were first characterized. Table 2 gives an overview of the gene expression profile in these cells. For comparison, GDOsts were not only isolated from the femur but also from the skull. Furthermore, we compared the primary cells to a panel of stable, well-characterized cell lines frequently used in orthopedic research. GDOsts were found to be positive for osteoblast markers, including collagen type 1 α 1 (COL1A1), tissue-nonspecific alkaline phosphatase (TNALP), and bone sialoprotein (BSP). However, they also expressed markers typically found in immature bone precursors, such as the chondrocyte lineage markers COL2A1, COL10A1, and sex-determining region Y box 9 (SOX9) as well as the adipocyte marker adipocyte-type fatty acid-binding protein (AFABP). Thus, the GDOsts were considered osteoblastic bone precursor cells. Consistent with this classification, exposure of the cells to medium containing ascorbic acid, dexamethasone, and inorganic phosphate resulted in extensive mineralization throughout the cultures (Fig. 5).

Mineralization characteristics of graft-derived osteoblastic cells (GDOsts). Exposure of GDOsts to supplements known to induce mineralization in bone precursor cells induced pronounced mineral deposition in GDOst cultures as indicated by the calcium stain alizarin red S. The top three supplementtreated wells of GDOst were markedly stained with alizarin red, while the bottom three unsupplemented wells showed no mineral content. GDOsts were compared to 4 cells, a known osteoblastic cell line. Abbreviations: #4, MC3T3-E1 subclone 4; AA, ascorbic acid; Dex, dexamethasone; GDOsts, graft-derived osteoblastic cells; Pi, inorganic phosphate.
Relative Expression of Marker Genes in Osteoblastic Cells

Fold increase in expression relative to GAPDH: - (negative), + (low <0.5), ++ (0.5–1.5), +++ (1.5–2.5), ++++ (>2.5). GDOst, graft-derived osteoblastic cells.
Hypoxia Induces VEGF Expression Via PI3K and MEK Signaling in GDOst Grown on Plastic or Demineralized Bone Matrix In Vitro
To test if VEGF expression in GDOsts responded to low oxygen tension, GDOsts were seeded on standard cell culture plastic and exposed to 1% hypoxia for 48 h. Then, BLI was used in vitro to image VEGF expression in GDOsts in a fashion similar to the in vivo BLI in living mice. A robust induction of the VEGF promoter was visualized (Fig. 6A). Subsequently, we asked whether signaling pathways upstream of the VEGF promoter were essential for VEGF expression under hypoxia. The effect of the blockage of mitogen-activated protein kinase kinase (MEK) and phosphoinositide-3-kinase (PI3K) signaling using the small molecule inhibitors U0126 and LY294002, respectively, was assessed. As these inhibitors can potentially induce cell death, we first measured cell viability using a conventional MTT assay (Fig. 6B). Under hypoxic conditions, the solvent DMSO, low concentration of U0126, and low concentration of LY294004 had no significant effect on cell viability. Intermediate and high concentrations of U0126 resulted in a 12.6% and 42.7% loss of viability, respectively, while intermediate and high concentrations of LY294004 caused a 30.4% and 64.1% reduction in cell viability, respectively. We used these measurements to correct all subsequent in vitro BLI and ELISA measures for cell viability. Although the low concentrations of inhibitor did not compromise cell viability, they also did not affect VEGF expression (data not shown). Thus, we determined the effect of intermediate and high inhibitor concentrations on VEGF expression (Fig. 6C). Quantitative analysis showed that the intermediate concentration of U0126 caused a reduction in hypoxia-triggered increase in VEGF expression that was not statistically significant, while the high concentration of U0126 resulted in a 74.3% (p = 0.0001) decrease (Fig. 6D). In the presence of intermediate concentration of LY294004 inhibitor, VEGF expression was reduced to 34.3% (p = 0.003) compared with the untreated cells (Fig. 6D). The most pronounced overall signal decrease was observed with high levels of LY294004, which led to an additional 90.3% (p = 0.0001) drop in hypoxia-induced VEGF expression (Fig. 6D) compared with the intermediate concentration. Because VEGF protein constitutes the biologically active species, we then measured VEGF protein secretion from cell cultures exposed to identical conditions. A similar pattern of dependence on signaling pathways was observed for the transcriptional expression and protein production levels of VEGF (Fig. 6E).

In vitro imaging for the identification of VEGF regulation pathways in GDOsts. (A) Hypoxia acts as an inducer of the VEGF promoter. (B) Inhibitors of the mitogen-activated protein kinase kinase (MEK) and phosphoinositide-3-kinase (PI3K) signaling pathways reduced GDOst viability in a concentration-dependent manner as measured by MTT assay. (C) To varying degrees, signaling through both the MEK and PI3K pathways was necessary for hypoxia-induced VEGF promoter activation as determined by in vitro BLI. (D) Quantitative analysis of the in vitro BLI shown in (C). (E) Corresponding measurement of VEGF protein secretion by ELISA. (F) Attachment of GDOsts to DBM did not compromise these signaling pathways. (G) Quantitative analysis of the in vitro BLI shown in F. A star denotes statistical significance for the indicated comparison. Scale bars: (A) 10,000 (dark gray)–50,000 (light gray) photons/s/ cm2/steradian; (B) 2,000 (dark gray)–8,000 (light gray) photons/s/cm2/steradian; (E) 2,000 (dark gray)–10,000 (light gray) photons/s/ cm2/steradian. Plotted data represent mean values (n = 4) with standard deviations. Abbreviations: D, DMSO (inhibitor solvent); H, hypoxia; L, LY294004; MTT, 3-(4,5-dimethylthiazol-2-yl)-2,5-diphenyl tetrazolium bromide assay; N, normoxia; U, U0126.
To determine the potential influence of cell-biomaterial interaction on the observed regulation of the VEGF promoter, GDOsts were seeded on clinical-grade human DBM. The high concentration of inhibitor was excluded from this experiment due to the pronounced toxicity we observed. Upon exposure to hypoxia and intermediate concentration of inhibitor, a marked reduction of VEGF induction was seen (Fig. 6F) similar to the experiment conducted on plastic dishes. The inhibitor U0126 reduced VEGF expression by 48.7% (p = 0.0002), and LY294004 suppressed VEGF induction by an additional 33.9% (p = 0.004) more than U0126 (Fig. 6G).
Discussion
To our knowledge, this study is the first to describe the imaging of VEGF expression in cells that constitute bone tissue. We were able to achieve this by grafting wt animals with bare bone derived from genetically identical donor animals harboring a BLI reporter gene under control of the VEGF promoter. The presented data show that noninvasive BLI can detect in vivo in the living animal if VEGF is expressed in bone of graft tissue and at what timepoint it is expressed. Furthermore, it can reveal the magnitude at which VEGF expression occurs. By adhering to previous recommendations for quantitative BLI (30,32), including standardized animal positioning, d-luciferin injection route, and imaging timing post-d-luciferin administration, we enabled quantitative, longitudinal in vivo BLI of VEGF expression in bone. A limitation of in vivo BLI quantification is that comparisons of signal intensities can only be made between the same anatomical positioning (i.e., lateral or supine) to exclude potential variations in tissue attenuation of the emitted light. Interpretation of data from our approach needs to take into consideration that the BLI readout is specific for cellular activity that originates from the graft tissue. Thus, we cannot rule out the possibility that total VEGF expression at the graft-healing site might be different from the expression monitored with our approach. However, it was shown previously that the graft-derived bone precursor cells from the periosteum alone produced 70% of the osteogenic response during healing (57). The bone transplant in our model was grafted using a technique previously described by Tiyapatanaputi et al. (50) and later applied by others (20). In contrast to those studies, however, our bone transplants have been carefully separated from the bone marrow content and were approximately 25% longer. Despite these differences, the healing progression we observed principally matches previous reports (20,50), suggesting a robust healing response due to a combined intramembranous and endochondral mechanism with a possible limited bone marrow contribution from the graft.
To complement the data obtained at the tissue level with analysis at the cellular level and to begin to explore a more comprehensive imaging platform, we chose a “deconstructive” approach by deriving GDOsts from the transgenic bone we used for femur grafting. With future craniofacial applications in mind, we also derived sister GDOsts from skull bone. A gene expression comparison of GDOst cells to four established, stable bone/precursor cell lines frequently used in skeletal research demonstrated that the GDOst cells have an osteoblastic phenotype. GDOsts are expected to represent a cell population that resides within the bone graft and that plays an important role in bone formation postgrafting (57). In addition, these cells are a transplantable precursor population that has significant therapeutic potential (21). However, there are two limitations to using primary cell populations. First, these cells may not represent the entire cellular composition of the intact graft bone. Second, they are not clonal and might therefore represent cells from different origins or at varying states of differentiation. Of note, in preliminary experiments, we have observed differences in signaling between the GDOsts (unpublished data) and the stable cell lines as well as among the four stable osteoblastic cell, and this cautions us about the relevance of using stable lines as a model for cellular events in graft bone.
Evidently, the GDOsts carry the same reporter construct as the graft tissue from which they were derived and which we transplanted for in vivo BLI. Thus, these cells enable the measurement of VEGF expression without the need for ex vivo gene transfer. BLI is not limited to experiments in living mice, and so we used it in a fashion similar to the in vivo BLI to detect how regulation pathways affect expression of a VEGF in GDOsts grown on plastic and DBM. The latter is a clinically used biomaterial, and we selected it because it is known to provide a biologically active environment (36); a limitation of DBM, however, is that it lacks mechanical stability, which restricts its use as femur graft substitute. Thus, we plan on testing the GDOsts on a panel of other clinically relevant biomaterials in vitro and then transplant GDOst-seeded graft substitutes into bone grafting models for subsequent in vivo BLI of VEGF promoter activity in GDOst-loaded biomaterials. With such studies, it will be possible to broaden previous BLI studies on proliferation/ survival (10,34) and differentiation (52) of precursor cellbiomaterial composites.
Understanding VEGF biology in grafts has great importance beyond biological insights because of its relevance for bone graft engineering, in particular the development of smart biomaterials that actively control the behavior of transplanted cells (12). Among the signaling molecules that are under investigation for smart bone graft substitutes is VEGF (19,38). However, a vital prerequisite for the development of smart bone graft substitutes that utilize VEGF is a detailed understanding of VEGF biology within the bone grafts for which biomaterial substitutes are being developed. To this end, insights offered by the presented in vivo and in vitro data sets have potential to be applied for the rational design of smart bone graft substitutes that utilize and/or manipulate VEGF expression. Our expectation prior to the in vivo imaging experiment was that the VEGF promoter is induced within 24–48 h posttransplantation due to an acute oxygen and nutrient deficiency of the nonintegrated graft and that this state will persist perhaps until a complete healing response occurs. Contrary to this speculation, we observed a lag period in VEGF expression after graft transplantation, where the onset of induction occurred only after 7 days post-graft implantation. This suggests that the extracellular matrix of engineered biomaterials should not provoke VEGF expression in a steady fashion but rather that it needs to facilitate temporal control in order to mimic autograft properties. Our histological evaluation at PTD5 shows a limited endosteal bone formation response and no healing at the graft intersections, while PTD21 presents with endochondral bone formation and integration at the graft intersections. Thus, there is a possibility that graft-derived cells express and contribute VEGF during the endochondral repair process. This idea is supported by the view that the repair callus constitutes a hypoxic environment that activates VEGF expression in hypertrophic chondrocytes and osteoblasts located in the cartilaginous and bony compartments, respectively (41). Our experiments on GDOsts directly confirmed hypoxia as an inducer of VEGF in these cells and demonstrated that PI3K signaling and, to a lesser degree, the MEK pathway are important for VEGF induction under hypoxia. A likely explanation for this observation is that these pathways are required in primary osteoblastic cells for the maintenance of hypoxia-inducible factor (HIF)-1α translation or the stabilization or phosphorylation of HIF-1α, which is required for HIF-1 activation (25,26). From these findings, we conclude that novel smart biomaterials need to activate these signaling pathways if VEGF expression in a hypoxic environment is desired. Vice versa, forced obstruction of these pathways may provide means to suppress HIF-1-dependent VEGF expression. We emphasize that the scope of this proof-of-principle study is limited, and a large body of further work is needed to create a comprehensive framework for rational design of smart graft biomaterials that direct VEGF biology of transplanted cells in contact with the biomaterial. Despite the capacity of BLI for repeated longitudinal studies, we feel that it is very important to initially focus on an in-depth understanding of the observed VEGF induction between PTD7 and 14 because the value of the BLI detection method is contingent upon its mechanistic interpretation and relevance to biomaterial–cell interaction. Therefore, we plan on focusing subsequent in vivo studies on (1) the onset of VEGF expression, (2) signaling pathways essential for the initial induction of VEGF in grafts, and (3) matching studies of VEGF expression in GDOst-loaded graft substitutes. Additionally, it will be important to achieve an even better understanding of the in vivo environment that the graft facilitates. For example, validated measurements of the oxygen tension and growth factor composition of the grafts will be highly desirable.
The presented experiments lead to the conclusion that noninvasive imaging of VEGF expression, measured using a cellular imaging reporter gene in bone tissue, is feasible and that this technique can be applied to the study of the biology of cells transplanted as part of a bone graft. By complementing the in vivo imaging on the tissue level to in vitro cellular imaging, it is possible to gain insights into graft biology that may be useful in the development of smart bone graft substitutes.
Footnotes
Acknowledgments
This study was supported by the National Institutes of Health grants R01AR055294 and R03AR052069 (both to P.M.K.) and the Orthopaedic Trauma Association (to P.M.K.). This work was supported by the German Research Foundation (DFG) and the Technische Universität München within the funding programme Open Access Publishing. The authors declare no conflict of interest.