
Abstract
The aim of this study was to quantitatively define the main measurable technical parameters for the intramuscular transplantation of myogenic cells in primates. Myoblasts transduced with the gene coding for β-galactosidase were injected into the skeletal muscles of 15 monkeys. The following parameters were studied: needle size, number of cells per injection, and volume of cell suspension per injection. Monkeys were immunosuppressed with tacrolimus. The cell-injected sites were biopsied 1 or 2 months later. Biopsies were examined histo logically to assess the myoblast engraftment and the muscle structure. The conclusions were as follows: (1) Needles should be thin enough to avoid important tissue damage and allow muscle regeneration as satisfactory as possible. Among those tested, 27G should be the choice if the length is consistent with depth of injection. (2) At least 100,000 cells should be delivered per centimeter of needle trajectory. (3) The smallest volumes of cell suspension per injection should be used. In this study, 1 μl/cm of injection trajectory was sufficient. In principle, these parameters apply to muscles in which no damage occurred other than the injections.
Keywords
Introduction
Transplantation of cells able to differentiate into myofibers is a potential therapeutic approach for the treatment of myopathies of genetic origin. To be useful in these diseases before the muscle degeneration is too advanced, the grafted cells need to fuse with the patient's myofibers to bring healthy nuclei into them. These exogenous myonuclei can thus express therapeutic genes in myofibers that suffer of a genetic disorder. In this text, the fusion of the grafted cells with the recipient's myofibers, with the subsequent expression in these myofibers of proteins derived from the exogenous nuclei, will be concisely called engraftment. The myofibers expressing proteins from the exogenous nuclei will be referred as hybrid.
A few years ago, our laboratory conducted a clinical trial in which myoblasts proliferated in vitro from muscle biopsies of nonmyopathic donors were transplanted in nine patients with Duchenne muscular dystrophy (15), a severe genetic myopathy caused by the lack of the protein dystrophin. We detected donor-derived dystrophin by immunohistochemistry in 3.5–26% of the myofibers in muscle biopsies of eight of the nine patients, 1 month after the intramuscular (IM) implantation of myoblasts (15). In another patient in which we performed a longer follow-up, normal donor-derived dystrophin was detected in 34.5% of the myofibers in the injection site, 18 months after transplantation (16). These results were better in terms of confirmed engraftment than those obtained in previous clinical trials [reviewed by Skuk (13)]. This improvement was due to two factors. The most important was the cell injection protocol, designated as high-density injections due to the high number of injections per volume of tissue (13). The second was the use of tacrolimus to control acute rejection, an immunosuppressant known to be adequate for allotransplantation of myoblasts in mice and macaques (20).
These improved results were the consequence of assuming the importance of mastering the parameters of cell administration. This aspect, which was shelved in myogenic cell transplantation, is obvious in other areas of medicine. Pharmacotherapy and radiotherapy require knowledge of the therapeutic doses and frequency of administration. Suboptimal doses and/or a low frequency of administration will make a treatment ineffective, regardless of whether a drug or radiation is an efficient therapeutic agent. In cell transplantation, correct variables of administration are also essential. In fact, the clinical trials of myoblast transplantation performed in the 1990s failed to obtain significant engraftment because the variables of administration were inadequate.
In a first quantitative approach to myoblast transplantation in primates, we established the relationship between the degree of engraftment (quantified as the percentage of hybrid myofibers in a transversal section of muscle) and the density of injections (17). This information was important for the last clinical trials conducted by our team, in which myoblasts were implanted by matrices of about 25–100 injections/cm2 (15) and even more (16). The highest percentages of dystrophin+ myofibers were observed in the patients that received the highest density of injections.
Subsequently, our experience with myoblast transplantation in macaques indicated that it was important to define other variables, essentially:
The size of the needle. We observed that the engraftment reproduces the pattern of the injection trajectories, probably corresponding to the myofiber damage produced by the injection needle (20). We wonder if increasing the needle size could be an easy way to improve the engraftment.
The number of cells per injection. We wanted to determine the optimal dose of cells to be delivered, avoiding the administration of inadequate amounts of cells.
The volume of cell suspension per injection. We wanted to determine whether cells should be injected diluted in large volumes of liquid or concentrated in small volumes.
Material and Methods
Animals
Cynomolgus monkeys (Macaca fascicularis) (n = 15, males and females; between 3 and 6 years old; Primus Bio-Resources, Laval, QC, Canada) received transplantation of allogeneic myoblasts. For transplantations and biopsies, they were kept under general anesthesia using isofluorane (1.5–2% in oxygen; Abbott Laboratories, Montreal, QC, Canada) after induction with ketamine (10 mg/kg; Bioniche, Belleville, ON, Canada) and glycopyrrolate (0.05 mg/kg; Sandoz Canada, Boucherville, QC, Canada) IM. Buprenorphine (0.01 mg/kg b.i.d. for 3 days; Champion Alstoe, Whitby, ON, Canada) was given for postoperative analgesia. Since multiple muscle samples were obtained from some animals, they were euthanized at the end of the experiment by intravenous administration of a pentobarbital overdose (120 mg/kg; Euthanyl; Bimeda-MTC, Cambridge, ON, Canada) after anesthesia using IM ketamine (15 mg/kg). The Laval University Animal Care Committee authorized these procedures.
Cell Culture
Two cell lines were obtained from skeletal muscle biopsies performed in two additional female cynomolgus monkeys (3 and 4 years old). The biopsies were minced with fine scissors (World Precision Instruments, Sarasota, FL, USA) into fragments of less than 1 mm3 and then dissociated with 0.2% collagenase (Sigma, St. Louis, MO, USA) in Hank's balanced salt solution (HBSS; Gibco, Grand Island, NY, USA) for 1 h, followed by another dissociation in 0.125% trypsin (Gibco) in HBSS for 45 min. The isolated cells were subcultured in vitro in MCDB-120 culture medium [prepared as described by Ham et al. (5)] with 15% fetal bovine serum (Hyclone, Logan, UT, USA), 10 ng/ml basic fibroblast growth factor (Feldan, St. Laurent, QC, Canada), 0.5 mg/ml bovine serum albumin (Sigma), 1.0 μM dexamethasone (Sigma), and 5 μg/ml human insulin (Sigma). After the first passage, the cells were infected twice in vitro with a replication-defective retroviral vector LNPOZC7 (gift of Dr. Constance Cepko, Harvard University, Boston, MA, USA) encoding a LacZ (β-galactosidase) reporter gene and a neomycin resistance gene. The transduced cells were selected twice with 600 μg/ml Geneticin® (Invitrogen, Burlington, ON, Canada) within 4 days, proliferated until confluence, and frozen for storage in liquid nitrogen. A sample of cells to be frozen was analyzed to determine the percentage of cluster of differentiation 56-positive (CD56+) cells as an indicator of the percentage of myoblasts. These cells were incubated with a phycoerythrin-coupled anti-CD56 antibody (Beckman Coulter, Fullerton, CA, USA) and analyzed by flow cytometry. Depending on the cell line, 90–99% of cells were CD56+. To get an idea of the percentage of cells expressing β-galactosidase (β-Gal) at levels visible in the microscope, cultures were performed in Petri dishes (Sarstedt, Nümbrecht, Germany) at low density and stained with the same histochemical technique described below for β-Gal detection in muscle sections. β-Gal stain was visible in 83.5% of the cells in the microscope.
Cell Transplantation
For transplantation, the cells were thawed, proliferated during one or two passages in culture, detached from the flasks using 0.1% trypsin in HBSS, and washed three times with HBSS. The final cell pellets were resuspended in HBSS and injected as indicated below. The muscles used for cell injection were the biceps brachii, quadratus femoris, and gastrocnemius.
Cell transplantation was performed by percutaneous IM injections. Needle penetrations were perpendicular to the surface of the muscle, and the cell suspension was delivered into the muscle homogeneously during the needle withdrawal. In experiment 1, we performed a single injection with each needle size, spaced along a transversal line in the middle of the muscle. In experiments 2–4, we performed matrices of parallel injections at two densities: 100/cm2 and 25/cm2 (Fig. 1). Transplantations were performed with precision syringes (Hamilton, Reno, NV, USA) attached or not to a PB600-1 repeating dispenser (Hamilton). According to the volume to be injected per injection, the precision syringes were of 50, 100, or 250 μl. According to the experiment, different needle sizes were used as detailed below, that is, 27G, 22G, and 18G (Terumo, Somerset, NJ, USA). The amount of cells injected varied with the experiment, as detailed below. OpSite sterile transparent dressings with a 5-mm grid (Smith & Nephew, Hull, UK) were adhered to the skin to control the pattern of injections in experiments 2–4. In this case, transplants were performed on small sites covering an area of ~1 cm2 or less. To identify the injected muscle sites during biopsies, two stitches of inert nonabsorbable polypropylene 4.0 suture (Prolene, Ethicon Inc., Somerville, NJ, USA) were placed ~5 mm on both sides of each site. Up to three sites of 1 cm2were grafted per biceps brachii and quadratus femoris, and up to two sites of 1 cm2 were grafted per gastrocnemius. These sites were separated by 0.5-1.5 cm. Since the 27G needles used were approximately 1 cm long (Fig. 1C) and the skin thickness is very thin in young cynomolgus monkeys, this facilitates to refer volume of cell suspension and number of cells “per trajectory of about 1 cm.”
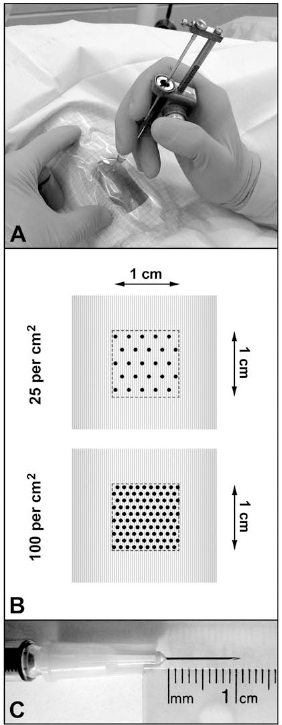
Intramuscular transplantation of cells into skeletal muscles of macaques by matrices of injections as performed in the study. (A) Transplantation in a macaque biceps brachium using a repeating dispenser with a precision syringe. Note the sterile transparent film with a 5-mm grid placed on the operative field to control the pattern of injections. (B) Illustration of the matrices with the two densities of injections used in the study (each point corresponds to a single needle penetration). (C) The 27G needles used in the study were approximately 1 cm long, making easier to refer the amount of cells or volume of cell suspension per injection trajectory of about 1 cm.
Variables of Cell Transplantation
The following variables were tested:
Needle size. We tested three sizes of injection needles currently used in the clinics, that is, 27G, 22G, and 18G.
Amount of cells. In the preliminary experiment, 104, 105, and 106 cells were injected per injection trajectory. In the final experiment, 102, 103, 104, 105, and 106 cells were injected per injection trajectory of about 1 cm.
Volume of cell suspension. 1 μl, 5 μl, and 25 μl of cell suspension were injected per centimeter of injection trajectory.
Immunosuppression
An IM formulation of tacrolimus (a generous gift from Astellas Pharma Inc., Osaka, Japan) was administered for immunosuppression, beginning 5-7 days before transplantation and maintained until the end of the experiment. Tacrolimus was injected IM once a day, beginning at 0.5 mg/kg/day and adjusting the dosage to target blood levels of >50 μg/L, as quantified in blood samples with an IMx tacrolimus II kit for microparticle enzyme immunoassay (Abbott, Wiesbaden, Germany).
Sampling
Muscle biopsies were performed 1 or 2 months post-implantation in the sites transplanted IM with myoblasts. In one monkey, we produced muscle damage by a single IM penetration with 27G, 22G, and 18G needles, and the sites were biopsied 1 day later. The muscle biopsies were mounted in embedding medium (Shandon™ Cryomatrix™; Thermo Scientific, Kalamazoo, MI, USA), snap-frozen in liquid nitrogen, and stored at −80°C until performing serial sections of 10–15 μm in a cryostat (Thermo Scientific) at −25°C.
Histological Analysis
Sections were stained routinely with hematoxylin and eosin (H&E; hematoxylin, Laboratoire Mat, Quebec, QC, Canada; eosin, Fisher Scientific, Hampton, NH, USA). For histochemical detection of β-Gal, muscle sections were fixed 3 min in 0.25% glutaraldehyde (Sigma), rinsed with phosphate-buffered saline (Sigma), incubated 24 h at room temperature in a solution containing 0.4 mM X-gal (5-bromo-4-chloro-3-indolyl-β-d-galactopyranoside) (Boehringer Mannheim, Vienna, Austria) from a 20 mg/ml stock in dimethylformamide, 1 mM magnesium chloride (both Sigma), 3 mM potassium ferrocyanide (J.T. Baker Chemicals, Phillipsburg, NJ, USA), and 3 mM potassium ferricyanide (Sigma) in phosphate-buffered saline, and mounted in 1:1 glycerin jelly (Sigma). To detect damaged myofibers 1 day after muscle damage, the sections were stained for 5 min in a 2% alizarin red (Sigma, Oakville, ON, Canada) solution at pH 5.4, followed by a brief rinse in water at pH 5.4 and then short passages in acetone (ACP, Montreal, QC, Canada), acetone/toluene (Fisher) 1:1, and toluene, to be mounted in synthetic resin (Permount®; Fisher). To detect signs of ongoing acute rejection, plus analysis of H&E-stained sections, we performed immunodetection with a mouse anti-human CD8 monoclonal antibody (clone RPA-T8, BD Biosciences, Mississauga, ON, Canada) and a mouse anti-human/cynomolgus CD4 monoclonal antibody (clone L200, BD Biosciences). The antibody cross-reactivity with cynomolgus monkeys was known by previous studies (14).
The muscle cross-sections were analyzed using an Axiophot microscope with epifluorescence and bright-field optics (Zeiss, Oberkochen, Germany), and pictures were taken with a digital camera A650 IS (Canon, Tokyo, Japan).
Quantitative Histological Analysis
Depending on the experiment, we quantified two different parameters of the engraftment in β-Gal-stained muscle sections. We performed the quantification on digital images taken with the microscope.
In experiment 1, we were interested to compare the width of the bands of β-Gal+ myofibers with the size of the needles. We thus measured the width of the bands of β-Gal+ myofibers at each 250 μm from end to end of the band. With these values, we calculated the average width of the band.
In experiments 2–4 (transplantation by matrices of injections), we wanted to know which variable produced the best engraftment, that is, a greater percentage of hybrid myofibers. For this, we estimated the percentage of the muscle surface that was β-Gal+ in the cell-grafted region. The areas of the β-Gal+ surface and the total muscle surface were measured using a computer image analyzer (NIH Image 1.61, Bethesda, MD, USA).
Statistical Analysis
Each value in the bar graphs is represented as the mean value of n = 2–8 sites of transplantation ± 1 SD (in some monkeys, there were two different sites in different muscles for the same variable). An ANOVA test with Tukey–Kramer post hoc tests was used to assess the probability of significant differences between variables in each experiment. Statistical significance was defined as p < 0.05.
Results
The analyses were carried out in the following sequence. First, we tested the effect of needle size on the engraftment and muscle structure after single cell injections (experiment 1). We then tested the same needle sizes for cell transplantation using matrices of injections and combined that with a preliminary test of the number of cells per injection (experiment 2). After choosing one needle size and the number of cells per injection, we analyzed the volume of cell suspension per injection (experiment 3). Finally, after choosing a volume of cell suspension, we performed a final analysis of the amount of cells needed per injection (experiment 4).
Experiment 1. Effect of Needle Size on IM Cell Transplantation: Single Injections
One month after IM single injections of β-Gal-labeled myoblasts (Fig. 2), the engraftment took the form of isolated “stripes” of β-Gal+ myofibers in the transversal sections of the injected muscles (Fig. 2A–C and I). Henceforth, these stripes of β-Gal+ myofibers will be called bands of engraftment. There was one band of engraftment per single myoblast injection. The orientation of each band, from the surface to the depth of muscle, corresponded with the trajectory of the cell injection.
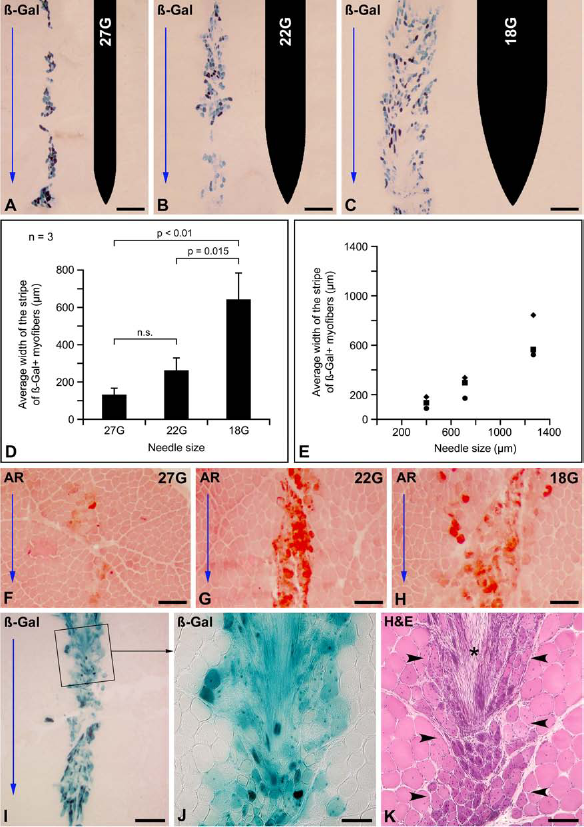
Experiment 1: Different needle sizes for single injections. (A–E) Effect of the size of the injection needle on the engraftment of β-galactosidase (β-Gal)-labeled myoblasts after a single intramuscular (IM) cell injection. (A–C) The result of each cell injection is a stripe of β-Gal+ myofibers in transversal sections of muscle 1 month after transplantation (β-Gal+ myofibers are observed in different degrees of blue greenish staining). The respective contour of each needle is displayed in the right of each panel. Blue arrows indicate the sense of the needle penetration. As can be observed (images A to C are from the same monkey), the stripes of β-Gal+myofibers are wider as the needle is wider, although the width of these bands and the density of β-Gal+ myofibers along them are not homogeneous. (D) A quantification of the average width of the bands of engraftment shows a relationship between the width of these stripes and the needle size. With the sample used (three monkeys, n = 3 for each variable), the difference was only significant for 18G needles with respect to the other. (E) Plotting the average width of each stripe of β-Gal+ myofibers against the outer standard diameter of each needle, we can observe that the needles are wider than the bands of engraftment that they produce. (F–H) Comparison of the muscle tissue damage produced by the different needle sizes tested, 1 day after a single IM needle penetration, in muscle transversal sections stained with alizarin red (AR). Blue arrows indicate the direction of the needle penetration. The injury caused by the needle is evidenced by the myofibers either being blurry or red stained by AR. The lateral spread of AR-stained myofibers increases with the size of the needle. (I–K) Histological consequences of a single IM injection of β-Gal+ myoblasts using an 18G needle, 1 month after the injection. As in C, the engraftment is seen as a wide stripe of β-Gal+ myofibers in a transversal muscle section (I). The blue arrow indicates the direction of the needle penetration. The region in the rectangle in I is shown at higher magnification in J. Although the width of the band of engraftment is considerable for a single injection, muscle regeneration was defective as observed in a serial section stained with hematoxylin and eosin (H&E) (K). H&E shows a disrupted muscle structure (between arrowheads), with incomplete regeneration of several myofibers (small, basophilic, and with several internal nuclei) and connective tissue proliferation (asterisk). Scale bars: 0.5 mm (A–C and I), 200 μm (F–H), and 100 μm (J and K).
Visually, thicker needles produced wider bands of engraftment, even if the width of the band and the density of β-Gal+ myofibers were not homogeneous along each band (Fig. 2A–C). The quantification of the average width of the bands of engraftment showed a relationship between this value and the needle size (Fig. 2D, E). With the sample used (n = 3), the difference was only significant for the 18G needles with respect to the other sizes (Fig. 2D). The average width of the bands of engraftment was smaller than the standard outer diameter of each needle (Fig. 2E). The width of the bands of engraftment seemed to be related to the extent of muscle damage produced by the needle, as revealed by the spread of the alizarin red-stained myofibers 1 day after a muscle damage produced by a single needle penetration (Fig. 2F–H).
While these results might lead to the conclusion that the use of thicker needles may be advantageous for a better engraftment, H&E stain showed that the muscle structure was abnormal in the region damaged by the 18G needles, leaving areas of incomplete and defective regeneration (Fig. 2I–K).
Experiment 2. Effect of Needle Size on IM Cell Transplantation by Matrices of Injections, Combined with Different Amounts of Cells per Injection
We then examined the needle size using matrices of cell injections. Since muscle regeneration in experiment 1 was incomplete with 18G needles, a 2-month follow-up was used in the present experiment. This was to allow a longer time to eventually complete muscle regeneration. The needle size was evaluated in combination with a first test of the amount of cells per injection. We selected 104, 105, and 106 myoblasts per injection trajectory, each needle penetration being of about 1 cm. We compared only 27G and 22G needles with matrices of 100 injections/cm2because 18G needles were too large to perform injections so close. For matrices of 25 injections/cm2, we compared only 22G and 18G needles because a previous study already showed that 27G needles produced a low degree of engraftment in that case [5–15% of β-Gal+ myofibers (17)]. We used four macaques: one for a preliminary test and three for quantification. One animal died prematurely and could not be used for quantification. However, as the experience was sufficient for us to decide to prioritize thin needles, we chose not to include another macaque in this experiment and to perform the final analysis of the optimal cell number after defining the appropriate volume for injection.
Engraftment
Muscle transversal sections illustrating the engraftment are shown in Figure 3A. β-Gal+ myofibers were scarce and dispersed in all cases in which 104cells were delivered per injection, so it was difficult to see bands of engraftment. Bands of engraftment were clearly seen with the injection of 105 and 106 cells per injection, even if sometimes there was overlap between bands. Since quantification was possible in only two monkeys, the sample size was very low (n = 2) to test the differences between each combination of variables (Fig. 3B). We pooled together 27G and 22G needles to evaluate the amount of cells using matrices of 100 injections/cm2(n = 4). The ANOVA test showed that 104 cells per injection gave significant lower engraftment compared to 105 and 106 cells, while there was no significant difference between these two last values (Fig. 3C). This allowed us to select 105 cells per injection for experiment 3.

Experiment 2: Analysis of transversal sections of muscle biopsies 2 months after transplantation of β-Gal+ myoblasts using different needle sizes (27G, 22G, and 18G), density of injections (25 or 100 injections/cm2), and amount of cells (104, 105, and 106 in about 1 cm of needle trajectory). (A) Examples of transversal sections of muscles stained for β-Gal detection in each experimental condition. The red arrows in the right indicate the original course of the needle in the adjacent row of panels. Scale bar: 1 mm (magnification is the same for all the panels). (B) Graphic representation of the engraftment for each condition (two monkeys, n = 2 for each condition). (C) Pooling 27G and 22G needles at 100 injections/cm2 (n = 4) reveals a significantly lower engraftment with 104 cells and no significant difference between 105 and 106 cells.
Intraoperative Bleeding
There was bleeding at almost each injection point with 18G needles. Bleeding was lower with 22G needles and negligible with 27G needles (a small blood drop at some points). Bleeding was immediately upon removal of the needle from each injection point, which could result in leakage of the injected cells.
Muscle Regeneration at 2 Months Posttransplantation
H&E stain showed different histological changes in the cell-injected regions. Most intense changes were observed in the muscles transplanted with 18G needles. At low magnification, there were focal regions darker than the rest of the tissue (Fig. 4A). These regions were elongated from the surface to the depth of the muscle, coinciding with the bands of engraftment in serial sections stained for β-Gal. At higher magnification, they were composed of small myofibers with round profiles, basophilia, and internal nuclei (Fig. 4B). There was also thickening of the endomysium with increased cellularity (Fig. 4B). These regions of imperfect muscle regeneration were evidently the tracks left by the needle penetrations in the muscle. Using a similar matrix of injections with 22G needles, the overall structure of the tissue at low magnification was well preserved. At higher magnification, there were some myofibers with reduced diameter, internal nuclei, basophilia, and irregular shapes in limited regions that were also evidently the tracks left by the needle trajectories (Fig. 4C). Myofiber changes were more diffuse using matrices of 100 injections/cm2 with thin needles, but the overall structure of the tissue at low magnification was well preserved (Fig. 4D). The most frequent change in muscles transplanted using 27G needles with matrices of 100 injections/cm2 was the presence of myofibers with internal nuclei (Fig. 4E), corresponding to recent myofiber regeneration. Small angular myofibers were sometimes observed (Fig. 4F). Since they usually correspond to denervation, this could imply that some small nerve branches were occasionally damaged by the injections. Other less frequent changes were myofiber “branching” or splitting, which probably corresponded to recent myofiber regeneration. The endomysium was well preserved with 27G needles.

Experiment 2: Main histological changes 2 months after myoblast transplantation by matrices of injections using different needle sizes. The figure shows transversal sections of muscle stained with H&E. Red arrows in A and D indicate the sense of the needles during transplantation. (A, B) Muscle injected with an 18G needle using a matrix of 25 injections/cm2. (A) At low magnification, most tissue appears normal except for darker regions (between arrowheads), elongated according to the original trajectory of the needle. (B) A higher magnification of the rectangle in A reveals that these darker regions are formed by myofibers with reduced size, rounded profiles, internal nuclei, and basophilia. There is also thickening of the endomysium with increased cellularity. (C) Using a 22G needle with the same injection density, there are regions with myofibers with reduced diameter, internal nuclei, basophilia, and irregular shapes. Muscle structure is preserved outside these focal regions with myofiber changes. (D–F) Muscle transplanted with a 27G needle using a matrix of 100 injections/cm2. (D) The general structure of the muscle appears normal at low magnification. (E) A higher magnification of the rectangle in D shows several myofibers with internal nuclei. (F) Arrows indicate two atrophic angular myofibers in the same muscle. Scale bars: 0.5 mm (A and D), 100 μm (B, C, and E), and 50 μm (F).
Experiment 3. Volume of Cell Suspension
Following the above results, subsequent experiments were done only with 27G needles. This choice was based on the fact that tissue damage was milder with 27G needles: bleeding was negligible (thus little vascular damage), and muscle histology was less altered. Given the results of experiment 2, 105 cells per injection trajectory were used. We compared a volume of 5 μl per injection trajectory (our previous standard in monkeys) reduced or increased by a factor of 5, that is, 1 μl (which resulted in the limit of the concentration of cells for the amount of cells transplanted) and 25 μl. Matrices were of 100 injections/cm2 for the reasons explained above. As the 27G needles were about 1 cm long, these values may relate per centimeter of injection trajectory.
Figure 5 shows the results of the experiment. In terms of engraftment, there were no significant differences between the delivery of 1, 5, or 25 μl of cell suspension per injection trajectory by the ANOVA test (Fig. 5D). However, the best results were obtained with smaller volumes of cell suspension, that is, five of eight biopsies in the 1 μl group had more than 25% of the muscle surface β-Gal+, against two of eight biopsies in the 5 μl group and zero of seven in the 25 μl group (Fig. 5E). In some biopsies of the 25 μl group, the distribution of the β-Gal+ myofibers was less homogeneous than in the other groups. One biopsy was excluded from quantification in the 25 μl group because there were no β-Gal+ myofibers, and we doubted whether the biopsy was taken in the right place. The presence of numerous myofibers with internal nuclei may indicate that this was the grafted region, but we preferred not to include it in the graphs (even if its inclusion would not change the significance between groups by ANOVA).

Experiment 3: Effect of the volume of cell suspension on the engraftment of β-Gal+ myoblasts. (A–C) Complete transversal sections of biopsies performed in cell-grafted muscle regions stained for histochemical detection of β-Gal in the same monkey. The same amount of cells was delivered per injection, using 1 μl (A), 5 μl (B), and 25 μl (C) of cell suspension per injection. The surface of the muscle is up, and red arrows indicate the sense of the needle penetrations. Scale bars: 1 mm (magnification is the same for the three images). (D) Graphic representation of the engraftment for each volume of cell suspension for all samples. There were no significant differences between the delivery of 1, 5, and 25 μl, but there is a tendency to have better results with smaller volumes of cell suspension. (E) Plotting each value separately and including a line at 25% β-Gal+ muscle surface (arrow) shows that five of eight biopsies in the 1 μl group are above the line, against two of eight biopsies in the 5 μl group and zero of seven in the 25 μl group. The n for each variable is indicated within the bars; there were four monkeys included in this experiment and two biopsies per variable and per monkey (one biopsy was excluded in the 25 μl group as explained in the text).
The delivery of 25 μl per injection produced leakage of the cell suspension at each injection. Leakage of the cell suspension at each injection point was lower with 5 μl and practically absent with 1 μl.
We concluded that small volumes of cell suspension were preferable in this context. We select 1 μl per injection trajectory of about 1 cm for the following experiment (see Discussion).
Experiment 4. Amount of Cells per Injection
After setting the variables of transplantation in matrices of 100 parallel injections/cm2, 27G needles, and 1 μl per injection trajectory of about 1 cm, the optimal number of cells per injection was tested using a larger range of values and a larger sample size. The amounts of cells were in multiples of 10, that is, 102, 103, 104, 105, and 106 cells per injection. Given that matrices of 100 injections/cm2 were used and that the 27G needles were about 1 cm long, these values were equivalent to 104, 105, 106, 107, and 108 cells per site of about 1 cm3.
As illustrated in Figure 6, the average density of β-Gal+ myofibers increased with growing amounts of grafted cells. The percentages of the surface of the transversal sections of muscle that was β-Gal+ were respectively 0.28 ± 0.35 (102 cells per injection), 1.5 ± 1.2 (103 cells), 13.8 ± 6.6 (104 cells), 33.2 ± 9.9 (105 cells), and 39.9 ± 6.5 (106 cells). For consecutive values, the ANOVA test showed significant differences only between 103 and 104 cells per injection (p = 0.0015) and between 104 and 105 cells per injection (p = 0.0001). The average β-Gal+ surface following the transplantation of 106 cells per injection was higher than following the transplantation of 105 cells per injection and the dispersion of values was smaller, but the null hypothesis that both groups of values were different was rejected by the ANOVA test (p > 0.1).

Experiment 4: Transversal sections of biopsies performed in cell-grafted muscle regions stained for histochemical detection of β-Gal (A–E). The sites were transplanted using matrices of 100 injections/cm2, and 1 μl of cell suspension was delivered per injection trajectory of about 1 cm containing different amounts of cells: 102 (A), 103 (B), 104 (C), 105 (D), and 106 (E). Scale bars: 1 mm (magnification is the same for histological panels). As can be seen in the graph (F), the muscle surface that was β-Gal+ increased with the amount of cells grafted, although there were no significant differences between 105 and 106 cells per injection. The n for each variable is indicated within or above the bars; there were four monkeys included in this experiment and one or two biopsies per variable and per monkey.
Control of Acute Rejection
There were no histological elements of rejection, that is, no focal accumulations of CD8+ and CD4+ lymphocytes around the hybrid myofibers as previously described (14) (data not shown). This confirmed that tacrolimus immunosuppression was adequate to control acute rejection and that the results represent myoblast engraftment, excluding the loss of β-Gal+ myofibers due to rejection.
Discussion
Skeletal muscles of nonhuman primates are better models for clinical extrapolation than mouse muscles in terms of size and regeneration capacity (1). This is one reason why we have been using macaques for several years for research on transplantation of myogenic cells (20). Another reason is the great resemblance from the point of view of transplantation immunology, which made the nonhuman primate the preferred animal for preclinical transplantation research (9,10).
So far, IM injection is the only route that engrafted myoblasts efficiently in skeletal muscles (20). The main constraint that must be faced when myoblasts are simply injected in large muscles is that they engraft essentially along the injection trajectories (20). This was evident in the present study: each single myoblast injection left a single track of hybrid myofibers in the muscle sections (what we called a band of engraftment). This constraint is not due to an inability of myoblasts to migrate out of the injection trajectories. Grafted myoblast migrate in monkeys, but do it to fuse with myofibers in which there is a process of regeneration able to recruit them (18). However, after myoblast injection in normal muscles, this regeneration occurs essentially only in the myofibers damaged by the injections (18). Therefore, to transplant myoblasts in the large muscles of macaques, we found no better option so far than to perform matrices of cell injections very close to each other (20). Injections are parallel to each other, perpendicular to the myofibers, penetrate the whole muscle, and deliver the cells homogeneously along each IM trajectory.
In a first approach to a quantitative definition of the IM transplantation of myoblasts in macaques, we established the relationship between the density of injections and the level of engraftment (17). The engraftment was proportional to the density of injections: matrices of 25 injections/cm2 lead to an average of 11% hybrid myofibers while matrices of 100 injections/cm2 lead to an average of 45% (17). In the present study, we analyzed other parameters: the needle size, the amount of cells per injection, and the volume of cell suspension per injection.
Needle size
It was obvious here that the grafted cells fused essentially with the myofibers damaged by the injection needle. Thicker needles produced more myofiber damage and resulted correspondingly in wider bands of engraftment. Consequently, we wonder if a technical variant as simple as using thicker needles for cell transplantation could produce an acceptable engraftment using fewer injections than those required with thin needles.
In all cases, 18G needles produced wider bands of engraftment than thinner needles. However, when matrices of cell injections were used, some bands of engraftment appeared faint or absent with 18G needles. We attributed this to the more abundant bleeding after cell delivery, which can cause significant cell leakage. The importance of bleeding is minor from the surgical point of view, but this reveals that the blood vessels are more damaged than with thin needles (and this probably applies to other structures such as nerves). Another factor against the use of large needles for matrices of injections is that the muscular structure was too altered in the injection trajectories, with incomplete regeneration and focal microscarring. We considered that the 27G needles produced the best balance between engraftment and undesired events: bleeding was negligible and muscle regeneration was better than with the other needles. Therefore, we decided to keep the 27G needles for transplantation in monkeys.
Optimal Volume of Cell Suspension per Injection
Our recent clinical trial phase IA (15) was done with manually operated Hamilton syringes of 100 μl, delivering 10 μl of cell suspension per injection. When we adapted PB600-1 repetitive dispensers for cell injection, which delivers 50 equal volumes per charge of syringe, we decided to use 250-μl syringes, delivering 5 μl of cell suspension per injection. This became our standard procedure in monkeys (20) and was used in a human (16) and in rabbits (3). Since the volume of cell suspension per injection was chosen arbitrarily, we wonder to what extent it could be reduced or increased. A priori, higher volumes could favor infiltration of the cell suspension through the dissection of perimysium (18), which may have the advantage of spreading the cells in the muscle. On the other hand, low volumes of cell suspension may concentrate the cells at the sites of injection.
After experiment 3, we concluded that the smaller volumes of cell suspension were preferable with the present transplantation protocol. This was based on four reasons: (a) there was a tendency to obtain better results with smaller volumes of cell suspension; (b) leakage of the cell suspension in each injection was significant with 25 μl, reduced with 5 μl, and virtually absent with 1 μl; and (c) the delivery of smaller volumes of cell suspension could reduce the postoperative edema by tissue imbibition.
Amount of Cells per Injection
We analyzed a wide range of cell amounts per injection after setting the other parameters of transplantation (matrices of 100 parallel injections/cm2, 27G needles, and 1 μl of cell suspension per injection trajectory of about 1 cm). Virtually all cells were myoblasts according to CD56 expression by flow cytometry. Although all cells were resistant to Geneticin selection, not all were clearly β-Gal+ by histochemical staining. The percentage of cells in culture that were clearly β-Gal+ under microscopic observation was 83.5%. Therefore, it can be considered that this was the level of detection of the histochemical method used to detect β-Gal or that this was indeed the percentage of cells able to express β-Gal. In any case, this does not change significantly the range of cell amounts recommended for transplantation.
Indeed, the amount of β-Gal+ myofibers was dependent on the amount of cells delivered per injection. In the experiment, the cells were injected into a trajectory of approximately 1 cm. As the cells would be diluted in longer trajectories, we thus refer the amount of cells per centimeter of injection trajectory. According to the present results, the optimum amount of cells should be of 105 myoblasts/cm of injection trajectory. Greater values (up to 106 myoblasts/cm of injection trajectory) may ensure optimal results, but this requires increased resources of cell culture. The use of suboptimal amounts (e.g., 104 myoblasts/cm of injection trajectory) may be useful to analyze in macaques methods aiming to improve the engraftment by enhancing cell survival or cell proliferation after transplantation.
A couple of final remarks might be pertinent:
The engraftment in this study did not exceed 50% of the muscle. To increase the engraftment with the present protocol, we see no alternative but to increase the density of injections, either in a same procedure (e.g., using intercrossed matrices of injections) or by several transplantation sessions. However, since some grafted cells remain as satellite cells able to participate in later muscle regeneration (4,6,7,19), the effect of transplantation may not be limited to the early engraftment. Potentially, the engraftment could increase over time in myopathic patients, if occurs a phenomenon similar to that reported in mdx mutation of the X-linked dystrophin gene (mdx) transgenic mice, that is, an expansion of myofibers expressing dystrophin during aging (22) or repeated exercise (2).
The IM route has also been proposed in other fields of cell transplantation. Examples include transplantation of pancreatic islets for the treatment of diabetes (12,21) and angiogenic cells for the treatment of limb ischemia (8,11). Although the parameters studied here refer specifically to myogenic cells, some of our observations could be useful to researchers in these other areas.
Conclusions
The following parameters should be used for IM transplantation of myoblasts using high-density injections matrices in muscles of nonhuman primates and probably in humans:
Needles should be thin enough to prevent important tissue damage leading to regions of defective muscle regeneration and to reduce injury of other structures such as vessels and nerves. Among the commercially available injection needles that were tested, 27G should be the choice if the length is consistent with the depth to inject. Maybe in the future it will be possible to design specific needles to the needs of cell transplantation protocols requiring matrices of close parallel injections.
At least 105 myoblasts should be delivered per centimeter of injection.
The smallest volumes of cell suspension per injection should be preferred. In this study, 1 μl/cm of injection trajectory was sufficient.
In principle, these parameters apply to muscles in which no damage occurred other than the injections. They could change if treatments are used to induce extensive myofiber regeneration.
Footnotes
Acknowledgments
This work was supported by a grant of the Jesse's Journey Foundation for Gene and Cell Therapy of Canada to Dr. Daniel Skuk. Authors' contribution: The concept, design, animal procedures, analysis, interpretation, and writing correspond to D.S. M.G. was responsible for all laboratory techniques. J.P.T. is the director of the research team. The authors declare no conflicts of interest.