
Abstract
Organ transplantation is a life-saving procedure and the preferred method of treatment for a growing number of disease states. The advent of new immunosuppressants and improved care has led to great advances in both patient and graft survival. However, acute T-cell-mediated graft rejection occurs in a significant quantity of recipients and remains a life-threatening condition. Acute rejection is associated with decrease in long-term graft survival, demonstrating a need to carefully monitor transplant patients. Current diagnostic criteria for transplant rejection rely on invasive tissue biopsies or relatively nonspecific clinical features. A noninvasive way is needed to detect, localize, and monitor transplant rejection. Capitalizing on advances in targeted contrast agents and magnetic-based detection technology, we developed anti-CD3 antibody-tagged nanoparticles. T cells were found to bind preferentially to antibody-tagged nanoparticles, as identified through light microscopy, transmission electron microscopy, and confocal microscopy. Using mouse skin graft models, we were also able to demonstrate in vivo vascular delivery of T-cell targeted nanoparticles. We conclude that targeting lymphocytes with magnetic nanoparticles is conducive to developing a novel, noninvasive strategy for identifying transplant rejection.
Keywords
Introduction
Organ transplantation is the preferred modality of treatment for patients with a variety of life-threatening diseases; a wide variety of organs including lung, heart, kidney, pancreas, and liver are routinely transplanted. During the past 20 years, the short-term outcomes after transplantation have improved greatly due to potent immunosuppressive drugs to prevent acute rejection (17). The immunological reaction of acute rejection within 1 year after transplantation varies with the organ site and occurs in fewer than 15% of patients in renal transplants or as many as 55% in lung transplants (13, 36). Regardless of the transplanted organ, acute rejection is one of the major causes of functional failure in organ transplantation and is also a major risk factor for chronic rejection and reduced allograft life (22, 32, 47).
The current standard for posttransplant surveillance relies on examination of surrogate measures of graft function, such as serum protein levels and the detection of creatinine in the case of renal transplants, and nonspecific physical signs, such as graft tenderness; however, these measures do not represent adequate markers of graft rejection (4, 25, 40). The only definitive method currently available to detect acute rejection is biopsy, which allows both confirmation of rejection and determination of rejection type (25, 40). However, biopsy presents risks to the patient, as well as issues with sampling error due to the focal nature of rejection (25, 40, 45). To address these issues, intensive research has focused on the development of imaging modalities for diagnosis of transplant rejection. Ultrasound, computed tomography (CT), and magnetic resonance imaging (MRI) are growing modalities in assessment of transplanted organs (14). However, each of these modalities has potential limitations. Ultrasound, the most commonly used technology, has gained so much support that some medical centers have started to include serial ultrasound to detect changes in the graft. Unfortunately, the effectiveness of this method has not been determined (8, 25). Although CT allows rapid detection of the vascular state of the graft, ionizing radiation limits repeated use, and the vascular state lacks specific features for rejection (14). MRI, also successfully used to image transplants, has the advantages of superior resolution and no ionizing radiation; however, MRI suffers from the lack of specific features for transplant rejection (14). Unfortunately, transplant rejection has specific features that cannot be detected by all of the above-mentioned techniques (3, 14). To provide optimal care, it is crucial that a noninvasive detection procedure be developed to identify the accumulation of immune cells at sites of tissue rejection.
In the majority of cases, acute rejection involves the infiltration and destruction of tissue by T cells (12). The ability to monitor the migration and localization of specific cells in vivo, noninvasively, and in real time would advance the understanding of both physiologic and pathologic conditions and improve clinical care by providing clinicians a sensitive tool that can yield valuable information. Magnetic nanoparticles, which have become increasingly important in both targeting and detecting cancer cells, can be applied to transplant rejection. Cellular targeting may be achieved through attachment of receptor-specific ligands, including antibodies. In this study, we concentrate on the development of targeted antibody-conjugated superparamagnetic iron oxide particles that can provide a specific imaging tool for monitoring T-cell invasion into transplanted tissues.
Materials and Methods
Cell Lines
Jurkat (ATCC Cat. No. TIB-152) cell line was purchased commercially from the American Type Culture Collection (ATCC) (Manassas, VA, USA) and cultured as recommended.
Determination of Receptor Site Density on Live Cells
Cluster of differentiation 3 (CD3) receptor site densities were determined for Jurkat using flow cytometry. One hundred thousand cells were incubated with 1.5 μg of mouse fluorescein isothiocyanate (FITC)-labeled anti-CD3 antibodies (GeneTex, Irvine, CA, USA). Labeled cells were analyzed for site densities using FACSCalibur (Becton-Dickinson, San Jose, CA, USA) flow cytometry as described previously (18).
Production of Ligand-Bearing Nanoparticles
The antibody was attached to the nanoparticles using the carbodiimide method briefly described here. Nano-particles (30 nm) were purchased from Ocean NanoTech (Springdale, AR, USA). Ten milligrams of nanoparticles was aliquoted into Eppendorf tubes (Bioexpress, Kaysville, UT, USA) and centrifuged at 7,500 relative centrifugal force (RCF) for 1 h. The supernatant was removed, and the nanoparticles were then resuspended in 10 ml of double-distilled water in a 15-ml conical tube (Greiner Bio-One, San Diego, CA, USA). Fresh N-hydroxysulfosuccinimide (sulfo-NHS) and 1-ethyl-3-(3-dimethylaminopropyl) carbodiimide (EDC; both from Pierce, Rockford, IL, USA) were individually prepared at a concentration of 25 mg/ ml in double-distilled water. One hundred microliters of each of the EDC and sulfo-NHS was added to the nanoparticles and incubated at room temperature with mixing for 20 min. Following activation with EDC and sulfo-NHS, the nanoparticle mixture was brought to pH 8.0 with 50 mM NaHCO3 (Sigma-Aldrich, St. Louis, MO, USA). After pH adjustment, 500 μg of anti-CD3 (BioLegend, San Diego, CA, USA) antibody or 5 mg of bovine serum albumin (BSA; Sigma-Aldrich) was added, and the mixture was incubated at room temperature with mixing for 2 h. The conjugate-nanoparticle mixture was centrifuged at 7,500 RCF for 30 min at room temperature. The supernatant was removed, and nanoparticles were washed with 10 ml of double-distilled water. The centrifugation parameters were repeated, and the supernatant was removed. The nanoparticle pellet was resuspended in a total volume of 800 μl of double-distilled water and 200 μl of phosphate-buffered saline (PBS; Gibco-BRL, Rockville, MD, USA)/0.5% fetal bovine serum (FBS; HyClone, Logan, UT, USA). Conjugated nanoparticles were stored at 4°C prior to use.
In Vitro Labeling of T Cells with Conjugated Nanoparticles
Jurkat cells were harvested using EDTA (Irvine Scientific, Santa Ana, CA, USA) and washed using PBS. Harvested cells were counted using trypan blue (Sigma-Aldrich) and a hemocytometer (Hausser Scientific, Horsham, PA, USA). Unless otherwise stated, approximately 1×10⁶ cells were suspended in 200 μl of cold PBS/0.5% FBS solution, and a total of 100 μl of 3 mg/ ml conjugated nanoparticles was added to the cells and incubated at 4°C for 30 min. After completion of magnetic relaxometry measurements, glass slide preparations were made using a cyto-centrifuge (Shandon, Pittsburgh, PA, USA). Slides were stained with either Diff-Quik stain (Dade Behring, Newark, DE, USA), which is similar to a Wright–Giemsa stain, or Prussian blue stain (see later), which reveals the presence of iron(III) ions.
Cell Detection Using SQUID-Detected Magnetic Relaxometry
Cell–nanoparticle attachment was quantified using magnetic relaxometry, which involves briefly magnetizing the nanoparticles using a pulsed magnetic field and then detecting the decaying magnetization of particles over time using Superconducting Quantum Interference Device (SQUID) sensors (20, 21). The SQUID sensor array consists of seven second-order gradiometers with a central sensor surrounded by six sensors in a 2-cm circle. This configuration permits localization of bound nanoparticle sources and determination of their magnetic moment; the latter is used to determine the number of particles in the sample. Two possible decay mechanisms are present, depending on whether the nanoparticles are bound or unbound: the Néel mechanism and Brownian rotation. The Néel mechanism, which dominates the relaxation of cell bound nanoparticles, involves internal reorientations of the nanoparticle magnetic moment and gives a detectable signal by magnetic relaxometry. The magnetization of unbound nanoparticles in fluid decays by Brownian rotation of the particle, which is too rapid to be detected by magnetic relaxometry. The SQUID-detected magnetic relaxometry method has been described in detail previously (20). Briefly, samples in 1.5-ml microcentrifuge tubes were centered under the BTi 2004 seven-channel low-temperature SQUID array (4D-Neuroimaging, San Diego, CA, USA). The sample is located at a distance z ≈ 3 cm below the bottom of the sensor array. A uniform magnetic field of 4.9 mT was produced at the location of the sample using a pair of 49-cm-diameter, 100-turn Helmholtz coils powered by a 5-kW current-regulated supply (Sorenson SGA 80/63; Ametek Programmable Power, San Diego, CA, USA). The decaying magnetization was sampled at a rate of 8 kHz (beginning 35 ms after switching off the magnetizing pulse), digitized using a National Instruments PXI8336 16-channel digitizer, and acquired using software written in LabWindows™/CVI (National Instruments, Austin, TX, USA). Our standard measurement protocol is to apply a 4.9-mT field for 0.75 s and then acquire the decaying magnetization for 2.215 s, 10 times, subsequently averaged to improve signal-to-noise. Analysis of the relaxometry data was performed using the Multi-Source Analysis (MSA) program, a software package developed in our lab, also written in LabWindows™/CVI, as discussed previously (30). For quantifying the binding specificity, we added CD3-positive nanoparticles to the cells. To determine the receptor-specific association of nanoparticles, the nonspecific BSA signal was subtracted from the antibody-based signal to produce a specific binding curve.
DC Susceptometry
Direct current (DC) magnetic characterizations of stock nanoparticles were performed using a Magnetic Property Measurement System-7 (MPMS-7) SQUID magnetometer system (Quantum Design, San Diego, CA, USA). DC magnetization curves were acquired by equilibrating the sample at the measurement temperature, then incrementally increasing the field and pausing 100 s at each field before measurement. Five sequential measurements were taken at each field, a mean of those measurements calculated, and the three values with the lowest deviation from the mean were averaged and reported as the moment. Zero field cooled (ZFC) curves were determined by cooling the sample in the absence of a magnetic field to 5 K, then slowly warming in a 1-mT field. After thermally equilibrating at a target temperature, a series of five measurements was taken, and the values were processed as described to obtain the magnetization value.
Transmission Electron Microscopy
The nanoparticles were imaged by transmission electron microscopy (TEM) using a Tecnai G2 F30 at 300 kV (FEI Corporation, Hillsboro, OR, USA). Size distributions were determined from the TEM images using ImageJ (public domain software from the National Institutes of Health, Bethesda, MD, USA). Briefly, the Feret diameter (defined as the maximum caliper diameter) was measured from a sample of approximately 1,000 particles selected from multiple TEM images. Particles in contact with the edge of an image were automatically excluded, and overlapping particles were manually excluded from the size analysis.
Jurkat cell samples were fixed in 3% glutaraldehyde in 0.1 M sodium cacodylate buffer, pH 7.4 (both Electron Microscopy Sciences, Hatfield, PA, USA), for 1 h on ice, then pelleted and resuspended in 4% low melting point (LMP) agarose (GibcoBRL 15517-014), pelleted in the molten agarose, then chilled on ice. Solidified agarose containing the cells was minced and fixed overnight at 4°C with 3% glutaraldehyde in 0.1 M sodium cacodylate buffer, pH 7.4. Cell blocks were postfixed for 1 h at room temperature (RT) in 1% osmium tetroxide + 0.5% potassium ferrocyanide (both Sigma-Aldrich) in 0.1 M cacodylate, dehydrated through ethanol to acetone, and embedded in Epon-Araldite resin (Electron Microscopy Sciences). Sections (unstained) were examined in a Hitachi H7500 TEM (Hitachi, Ltd., Tokyo, Japan), and images were taken with an Advanced Microscopy Techniques (AMT; Woburn, MA, USA) camera.
Prussian Blue Stain
Slides were fixed by dipping five times in 0.01% sodium azide (Sigma-Aldrich) in 1 g/L xanthene dye (Siemens, Newark, DE, USA). Potassium ferrocyanide solution was prepared fresh with a 1:1 solution of 20% of HCl and 10% potassium ferrocyanide. The potassium ferrocyanide solution was applied directly to the cell sample on the slide and incubated in the dark for 20 min. The slides were then dipped in double-distilled water three times. Brazilliant (Anatech Ltd., Battle Creek, MI, USA) was applied directly to the cell sample on the slide and incubated in the dark for 5 min. The slides were dipped in double-distilled water three times and allowed to dry. The slides were than coverslipped with Cytoseal XYL (Richard-Allen Scientific, Kalamazoo, MI, USA).
Confocal Microscopy
Cells grown on glass coverslips (VWR, Radnor, PA, USA) were incubated with nanoparticles as described above, and then fixed in 4% paraformaldehyde (Electron Microscopy Sciences) in PBS. Following several washes in PBS, cells were blocked in PBS containing 5% normal goat serum (NGS; Sigma-Aldrich), then incubated in goat anti-mouse IgG conjugated to Alexa 488 (Invitrogen, Carlsbad, CA, USA; diluted 1/250 in PBS/NGS) for 45 min at room temperature. During the last 20 min of incubation, 26 nM rhodamine-conjugated phalloidin (Invitrogen) was added to label actin filaments. After washing in PBS, cells were incubated in 4′,6-diamidino-2-phenylindole (DAPI, Invitrogen) to counterstain nuclei and inverted onto a drop of antifade mounting medium on a glass slide. Images were captured on a Zeiss 510 confocal microscope (Carl Zeiss Microscopy, LLC, Oberkochen, Germany) and further manipulated (channels merged, labels added) using Adobe Photoshop software (Adobe Systems, Inc., San Francisco, CA, USA).
In Vivo Delivery of CD3-Labeled Nanoparticles
Mice were handled in accordance with a protocol approved by the Institutional Animal Care and Use Committee (IACUC) at the University of New Mexico Health Sciences Center. C57Bl/6 and FVB mice were purchased from Harlan Laboratories (Indianapolis, IN, USA) and were subsequently bred in-house in closed colonies. Male mice, 6–8 weeks old, were used for all experiments. Skin transplantation in mice is a well-established model of rejection (5, 26, 29, 46). We performed skin transplants using ear skin from either Friend leukemia virus B strain (FVB) or C75BL/6 donors to the backs of recipient FVB mice, 12 days prior to nanoparticle exposure. For direct intravenous application of nanoparticles, animals were injected by retro-orbital injection with 0.3 mg of antibody-labeled nanoparticles suspended in 100 μl of PBS (37, 50). For adoptive transfer (15, 31), CD5 T cells were harvested from lymph nodes and spleens from matched animals using the autoMACS separator (Miltenyi Biotec, Auburn, CA, USA) and CD5-labeled magnetic microbeads (Miltenyi Biotec). Cells were then incubated with nanoparticles conjugated to antibodies to mouse CD3 for 15 min. Following incubation, cells were transferred into mice by retro-orbital injection. After 24 h, animals were killed, and the transplants harvested. Transplants were processed and stained for iron by Prussian blue, hematoxylin and eosin stain, and immunohistochemistry for CD3 by Tricore Reference Laboratories (Albuquerque, NM, USA).
Results
Characterization of Ligand-Bearing Nanoparticles
Iron oxide nanoparticles were conjugated covalently to anti-CD3 antibody using the carbodiimide method; the biochemical reactions for carboxyl nanoparticle conjugation are shown in Figure 1A. After conjugation, the characteristics of the ligand-bearing nanoparticles were assessed by TEM to determine the size distribution, iron assay to determine iron concentration, and DC susceptometry for characterization of magnetic properties.
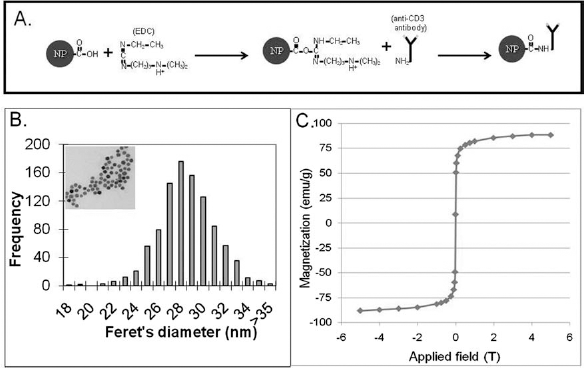
Characterization of antibody-labeled nanoparticles. Illustration depicts covalent reaction between antibodies and Ocean carboxyl nanoparticles (A). Ocean SHP (lot 091008) nanoparticles were imaged by transmission electron microscopy (B, inset). The diameters of ~1,000 nanoparticles were measured, and the mean and standard deviation were determined (B). Ocean SHP (lot 091008) nanoparticles dried onto a cotton tip were measured by direct current (DC) susceptometry (C) to determine the magnetic moment (M) per gram of magnetite as a function of magnetic induction (B). NP, nanoparticles; EDC, 1-ethyl-3-(3-dimethylaminopropyl)carbodiimide; CD3, cluster of differentiation 3.
The particle size distribution shown in Figure 1B was determined by measuring the maximum caliper diameter (Feret's diameter) of 980 particles using ImageJ, resulting in a mean particle diameter of 28.0 nm with a standard deviation of 2.5 nm, indicating very low size polydispersity. A representative TEM image is shown in the inset. Figure 1C shows the nanoparticle magnetization as a function of applied field, obtained at 295 K for a known quantity of CD3-conjugated nanoparticles, immobilized by drying the solution on a cotton swab to simulate nanoparticles bound to cells. The mass of iron oxide in the sample was determined based on an iron assay of the nanoparticle solution used to prepare the immobilized sample, which enabled the magnetization per gram of iron to be determined (2). The magnetization versus applied field curve has the expected shape for superparamagnetic (i.e., unblocked) particles. No hysteresis in the magnetization was observed, further confirming that the majority of particles in the distribution are superparamagnetic at room temperature. The saturation magnetization was found to be 88 emu/g, only slightly lower than the bulk value for Fe3O4 (92 emu/g), suggesting that the nanoparticles are highly ordered.
Specific Binding of Antibody-Tagged Nanoparticles with CD3-Expressing Cells
The association of the nanoparticles with CD3-expressing T cells is predicted to be a time-dependent event. To understand the binding relationship between antibody-tagged nanoparticles and CD3-expressing T cells, an incubation time course was analyzed. Jurkat cells were incubated with antibody- or BSA-tagged nanoparticles and then fixed at 1, 5, 15, or 30 min of incubation. The bound nanoparticles were detected by indirect immunofluorescence using Alexa 488-conjugated anti-mouse IgG or anti-BSA. Cells were also incubated with rhodamine phalloidin to fluorescently label the actin cytoskeleton and counterstained with DAPI to visualize nuclei. Using confocal microscopy and fluorescent detection of nanoparticles, we detected significant anti-CD3 nanoparticle association with Jurkat cells at each time point, but very limited association of BSA-tagged nanoparticles with Jurkat cells (Fig. 2). There is very limited colocalization of the rhodamine phalloidin-tagged actin cytoskeleton with the Alexa-488-tagged nanoparticles, suggesting that the nanoparticles remain associated with the cell membrane and are not taken into the cell within the 30-min incubation period. To further examine this, we performed TEM analysis on Jurkat cells incubated with either CD3 antibody- or BSA-tagged nanoparticles for 30 min. TEM images showed that the majority of the nanoparticles remained membrane associated during the 30 min, rather than internalized (Fig. 3). The TEM images show high levels of antibody-tagged nanoparticle association with the cell surface and limited binding of the BSA-coated nanoparticles, which demonstrates specificity of the antibodytagged nanoparticles.

Detection of cell–nanoparticle association by fluorescent immunodetection and confocal microscopy. Cells were incubated with bovine serum albumin (BSA) or CD3 antibody-labeled nanoparticles and then fixed at the times indicated. The fixed cells were incubated with fluorescently labeled secondary antibody (green label) to detect the BSA or CD3 antibody-labeled nanoparticles and counterstained with rhodamine phalloidin (red label). Scale bars: 20 μm.

TEM images of BSA and CD3 antibody-labeled nanoparticles of Jurkat cells. Cells were incubated with BSA or CD3 antibody-labeled nanoparticles and then fixed after 30 min. The fixed cells were then examined by transmission electron microscopy (TEM) at two magnifications to determine the degree of nanoparticle attachment. Scale bars: 500 nm.
Evaluation of Time Course of Nanoparticle Binding to T Cells
To further quantify the binding of the antibody- and BSA-coated nanoparticles to CD3-expressing cells, we used a novel technology, SQUID-detected magnetic relaxometry, over a 30-min time course. Jurkat cells were incubated with antibody- or BSA-tagged nanoparticles for 30 min, and samples were taken at 1, 5, 15, and 30 min postincubation. Histology was used to assess visually the nanoparticle binding over the course of 30 min (Fig. 4A). Examination of the histology showed significant binding by 1 min of incubation and increased binding at 5, 15, and 30 min, demonstrating the same characteristics previously seen by confocal microscopy.

Antibody-tagged nanoparticle incubation time course. Jurkat samples were incubated with anti-CD3- or BSA-tagged nanoparticles and measured by histology and with magnetic relaxometry to determine the total magnetic moment of each sample. Photomicrographs of the cells at each time point were obtained to qualitatively assess the increase in nanoparticle binding over time; scale bar: 20 μm (A). Magnetic relaxometry measurements were taken every 2 min beginning at 1 min (B). Specific signal was calculated by subtracting the non-receptor-mediated signal (BSA) from the anti-CD3 receptor-mediated signal (C). The curves represent nonlinear fits of the data. Data represent results from three separate experiments.
During the 30-min incubation, magnetic relaxometry measurements were performed from 1 to 29 min, with measurements taken every 2 min (Fig. 4B, C). Magnetic relaxometry detects only those nanoparticles that have bound, allowing quantification of nanoparticle binding (33). These results show a strong increase in binding within the first 5 min and a slower increase in binding after the first few minutes. BSA-tagged nanoparticles also showed increased binding over time both by histology and SQUID, although the amount of binding is significantly decreased when compared to the CD3 antibody-tagged nanoparticles.
Quantifying Binding Specificity Using SQUID Relaxometry
To determine the range and limits of cellular detection using SQUID technology, we first incubated a fixed number of cells (1×10⁶) with varying numbers of nanoparticles (Fig. 5A). This experiment indicated that our minimal and saturation levels of nanoparticle detection were 8.6×10¹⁰ and 8.7×10¹¹, respectively. We also performed the reciprocal experiment. We incubated a fixed number of CD3-coupled nanoparticles (2.9×10¹²) with varying numbers of cells (Fig. 5B). These results indicate a theoretical limit of detection of ~17,000 cells, since a magnetic moment of 3×10⁴ is considered a background signal. A maximal saturation signal occurred with 3×10⁶ cells. Since there are ~2.83×10⁵ (SEM ~2×10⁴, n = 10) CD3 receptors per cell when assessed by quantitative flow cytometry (data not shown), the saturation signal is likely due to a limit in the availability of cell surface receptors. Saturation was observed with 3×10⁶ cells, which had ~8.5×10¹¹ receptors available for binding of the 2.9×10¹² nanoparticles.

Magnetic relaxometry-based detection of specific nanoparticle binding. The number of nanoparticles was varied with a fixed number of 1.0×10⁶ Jurkat cells (A), and the numbers of cells were varied and incubated with a fixed number of 2.9×10¹² nanoparticles (B). The non-receptor-mediated association relaxometry signal from the BSA-tagged particles was subtracted from the antibody-tagged nanoparticles relaxometry signal to show the specific signal. The line showing minimum detectable signal represents the minimum signal above background that can be detected by a Superconducting Quantum Interference Device (SQUID). The line showing saturation represents the number of cells or nanoparticles required to achieve saturation. Data represent results from three separate experiments.
In Vivo Delivery of Nanoparticles to Rejecting Tissue
In order to examine if nanoparticles can be effectively delivered to a site of transplant rejection, we performed two sets of in vivo experiments. First, we injected CD3-coupled nanoparticles into mice with allogeneic skin transplants (i.e., skin rejection). We examined the skin histologically for the presence of iron using Prussian blue stain and for T cells using CD3 immunohistochemical stain. We compared our findings in the allogeneic transplants with skin transplants from syngeneic mice (i.e., nonrejecting but healing skin). Our results showed a significant increase in the number of nanoparticles in the rejecting allogeneic skin in comparison to the healing syngeneic skin grafts (Fig. 6).

Prussian blue staining of in vivo delivery of nanoparticles to accepting and rejecting transplants. Mice with rejecting or accepting skin transplants were intravenously injected with CD3-targeted nanoparticles. Harvested transplant sites were stained with Prussian blue to show the accumulation of iron nanoparticles, CD3 to show the accumulation of T cells within the transplant sites, and H&E. Scale bar: 50 μm.
We also examined the ability of T cells labeled with CD3-coupled nanoparticles to localize to sites of skin rejection by conducting adoptive transfer studies. In these studies, T cells isolated from mice that had undergone transplant with either allogeneic or syngeneic skin grafts were labeled with CD3-coupled nanoparticles and injected. These T cells were injected intravenously into matched mice to determine if nanoparticle-labeled T cells would localize to the site of skin grafts (Fig. 7). Using CD3 immunohistochemical stain or Prussian blue stain for iron, we determined that mice that had undergone allogeneic skin rejection showed a marked increase in T cells that localized to skin grafts in comparison to T cells from mice with syngeneic grafts.

Prussian blue staining of in vivo delivery of nanoparticle-labeled T cells to accepting and rejecting transplants. Mice with rejecting or accepting skin transplants were intravenously injected with T cells harvested from syngeneic mice and incubated with antibody-tagged nanoparticles targeted to mouse CD3. Harvested transplant sites were stained with Prussian blue to show the accumulation of iron nanoparticles, CD3 to show the accumulation of T cells within the transplant sites, and H&E. Scale bar: 50 μm.
Discussion
Imaging technology such as the one described here is preferable to current biopsy-based approaches, since frequent assessments of graft function in the early posttransplant setting could be made without risk of patient complication. T-cell invasion in transplant rejection is especially amenable to imaging. Normally, only a small portion of T cells respond to a particular antigen; however, the responding portion of T cells to a transplant can be 1–10% of the total T-cell population, suggesting that ample cells would be present during both clinical and subclinical acute rejection and, thus, facilitate imaging (36). Ultimately, the detection of these live T cells in organ rejection using imaging technologies has the potential to require fewer invading T cells as well as to provide a less invasive method than biopsy sampling, which provides a clear advantage to patient care. In this study, we developed antibody-tagged nanoparticles that label T cells as a step toward development of contrast agents that will provide a sensitive measure of transplant rejection. Nanoparticle-based detection can be effectively used for continual monitoring of the patient's response to immunosuppression because of the low toxicity of iron oxide particles and detection without ionizing radiation (7, 23, 27).
As a primary step toward development of a T-cell-specific, nanoparticle-based contrast agent, Jurkat cells, which are CD3+, were used as model T cells for development of the targeted nanoparticles. We chose to initially study CD3, as it is an important T-cell marker because it colocalizes with CD4- and CD8-positive T cells, both of which have been shown to be important in allograft rejection and to accumulate at sites of acute rejection (36). We were able to show specific binding of the antibody-tagged nanoparticles to the Jurkat cells using multiple imaging modalities including bright-field microscopy, confocal microscopy, and TEM. The addition of the magnetic relaxometry technology also allowed us to detect as few as 17,000 Jurkat cells; since peripheral blood T cells have ~1.9×10⁵ CD3 receptors per cell (data not shown), ~25,000 native T cells would be needed for detection by this technology.
Using a mouse model, we were also able to demonstrate vascular delivery of CD3-targeted nanoparticles via two different methods. We demonstrated direct nanoparticle delivery via the vascular system as well as delivery of nanoparticle-labeled harvested T cells using an adoptive transfer model. Either approach showed a marked increase in T cells infiltrating allogeneic grafts in comparison to syngeneic grafts. In many diseases in which the presence of the disease is uncertain or the cells of interest are not readily available, such as cancer, direct vascular injection of a contrast agent is the standard. However, in the case of transplant rejection, where the cells of interest are known and readily available via the venous system, direct labeling of the cells followed by adoptive transfer can provide some advantages. Direct labeling allows confirmation that the correct cell population has been labeled and reduces the background in organs such as the liver or kidneys, which filter most contrast agents from the blood. Direct labeling also has the advantages of allowing for direct tracking of labeled cells in vivo (43, 49). Additionally, adoptive transfer of T cells, called adoptive cell therapy, has been under development for clinical treatment of melanoma for 20 years and has shown promise as a clinical therapy (28). Adoptive therapy is being developed for leukemia and breast, gastrointestinal (GI), and lung cancers as well (53). Adoptive cell therapy is currently being proposed for the treatment of a variety of cancers, and labeling of the transferred cells by nanoparticles may allow enhanced understanding of the effectiveness of the therapy and the length of survival time of these transferred T cells.
We were not able to detect nanoparticles in our mouse skin graft models using the existing SQUID technology in our laboratory, since its sensitivity is limited by background environmental noise. The SQUID sensor system used here for the magnetic relaxometry measurements operates in an unshielded environment and has a noise floor of several pT/√Hz. Based on the performance of this early prototype SQUID system, the design of a new system with background rejection SQUID sensors and a method to eliminate the effects of the magnetizing pulse has been designed and will have a sensitivity of several orders of magnitude greater than the prototype.
Several lines of evidence suggest that the lack of detection at our current sensitivity level is due to the very low number of cells present in the mouse skin grafts, and larger number of cells would be present in larger human grafts. First, our skin graft is only 5 mm×5 mm×1 mm. We roughly estimate that a maximum number of 15,000 T cells would be present in each graft, which is below the level of detection of the present instrument but well above the anticipated sensitivity of an instrument with maximum sensitivity of less than 1,000 cells. This estimate was based on counting the labeled cells in 5-μm sections and multiplying by the graft size. Second, other groups, which have demonstrated imaging of transplant rejection using other imaging technologies, have used modified cells or larger animals and tissue transplants than our current model, suggesting that these additional methods are necessary to visualize transplant rejection. MRI and Cardiac Magnetic Resonance, which have demonstrated imaging of transplant rejection by direct injection of nanoparticles, were performed in larger animals, specifically rats (10, 11, 41, 51, 52). The use of larger animals would provide a larger graft and allow an increase in the dose of injected nanoparticles.
Adoptive cell transfer of macrophages and imaging by nanoparticles has been shown in rats (9) and in mice transplanted with rat xenografts (35). Adoptive cell transfer and imaging via nanoparticles has also been shown in mice via MRI; however, the cells were either specific tumor models with genetically specified T cells (19, 42) or with a large pancreatic graft (6). Positron emission tomography (PET) technology has also been able to successfully monitor adoptive immune cell transfer (48); however, this method involves the use of radiation that limits the utility of monitoring treatment overtime. Nonetheless, the small number of cases using mice or larger animals that have been successful have demonstrated the validity of the use of nanoparticles to image transplant rejection. We feel this is due to a larger graft size allowing for a larger number of infiltrating T cells. We calculate that a transplant model using a skin graft size of 10 mm×10 mm×1 mm would be needed for detection by SQUID technology. Unfortunately, the skin graft model is not conducive to MRI-based imaging due to the orientation of the graft and the presence of the air interface. Further studies using another model will be carried out to demonstrate the utility of the SQUID technology in detection of transplant rejection.
In the future, MRI- or SQUID-based detection could be used in combination with direct injection of magnetic nanoparticles or adoptive transfer of magnetically labeled cells (6, 20, 21, 34, 44). Since CD3 monoclonal antibodies have been used therapeutically to destroy T cells in vivo, but activate T cells under controlled in vitro experiments in which cross-linking can be induced, it is not clear if the use of CD3-coupled nanoparticles may have physiologic side effects. Having the capabilities to use either direct injection or adaptive transfer approach will be useful to address unknown side effects or as an intriguing area of biologic pursuit. The labeling and subsequent adoptive transfer of T cells has previously been shown to be detectable for almost 3 weeks, suggesting that the use of superparamagnetic nanoparticles may be a simple way to follow patient progress over the course of a few weeks (6). In the end, the ability to combine high-resolution anatomical images with molecular information from targeted contrast agents using a sensitive and specific modality will significantly aid in the detection of disease. In addition to previously mentioned benefits, the targeted labeling approach not only has the capacity to identify pathologic processes but also has been shown to deliver targeted drugs or therapies with fewer side effects (1, 7, 16, 24, 38, 39). Thus, the prospect of using targeted nanoparticle-based treatment for T-cell-mediated acute rejection and coupling treatment with periodic imaging modalities for monitoring of immunosuppressive therapeutics has great promise. Our nanoparticles would allow visualization of the transplanted cells by the detection of the iron oxide cores, but could also incorporate drugs to locally suppress the immune system or modulate the immune cells present at the transplant site. This study demonstrates the ability to target CD3-positive T cells to deliver nanoparticles to the site of rejecting tissue—the first step toward the development of a versatile contrast agent for use in imaging of transplant rejection.
The results reported here demonstrate that antibodytargeted magnetic nanoparticles can be delivered to transplanted tissue being rejected by the host. The next generation of SQUID sensors using magnetic relaxometry with optimal SQUID sensor technology will allow for repeated assessment of graft function in early posttransplant setting with a noninvasive technique with low patient complication rates—a scenario in which assessment is needed most and current approaches are invasive and come with risk. In addition, nanoparticles with CD4, CD8, or other T-cell makers could be developed for studying the magnitude and timing of specific T-cell subset infiltration. For short time periods, monitoring of the magnetic moment produced by the bound T cells can be done minute by minute following injection of the nanoparticles. For longer periods, reinjection of the antibody-labeled nanoparticles can be performed and comparisons made to determine the status of the transplant. A typical SQUID measurement requires less than 30 s.
Footnotes
Acknowledgments
This project was supported by NIH grant 5R44AI066765-03. Senior Scientific, LLC, acknowledges the support of the National Institutes of Health under Grant 2R44AI066765-02A2. Dr. Edward Flynn was the founder, CEO, and owner of Senior Scientific. Confocal images in this paper were generated in the University of New Mexico & Cancer Center Fluorescence Microscopy Shared Resource, funded as detailed on http://hsc.unm.edu/crtc/microscopy. TEM images were performed in the UNM Health Sciences Center Electron Microscopy Facility and the Biological Imaging Facility in the Department of Cell Biology and Physiology at the University of New Mexico. This work was performed, in part, at the Center for Integrated Nanotechnologies, a U.S. Department of Energy, Office of Basic Energy Sciences user facility. Sandia National Laboratories is a multi-program laboratory operated by Sandia Corporation, a wholly owned subsidiary of Lockheed Martin Company, for the U.S. Department of Energy's Nuclear Security Administration under contract DE-AC04-94AL85000. N.L.A. has equity interests in ABQMR and nanoMR; neither company sponsored this work.