
Abstract
Rejection is an important issue in kidney transplant. Although with adequate trough level of tacrolimus, acute rejection occurs, and we are focused on these cases. We hypothesized that the lower concentration of tacrolimus in the peripheral blood mononuclear cell would be a cause of rejection; in this regard, we describe ABCB1, which regulates intracellular concentration of tacrolimus. The effect of inflammation on the intracellular concentration of tacrolimus was evaluated, as was the association between that concentration and ABCB1 and CD44 activities. Seven kidney recipients experiencing acute rejection were prospectively enrolled. Both the whole blood concentration of tacrolimus and intracellular concentration of tacrolimus were measured at the time of enrollment and after stabilization. A human T lymphoblastoid cell line (Jurkat T cell) was treated with various concentrations of tacrolimus for 21 h and then stimulated for 3 h. The levels of mRNA interleukin-2, interleukin-8, and interferon-γ decreased dose dependently by tacrolimus. Furthermore, a fluorescence-activated cell sorter was used to count cells expressing CD44 and ABCB1; changes in intracellular concentration of tacrolimus were explored after tacrolimus treatment and stimulation. Also, B6 splenocytes were tested in the same manner as previous Jurkat T cell experiments. The tacrolimus ratio of three patients was lower at the time of acute rejection than when patients were stabilized. In vitro, the intracellular concentration of tacrolimus decreased after stimulation. Under the same conditions, CD44+ ABCB1+ cells increased in proportion on tacrolimus treatment and stimulation. This work supports the hypothesis that inflammation reduces the intracellular tacrolimus level, possibly via drug efflux mediated by CD44+ ABCB1+ and inflammation could lead to acute rejection.
Introduction
Tacrolimus is the mainstay of immunosuppressive regimens for kidney transplantation, 1 and it prevents T cell activation and proliferation by inhibiting calcineurin, which is responsible for the dephosphorylation of nuclear factor of activated T cells.2,3 Although tacrolimus reduces the acute rejection rate and improves short-term outcomes after kidney transplantation, it is associated with both acute and chronic nephrotoxicity 4 and triggers serious side-effects, including infection and malignancy.5,6 Rejection is the most significant complication after kidney transplantation. 1 Therefore, it is important to balance immunosuppression with minimization of the infection risk. An optimal tacrolimus level is traditionally maintained by monitoring the trough levels. 7 However, adequate trough levels do not guarantee that rejection or infection will be avoided. Therefore, there had been many previous studies about pharmacodynamics or pharmacokinetics to acquire therapeutic dosing of the tacrolimus. 8 Previously, we studied pharmacokinetic monitoring method, the concentration of intracellular tacrolimus is compared with the blood tacrolimus trough level. This study showed that concentrations of intracellular tacrolimus and tacrolimus trough level had linear correlation in patient with stable graft function. 9
Tacrolimus is a substrate of ABCB1, and ABCB1 is expressed in the liver, in pancreas, on enterocytes in the small intestine and colon, in the blood–brain barrier, in the human kidney, and also on B and T lymphocytes. ABCB1 acts as a transmembrane efflux pump which removes drugs from the cell membrane and cytoplasm. As a consequence, activity of ABCB1 influences the immunosuppressive effect of tacrolimus and its drug resistance.10,11 Current studies suggest that ABCB1expression was associated with inflammation.12,13 Inflammation is associated with graft loss or death. 14 Previous studies have demonstrated that inflammatory markers such as interleukin (IL)-2, IL-6, and tumor necrosis factor-α (TNF-α) are associated with episode of acute rejection.15,16 Other previous studies showed that co-existing inflammation and hypoxia interact to trigger drug resistance and rejection.17–19 These suggest a link between ABCB1 and inflammation in point of intracellular concentration of tacrolimus.
The CD44 is a cell-surface glycoprotein involved in cell–cell interactions, cell adhesion, and migration. CD44 is expressed on the majority of immune cells and is responsible for mediating adhesion to the extracellular matrix glycosaminoglycan, hyaluronan. Also, hyaluronic acid and the hyaluronic acid receptor CD44 control the expression and function of ABCB1.20–22 CD44-mediated drug resistance is via upregulation of ABCB1 and a mechanism separate from ABCB1. 23 The binding of CD44 to hyaluronic acid is induced on T lymphocytes after activation by antigen and on monocytes after stimulation by inflammatory agents. Under inflammatory conditions, CD44 is involved at many stages of the inflammatory response and its activity is upregulated. 24
Lower tacrolimus trough levels are associated with higher acute rejection risk. Contrary, in this study, we hypothesis that inflammatory condition such as acute rejection or infection could lower the concentration of tacrolimus in target T cell and evaluated the relationship between inflammation and the concentration of intracellular tacrolimus, especially those of target T cells.
Materials and methods
Study population and data collection
Kidney transplantation patients hospitalized with acute rejection between January 2015 and March 2016 were enrolled. The enrollment criteria were as follows: age ⩾ 18 years, taking tacrolimus as maintenance immunosuppressive therapy, and hospitalization with acute rejection. Patients who had undergone multiple organ transplantations, who were taking drugs that exhibited major interactions with tacrolimus, 25 or who were on drugs that affected ABCB1 function were excluded. To evaluate the effect of acute inflammation on the concentration of intracellular tacrolimus, samples and clinical information were prospectively collected twice: (1) at the time of hospitalization because of acute rejection and (2) on stabilization after treatment. Eleven patients were enrolled, but four dropped out because of withdrawal of consent (n = 2) and loss to follow-up (n = 2). Finally, seven patients were enrolled. All were informed about the purpose of the study and participated voluntarily after providing written consent. The study was approved by the Institutional Review Board of Seoul National University Hospital (no. H-1501-077-641). All samples were obtained with informed consent under Institutional Review Board–approved protocols.
Purification of peripheral blood mononuclear cells
Thirty to sixty minutes before the morning dose of tacrolimus, blood samples (5 mL) were drawn into heparinized tubes. Blood samples were diluted in phosphate-buffered saline (PBS) at 1:1 ratio, subjected to Ficoll gradient centrifugation at 400g for 40 min at 4°C, and use a clean pipette to carefully remove and discard the upper plasma layer without disturbing the peripheral blood mononuclear cell (PBMC)-containing plasma/Ficoll interface. Then, the PBMCs are transferred to a new, clean tube and washed twice in PBS at 4°C.15,26 A 10 µL of cell suspension were added to 10 μL of a trypan blue solution and gently mixed by pipetting; 10 μL of each mixture was then placed on a slide. An automated cell counter (Invitrogen, Carlsbad, CA, USA) was used to count viable PBMCs. The samples that have up to 90% live PBMCs were assigned to analysis of the concentration of intracellular tacrolimus. Isolated PBMCs were suspended in 1 mL PBS and stored at −80°C prior to sample preparation for liquid chromatography coupled with tandem mass spectrometry (LC/MS-MS).
In vitro cell preparation before an inflammatory environment
The study protocol was reviewed and approved by the Institutional Animal Care and Use Committee of the Seoul National University College of Medicine. Jurkat cells (clone E6-1 ATCC® TIB-152™; Sigma-Aldrich, St. Louis, MO, USA), an immortalized human T lymphocyte cell line, and B6 splenocytes were used. 27 Four 6- to 8-week male mice were housed in a standard environment with a room temperature of 22 ± 2°C. All mice were sacrificed under ketamine (100 mg/kg of body weight) and pentobarbital sodium (50 mg/kg of body weight Nembutal; Abbott, Wiesbaden, Germany) and cervical dislocation. Freshly removed mouse spleens were cut into small fragments, minced, sieved into centrifuge tubes through a 40-μm pore-sized nylon screen, and washed with 5 mL of Roswell Park Memorial Institute (RPMI) medium (Gibco, Carlsbad, CA, USA). The suspensions were centrifuged for 10 min at 1000 r/min, and the supernatants were discarded. The splenocyte pellets were re-suspended in red blood cell lysis buffer (Sigma-Aldrich) for 5 min at room temperature, washed with PBS, and used in subsequent experiments.
Jurkat and B6 mouse splenocytes (5 × 10⁵/well of a 96-well U-bottom plate) were maintained in RPMI 1640 medium with 10% fetal bovine serum (FBS), 10 mM 2-2 hydroxyethylpiperazine-N9-2-ethanesufonic acid, and 100 U/mL penicillin (Gibco).
Pretreatment of cells with tacrolimus, cell culture, and stimulation
Pure tacrolimus was dissolved in ethanol (Gibco) to 1 mg/mL and diluted in RPMI medium. Prior to tacrolimus pretreatment, cells (5 × 10⁵/well in 96-well plates) were washed twice with PBS and then incubated with various concentrations (0.0, 2.5, and 5.0 ng/mL) of tacrolimus at 37°C under 5% (v/v) CO2 for 21 h in RPMI medium with 1% (v/v) FBS. Cells were activated for 3 h at 37°C with 50 ng/mL phorbol myristate acetate (PMA) (Sigma-Aldrich) and 200 ng/mL ionomycin (Sigma-Aldrich), washed twice at 4°C, suspended in 1 mL of PBS, and stored at −80°C prior to the concentration of intracellular tacrolimus measurement.
Measurement of the concentration of intracellular tacrolimus
We previously developed a method of the concentration of intracellular tacrolimus measurement using LC/MS-MS. 9 The LC system (Shimadzu Corp., Tokyo, Japan) coupled with an AB SCIEX QTRAP® 5500 triple-quadrupole mass-spectrometric system (AB Sciex, Foster City, CA, USA). For LC/MS-MS sample preparation, 200 μL of suspended cells was mixed with 50 μL of an internal standard solution (50 ng/mL ascomycin (Sigma-Aldrich) in 50% methanol (Sigma-Aldrich)) and 1 mL of methyl tertiary butyl ether. After vortexing and centrifugation (14,000 r/min, 5 min, 4°C), the organic solvent layer was dried under nitrogen and dissolved in 75 μL 50% methanol/0.1% formic acid. After vortexing and centrifugation as above, 5 μL of the reconstituted sample was injected into the LC/MS-MS. The instrument was set to collect data in multiple-reaction monitoring mode using electrospray ionization positive mode. Tacrolimus was separated by Venusil XBP C18 (50 × 2.1 mm, 5 µm; Agela Technologies, Newark, NJ, USA) column. The mobile phase consisted of 2 mM ammonium acetate (A) and methanol (B). Flow rate was 0.2 mL/min, and 5 μL of treated sample was injected into the LC/MS-MS system. The standard curves for tacrolimus were linear over the range of 0.5–100 ng/mL. Tacrolimus concentration was linear and accurate in the range of analysis with coefficient of variation (CV) less than 6%. The concentration of intracellular tacrolimus was measured in cells held at 4°C to avoid tacrolimus efflux. The measurement of concentration of intracellular tacrolimus was confirmed by at least three independent experiments.
Definition of tacrolimus ratio
The prescribed dose of tacrolimus is different between kidney transplantation patients, and the whole blood tacrolimus trough level is affected by prescribed tacrolimus dose. Moreover, whole blood tacrolimus trough level might affect the concentration of intracellular tacrolimus. Therefore, we defined the tacrolimus ratio with reference to previous studies to correct different whole blood tacrolimus trough levels in each of these kidney transplantation patients. We defined tacrolimus ratio as the concentration of intracellular tacrolimus to the whole blood tacrolimus trough level.
The whole blood tacrolimus trough level was measured by the microparticle enzyme-linked immunosorbent assay (ELISA) test, based on the Abbott IMX® (Abbott Lab., Abbott Park, IL, USA) analyzer. 28
Measurement of proinflammatory cytokine levels
As described in the previous section, cells were cultured with tacrolimus for 21 h and stimulated for 3 h before harvest. After stimulation but before washing, total 24 h later, culture supernatants were harvested. The effects of tacrolimus were evaluated by measuring the levels of proinflammatory cytokines in the culture supernatants. The levels of mRNAs encoding IL-2, IL-8, and IFN-γ were measured by real-time polymerase chain reaction (real-time PCR; Applied Biosystems, Foster City, CA, USA). Total RNAs are extracted with an RNeasy mini kit (Qiagen, Hilden, Germany), and RNA was converted to cDNA using a kit according to the manufacturer’s instructions (cat. no. A3500; Promega Corporation, Madison, WI, USA). PCRs were carried out on an Applied Biosystem™ 7500 thermocycler (Applied Biosystems) using Assay-on-Demand TaqMan probes. Either the SYBR® Green method or custom-designed Assay-on Demand™ TaqMan® probes and primers (to amplify all other genes) was used. For SYBR® Green amplification, each reaction (20 μL) contained 1× SYBR® Green Master Mix (Applied Biosystems) and 0.2 μM of each of the forward and reverse primers (Table 1). The thermocycler conditions for both methods were as follows: 95°C for 10 min; followed by 40 cycles of dissociation (95°C for 10 s), annealing (55°C for 30 s), and elongation (72°C for 30 s). For relative quantification, the ΔΔCT method was employed; glyceraldehyde 3-phosphate dehydrogenase (GAPDH) served as the reference IL-2, IL-12, and IFN-γ, and TNF-α levels were measured using ELISA kits (R&D Systems, Minneapolis, MN, USA).
Primers used in SYBR Green quantitative real-time PCR.

PCR: polymerase chain reaction; IL: interleukin; IFN-γ: interferon-gamma; GAPDH: glyceraldehyde 3-phosphate dehydrogenase.
Measurement of proinflammatory cytokines was confirmed by at least three independent experiments.
Evaluation of CD44+ ABCB1+ cell proportion as determined by tacrolimus level under stimulation status
As described in the previous section, mouse splenocytes were incubated with tacrolimus for 21 h, and cells were activated for 3 h with 50 ng/mL PMA and ionomycin. For quantitative flow cytometry, mouse splenocytes were harvested, fixed in 2% paraformaldehyde, and washed with cold PBS. Cells were blocked with 2% bovine serum albumin in PBS for 30 min at room temperature and then incubated with anti–T cell receptor β (TCRβ) (BD Biosciences, San Jose, CA, USA), anti-ABCB1 (ThermoFisher, Waltham, MA, USA), and anti-CD44 (BD Biosciences) for 60 min at room temperature. After washing, cells were stained with PE-Cy5-TCRβ, PE-anti-CD44, and FITC-anti-ABCB1. Next, the cells were incubated with Dylight 488-conjugated goat anti-mouse IgG (H + L) secondary antibody for 40 min at room temperature in the dark for ABCB1 detection and re-suspended in PBS. Fluorescent signals were analyzed using the FACSCalibur™ instrument (BD Biosciences) and FlowJo software (version 10.0.7; FlowJo LLC, Ashland, OR, USA).
Statistical analysis
All data are presented as mean ± standard deviation (SD), or as frequencies (counts and percentages). Statistical analyses were performed with the aid of SPSS version 21.0 for Windows (SPSS Inc., Chicago, IL, USA) and GraphPad Prism® version 5.0 (GraphPad Software, San Diego, CA, USA). Statistical significance was set at P value < 0.05. In real-time PCR experiments, a two-tailed Student’s t-test was used to compare fold-changes.
Results
Baseline characteristics
Table 2 shows the clinical characteristics of all patients at the time of acute rejection (as proven by kidney biopsy and follow-up laboratory tests). Patients’ mean age was 34.7 ± 11.9 years, and 71.4% were men. The most common etiology of end-stage renal disease (ESRD) was IgA nephropathy, and among the seven patients, four patients had transplanted within 1 year. The mean estimated glomerular filtration rate (eGFR) was 34.1 ± 11.4 mL/min/1.73 m2.
Baseline characteristics of patients at the time of enrollment.
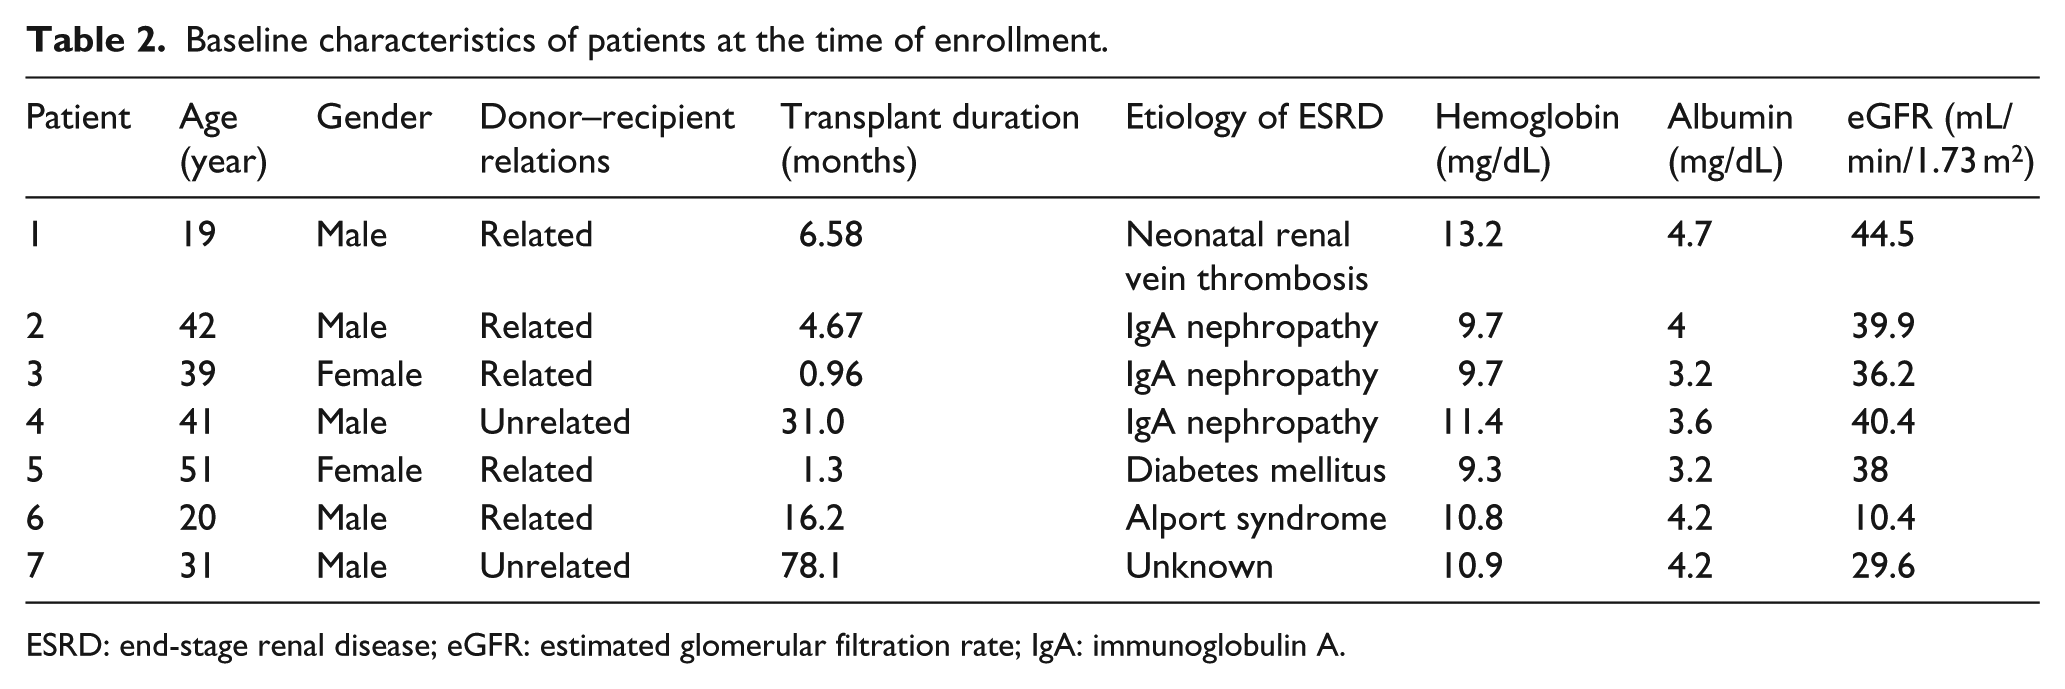
ESRD: end-stage renal disease; eGFR: estimated glomerular filtration rate; IgA: immunoglobulin A.
Differences in the tacrolimus ratios according to patient’s condition, acute rejection and stable status
Of the seven patients, the tacrolimus ratios of three patients increased after the acute rejection was treated (Table 3). All three patients were diagnosed with acute T-cell-mediated rejection by kidney biopsy. The other four patients were clinically diagnosed with acute rejection, while their kidney biopsy results only showed borderline changes, with the exception of Patient No. 5. Patient No. 5 was diagnosed with acute antibody-mediated rejection with borderline changes (suggestive of acute T-cell-mediated rejection).
Characteristics of patients with acute rejection and stable status.

eGFR: estimated glomerular filtration rate.
Change of the concentration of intracellular and media tacrolimus according to stimulation in Jurkat T cell
To investigate the change of intracellular and extracellular tacrolimus levels under inflammatory condition, we measured the concentration of intracellular tacrolimus and media tacrolimus levels after stimulation. The concentration of intracellular tacrolimus was measured at different concentrations of tacrolimus. In the Jurkat T cell line, the concentration of intracellular tacrolimus increased as the tacrolimus level rose (Figure 1) In addition, the concentration of intracellular tacrolimus decreased after stimulation (from 0.65 ± 0.02 to 0.39 ± 0.02 ng/mL after 5 ng/mL tacrolimus treatment; from 0.43 ± 0.09 to 0.19 ± 0.04 ng/mL after 2.5 ng/mL tacrolimus treatment; P < 0.05 for all) (Figure 2(a)). Figure 2(b) showed that changes in the concentrations of media tacrolimus after stimulation were opposite to those of the concentration of intracellular tacrolimus. After stimulation, the concentration of intracellular tacrolimus decreased (from 0.57 ± 0.09 to 0.26 ± 0.21 ng/mL after 5.0 ng/mL tacrolimus treatment), but media tacrolimus concentrations increased (from 1.13 ± 0.37 to 1.35 ± 0.44 ng/mL).

Concentration of intracellular tacrolimus according to media tacrolimus.

The changes in concentration of intracellular and media tacrolimus after stimulation. (a) Jurkat T cells were preincubated in the presence of tacrolimus for 21 h at 37°C. After phorbol myristate acetate (PMA) and ionomycin stimulation for 3 h, the concentration of intracellular tacrolimus was decreased. (b) A comparison between the concentration of intracellular and media tacrolimus according to stimulation. Contrary to intracellular tacrolimus, the concentration of media tacrolimus increased after stimulation.
To determine the effect of stimulation on the concentration of intracellular tacrolimus, real-time PCR was used to measure changes in the levels of mRNAs encoding cytokines after PMA/ionomycin stimulation. The levels of proinflammatory cytokines, including IFN-γ, IL-2, and IL-9, increased after stimulation (IL-2: 3.2-fold; IL-9: 4.23-fold; and IFN-γ: 2.67-fold). However, on culture in tacrolimus-containing medium, such post-stimulation upregulation was significantly suppressed (IL-2: 0.36-fold after treatment with 2.5 ng/mL tacrolimus and 0.58-fold after treatment with 5 ng/mL tacrolimus; the other mRNAs were suppressed to similar levels) (Figure 3).
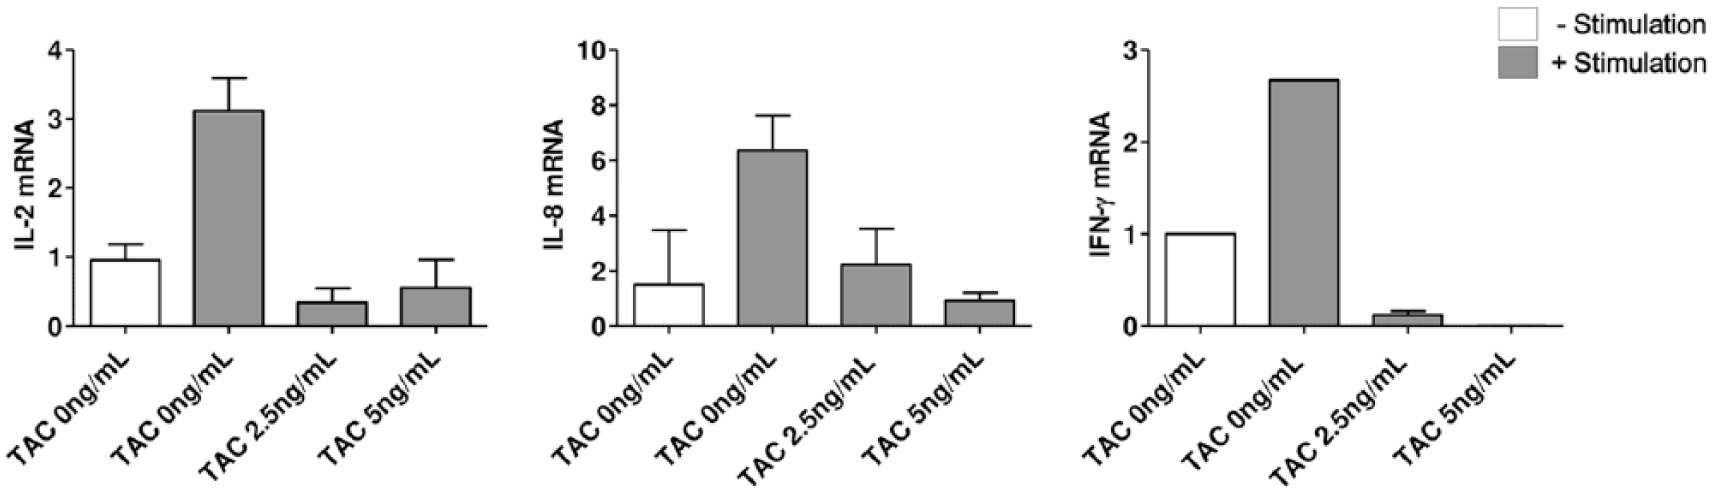
mRNA expression of IL-2, IL-8, and IFN-γ in Jurkat T cells after stimulation and tacrolimus treatment.
In summary, the concentration of intracellular tacrolimus decreased under inflammatory condition, and tacrolimus suppresses the production of proinflammatory cytokines.
Relationship between the concentration of intracellular tacrolimus and CD44+ ABCB1+ activity in ex vivo
To investigate the role of CD44+ ABCB1+ in inflammatory condition, we checked the proportion of CD44+ ABCB1+ cells and compared them according to the concentration of intracellular tacrolimus.
The changes of the cytokine levels and the stimulation status of B6 mouse splenocytes in response to tacrolimus treatment were measured by ELISA. The levels of IL-2, IL-12, IFN-γ, and TNF-α increased after stimulation (from 23.33 ± 1.53 to 23,988.00 ± 34.18 pg/mL for IL-2; from 2.33 ± 1.15 to 45.33 ± 2.52 pg/mL for IL-12; from 9.00 ± 1.00 to 12,987.00 ± 881.21 pg/mL for IFN-γ; and from 4.00 ± 1.00 to 191.33 ± 7.50 pg/mL for TNF-α); however, these increases were suppressed by tacrolimus (IL-2: 23,988.00 ± 34.18 to 131.67 ± 8.02 pg/mL after 2.5 ng/mL tacrolimus treatment and to 108.33 ± 14.84 pg/mL after 5.0 ng/mL tacrolimus treatment; the levels of the other proinflammatory cytokines were suppressed to similar levels) (Figure 4(a)). We hypothesized that the concentration of intracellular tacrolimus might be affected by ABCB1, in turn controlled by CD44, after stimulation. Therefore, fluorescence gating of TCRβ was usedto explore changes in cell proportions after stimulation. The proportion of CD44+ ABCB1+cells increased after stimulation from 0.76% ± 0.04% to 3.42% ± 0.24% (Figure 4(b)). However, these proportions were suppressed by tacrolimus (0.74% ± 0.08% after 2.5 ng/mL tacrolimus treatment; 0.44% ± 0.06% after 5.0 ng/mL tacrolimus treatment). These changes of CD44+ ABCB1+ under inflammatory condition and tacrolimus are shown graphically (Figure 4(c)).

The response of mouse splenocytes to the stimulation: (a) B6 mouse splenocytes were harvested, and enzyme-linked immunosorbent assay (ELISA) were used to measure the cytokine levels. Concentrations of the IL-2, IL-12, IFN-γ, and TNF-α in the mouse splenocytes were increased after stimulation and suppressed by treatment of tacrolimus; (b) fluorescence T cell receptor β (TCRβ), ABCB1, and CD44 gating strategies were used to explore changes in cell proportions after stimulation. The proportion of CD44+ ABCB1+ cells increased after stimulation, and (c) bar graph showing the result of the flow cytometric analyses. The proportion of CD44+ ABCB1+ cells increased after stimulation from 0.76% ± 0.04% to 3.42% ± 0.24%. However, such proliferation was suppressed by tacrolimus. The results were obtained from three independent experiments (n = 3/group, *P < 0.05, and ***P < 0.001).
Discussion
Recurrent rejection episodes and certain infections have been associated with acute rejection. Also, low trough level of tacrolimus is known as a risk factor of acute rejection. We hypothesis that inflammatory condition could decrease the intracellular tacrolimus level of target T cell, and this could lead to acute rejection. We evaluated the change of the blood tacrolimus concentration and intracellular tacrolimus concentration at the time of acute rejection and stable status in the kidney transplant recipients. Furthermore, we investigate the effect of the inflammation on the concentration of intracellular tacrolimus, and this was related to CD44+ ABCB1+ cell activities in Jurkat T cell and B6 splenocytes.
First, patient tacrolimus ratios were lower during acute rejection than when patients were stabilized, but only in those experiencing acute T-cell-mediated rejection (Table 3). In other words, unlike other antibody-mediated rejection, T-cell-mediated rejection results in decreased concentration of intracellular tacrolimus. This corresponds to the concept that the drug concentration in the T cell, the target of tacrolimus, can be decreased by inflammation. The initial focus was on changes in the concentration of intracellular tacrolimus by the rejection status of kidney transplant recipients, and experiments were performed to support the conclusions summarized above. Second, the concentration of intracellular tacrolimus was decreased by PMA/ionomycin stimulation. Third, the changes in the concentration of intracellular tacrolimus on stimulation were opposite to media tacrolimus levels: after stimulation, the concentration of intracellular tacrolimus fell and media tacrolimus levels rose. Fourth, the proportion of CD44+ ABCB1+ cells increased on tacrolimus treatment and stimulation.
Previous studies suggested that low tacrolimus trough concentrations correlated closely with acute rejection.29–32 However, some studies found no such correlations. 33 In addition, adequate tacrolimus trough levels do not always guarantee graft stability. It is unclear why acute rejection develops when the tacrolimus trough levels are adequate. Therefore, we evaluated the concentration of tacrolimus in T cell, the target cell of tacrolimus.
ABCB1 overexpression is a critical form of drug resistance in cancer patients.34,35 One study suggested that a close interaction between CD44 and P-glycoprotein (P-gp) modulated both cancer cell invasion and multidrug resistance. 36 Tacrolimus is transported by P-gp, which reduces tacrolimus levels within cells. 37 P-gp is encoded by the ABCB1 gene, 38 the expression and function of which are in turn controlled by hyaluronic acid and the hyaluronic acid receptor CD44.20–22 In this study, the proportion of CD44+ ABCB1+ cells increased after inflammatory stimulation (Figure 4(b) and (c)), but the concentration of intracellular tacrolimus decreased (Figure 2). This shows that inflammatory stimulation affected intracellular drug concentrations, might be associated with the actions of CD44 and ABCB1. Although adequate tacrolimus trough levels were achieved, target cell tacrolimus levels could be reduced under severe, recurrent inflammatory conditions because of CD44 and ABCB1 activation.
Does inflammation or infection trigger organ transplant rejection? This question has yet to be answered. However, there is clear evidence that bacteria-induced inflammation activates graft-reactive T cells; therefore, it is possible that concurrent bacterial infection may also induce organ injury and the release of endogenous activators, further enhancing inflammation and provoking graft rejection. 39 Several studies have shown that cytomegalovirus infection triggers acute and chronic allograft rejection.40,41 However, the mechanisms by which concurrent infection increases solid organ transplant rejection are very complex and remain poorly understood. We suggest that inflammation may indeed trigger organ transplant rejection via a mechanism involving CD44 and ABCB1.
Of the seven patients, the tacrolimus ratios of only three patients were lower under inflammatory compared with stable conditions. Interestingly, biopsies revealed that all three had suffered from acute T-cell-mediated rejection of type IA. The biopsies of the other four patients revealed borderline changes. Not all tacrolimus ratios fell as inflammation developed. This may be explained by the following. First, the patient number was small. Second, many factors affect rejection and tacrolimus concentrations. Patient diet, patient environment, and drugs taken could not be controlled. Third, the severity of acute rejection varied among the patients. Nevertheless, this study shows that the concentration of intracellular tacrolimus corrected for tacrolimus trough level (tacrolimus ratio) is lower in acute T-cell-mediated rejection, but not in antibody-mediated rejection. This might be more suitable for our hypothesis that we focused on the change of tacrolimus level in target T cell by inflammation.
This study had certain limitations. First, the mechanism by which ABCB1 is controlled by CD44 remains unclear. Second, neither mouse splenocytes nor Jurkat cells are T cells from kidney recipients. Third, the patient number was small and the patient environment was not controlled. Further studies are needed to explore the relationship between inflammation and rejection. In addition, more experiments are needed to examine various stimulatory conditions, including severe, recurrent, and chronic inflammation. A larger prospective clinical research study is warranted to clarify the relationship between rejection and the concentration of tacrolimus in target cells.
In conclusion, inflammation may cause rejection by affecting drug resistance. After inflammatory stimulation, the concentration of intracellular tacrolimus decreased and CD44+ ABCB1+ activities increased. This suggests that prevention of inflammation is important, and is essential to retain stable graft function and minimize rejection. Also, we concluded that CD44+ ABCB1+ is a negative regulator of the concentration of intracellular tacrolimus in inflammatory condition and inhibition of CD44+ ABCB1+ may protect against T-cell-mediated rejection.
Footnotes
Acknowledgements
All authors contributed to the conceptualization and design of the study and the acquisition, analysis, and interpretation of data. All authors approved the final manuscript.
Declaration of conflicting interests
The author(s) declared no potential conflicts of interest with respect to the research, authorship, and/or publication of this article.
Funding
The author(s) disclosed receipt of the following financial support for the research, authorship, and/or publication of this article: This work was supported by the Korea Healthcare Technology R&D Project, Ministry of Health and Welfare, Republic of Korea (grant no. HI11C0631).