
Abstract
We previously described the effectiveness of autologous bone marrow cell infusion (ABMi) therapy for patients with liver cirrhosis (LC). We analyzed chronological changes in 19 serum cytokines as well as levels of specific cytokines in patients after ABMi therapy and in a mouse model of cirrhosis generated using green fluorescent protein (GFP)/carbon tetrachloride (CCl4). We measured expression profiles of cytokines in serum samples collected from 13 patients before and at 1 day and 1 week after ABMi. Child–Pugh scores significantly improved in all of these patients. To analyze the meaning of early cytokine change, we infused GFP-positive bone marrow cells (BMCs) into mice with CCl4-induced LC and obtained serum and tissue samples at 1 day and as well as at 1, 2, 3, and 4 weeks later. We compared chronological changes in serum cytokine expression in humans and in the model mice at 1 day and 1 week after BMC infusion. Among 19 cytokine, both granulocyte colony-stimulating factor (G-CSF) and interleukin-1β (IL-1β) in serum was found to show the same chronological change pattern between human and mice model. Next, we examined changes in cytokine expression in cirrhosis liver before and at 1, 2, 3, and 4 weeks after BMC infusion. Both G-CSF and IL-1β were undetectable in the liver tissues before and at 1 week after BMC infusion but increased at 2 weeks and continued until 4 weeks after infusion. The infused BMCs induced an early decrease of both G-CSF and IL-1β in serum and an increase in the model mice with LC. These dynamic cytokine changes might be important to repair liver cirrhosis after BMC infusion.
Introduction
Liver transplantation is presently the only radical therapy for liver failure, but the scarcity of donors and highly invasive surgery remain formidable obstacles. Cells in the bone marrow might differentiate into hepatocytes was reported (1,23,24). This suggested that bone marrow could serve as a new source of cells to regenerate the liver of patients with liver cirrhosis (LC) (22). To develop autologous bone marrow cell (BMC) infusion (ABMi) therapy, we analyzed the effects of green fluorescent protein (GFP)-positive BMC infusions into carbon tetrachloride (CCl4)-induced cirrhosis mouse model (GFP/CCl4 model) (20,21). From this GFP/CCl4 model, we found that liver function, fibrosis, and survival rates were improved by BMC infusion (15,18–21). From these basic studies of the GFP/CCl4 model, we therefore developed ABMi therapy and have clinically applied it to treat LC since 2003. We reported that liver function obviously improved in nine patients in terms of total protein, serum albumin, and Child–Pugh scores after 6 months of long-term follow-up (18). Furthermore, long-term follow-up clarified the value of ABMi (22). Since then, clinical studies have verified our findings regarding the effectiveness of ABMi therapy (18), and others have also reported that ABMi therapy is effective against liver cirrhosis in patients (8,14,17). Recently, the effectiveness of autologous bone mesenchymal stem cell transplantation into liver failure patient was also reported (13).
Several recent reports have described the therapeutic effects of BMC transplantation upon nonneoplastic conditions such as autoimmune diseases, ischemic heart disease, and heart failure (4,5), and that cytokines might be involved in tissue repair and cell differentiation. However we previously analyzed a molecular analysis for GFP/CCl4 model using DNA chips to identify molecules and factors involved in local liver regeneration after bone marrow cell infusion (12), but the expression profiles of cytokines in serum have not been confirmed. The present study examines changes in the early expression profiles of serum cytokines that have so far been impossible to determine in human and mice model. We investigated chronological changes in serum cytokines that are associated with the ability of infused BMCs to repair the liver of patients with LC. Serum cytokines were comprehensively measured, and chronological changes in their expression were compared between serum samples from patients and from the mouse GFP/CCl4 model mice to determine the kinetics of those involved in liver repair induced by BMCs. We calculated logarithms and corrected individual differences for comparisons to define only the degree of chronological change at each time phase for individual cytokines.
Thus, instead of differences among simple measurements, we determined chronological changes in cytokine kinetics and investigated differences to identify target cytokines. We extracted target serum markers by comparing degrees of chronological change in several cytokines in multiple dimensions after BMC infusion. We then analyzed candidate cytokines that were important for repairing the cirrhotic liver after BMC infusion.
Materials and Methods
ABMi Therapy Protocol
Eligible patients were aged between 18 and 75 years and clinically diagnosed with LC. We enrolled those with LC with total bilirubin (T. Bil) < 3.0 mg/dl, platelets (Plt) < 5 (1010/L), and no visible hepatocellular carcinoma on computed tomography (CT) or magnetic resonance images. Patients were excluded if their conditions also involved organs other than the liver, such as the heart or lungs. Data are from patients who were followed up for 6 months. The protocol was the same as that in our previous study (17). To date, 19 patients have undergone ABMi for LC, and no major adverse effects have been identified in Yamaguchi University. Among 19 patients, we could analyze serum cytokine for 13 patients (Table 1) of whom we were able to follow their progress with sufficient samples. All protocols were approved by the ethics committee of Yamaguchi University, and written informed consent was obtained from all patients to participate in the study.
Patients' Characteristics

M, male; F, female; HBV, hepatitis B virus; HCV, hepatitis C virus.
Statistical Analysis
The changes in laboratory data (Child–Pugh score) from baseline (before BMC infusion) to 1 or 6 months after the BMC infusion were analyzed. Values are shown as means ± SE. Data were analyzed using an analysis of variance with Fisher's projected least significant difference test.
GFP/CCl4 Model
C57BL6/Tg14 (act-enhanced GFP) OsbY01 mice (GFP-Tg mice) expressing GFP in various tissues and cells were provided by Masaru Okabe (Genome Research Center, Osaka University, Osaka, Japan) (11). Six-week-old female C57BL/6 mice (Japan SLC, Shizuoka, Japan) were intraperitoneally injected with 0.5 ml CCl4/kg body weight twice each week for 4 weeks to induce persistent LC. Immediately after 4 weeks of CCl4 administration, 1 × 10⁵ GFP-positive BMCs were injected into the tail vein (15,21). The BMCs were obtained from GFP-Tg mice as follows. The limbs were removed from sacrificed GFP-positive mice, and then BMCs were flushed from the medullary cavities of the tibias and femurs using a 25-gauge needle containing PBS culture medium. The GFP-positive bone marrow cells were previously shown to express one or more of CD11b, CD44, and CD90 (6,15). The same dose of CCl4 was injected twice each week after BMC infusion. Individual mice were killed at 24 h after the initial CCl4 injection and once each week after the BMC infusion for 4 weeks. All procedures including surgical steps proceeded in accordance with the guidelines for experiments involving animals and recombinant DNA at Yamaguchi University.
Expression Profiles of Cytokines Determined Using Bio-Plex Suspension Arrays (Human and Mouse Sera)
Human study: We obtained serum from 13 patients with LC before and at 1 day and 1 week after starting ABMi therapy. Model mouse study: Mice were continuously injected with CCl4 after the BMC infusion. We then measured concentrations of interleukin (IL)-1β, IL-2, IL-4, IL-5, IL-6, IL-10, IL-12(p70), IL-13, IL-17, granulocyte colony-stimulating factor (G-CSF), granulocyte macrophage colony-stimulating factor (GM-CSF), fibroblast growth factor (FGF)-basic, interferon-γ (IFN-γ), monocyte chemoattractant protein (MCP)-1, macrophage inflammatory protein (MIP)-1α, MIP-1β, regulated upon activation T-cell expressed and secreted (RANTES), tumor necrosis factor a (TNF-α), and vascular endothelial growth factor (VEGF) in duplicate in at least 11 samples of mouse serum collected at 1 day and 1 week after BMC infusion. Concentrations of all tested cytokines were simultaneously evaluated using multiplex bead-based sandwich immunoassay kits (mouse and human 19-plex; Bio-Rad Laboratories, Tokyo, Japan) according to the manufacturer's instructions. In brief, 19 distinct sets of fluorescently labeled beads were loaded with capture monoclonal antibodies specific to each tested cytokine. Samples or standards (both 50 μl/well) were incubated with 50 μl of premixed bead sets in wet 96-well microtiter plates. The plates were washed, 25 μl of fluorescent detection antibody mixture was added for 30 min, the plates were washed again, and the samples were resuspended in assay buffer (Bio-Rad Laboratories, Tokyo, Japan). Standard curves for each soluble factor ranged from 0.2 to 3,200 pg/ml. The formation of different sandwich immunocomplexes on distinct bead sets was quantified using the Bio-Plex Suspension Array System (Bio-Rad Laboratories, Tokyo, Japan). Fluorescent signals from ≥100 beads per region (chemokine/cytokine) in 50-μl samples from each well were evaluated. Values with a coefficient of variation (CV) of >10% were discarded before the final data analysis.
Cytokine Data Analysis
Cytokine data from human ABMi samples (13 cases) and mouse samples for each time point (n = 11 per time point) were analyzed using Bio-Plex Manager software version 3.0 (Bio-Rad Laboratories).
Analysis of Chronological Changes in Serum Cytokines From Humans After ABMi and From Model Mice
The concentrations of 19 cytokines at each time point were measured in all human and mouse serum samples using the Bio-Plex suspension array system.
Serum was separated from blood samples collected from patients before and at 1 day, 1 week, and 1 month after ABMi. Serum and liver tissue samples were collected from model mice before isogenic GFP-positive BMC infusion and during the early phase (1 day and 1 week after infusion). The degree of chronological changes in the cytokines before and after BMC infusion was determined in all serum samples.
The results from each cytokine generated from serum samples of the 13 treated patients were analyzed as follows based on the assumption of normal distribution. Firstly, cytokine values considered as outliers were removed based on mean and standard deviation information. Secondly, we used the logarithm function representing the degree of change in each cytokine between two consecutive time points such as from before to 1 day or from 1 day to 1 week after ABMi therapy to determine degrees of chronological changes (12). The value of the logarithm function indicates the degree of chronological changes in one cytokine, which becomes the axis value of the corresponding cytokine. Finally, we found cytokines with similar chronological changes between the two models and/or larger chronological changes. Means (μ) and standard deviation (SD) were calculated, and values outside μ (means) ± 2SD were excluded. The means for each of the 19 cytokines before and 1 day and 1 week after ABMi therapy are defined as x1, x2, and x3, respectively, in each of the 13 serum samples collected from patients.
Using the same method for the model mouse samples (n = 11 per time point), x is defined as the average value for each of the 19 cytokines at each time point for the group infused with BMC, and x1, x2, and x3 are defined as before and 1 day and 1 week after BMC infusion, respectively.
The degrees of chronological changes in each cytokine from before to 1 day after (f1) and from 1 day after to 1 week after BMC infusion (f2) were calculated as follows:

When xi+1 = x i , the value of f becomes 0. That is, the value of f represents the degree of chronological change of a cytokine. Visualization by vector representation allows effective focus on the degree of change in cytokines between two consecutive time points.
Vector (F j ) comprising f1 and f2 was defined as follows to represent chronological changes in cytokine j:

The degree of chronological changes in cytokines for the BMC infusion group is displayed in a two-dimensional plane. In general, as the norm of the above vector F j increases, the degree of chronological changes in cytokines also increases. Moreover, the distance between cytokines with similar chronological changes in the two-dimensional plane is less than that between cytokines with different chronological changes. Therefore, we examined cytokines with similar chronological changes and extracted those with similar changes between patients and model mice. F(h) j and F(m) j (where j = 1, …, 19) respectively indicate vectors for a chronological change in cytokine j in the patients and in the mouse model.
The time courses of chronological changes in 19 cytokines for the patients who received ABMi and for the model mice infused with BMCs were analyzed, and correlations were further investigated (Fig. 1A).
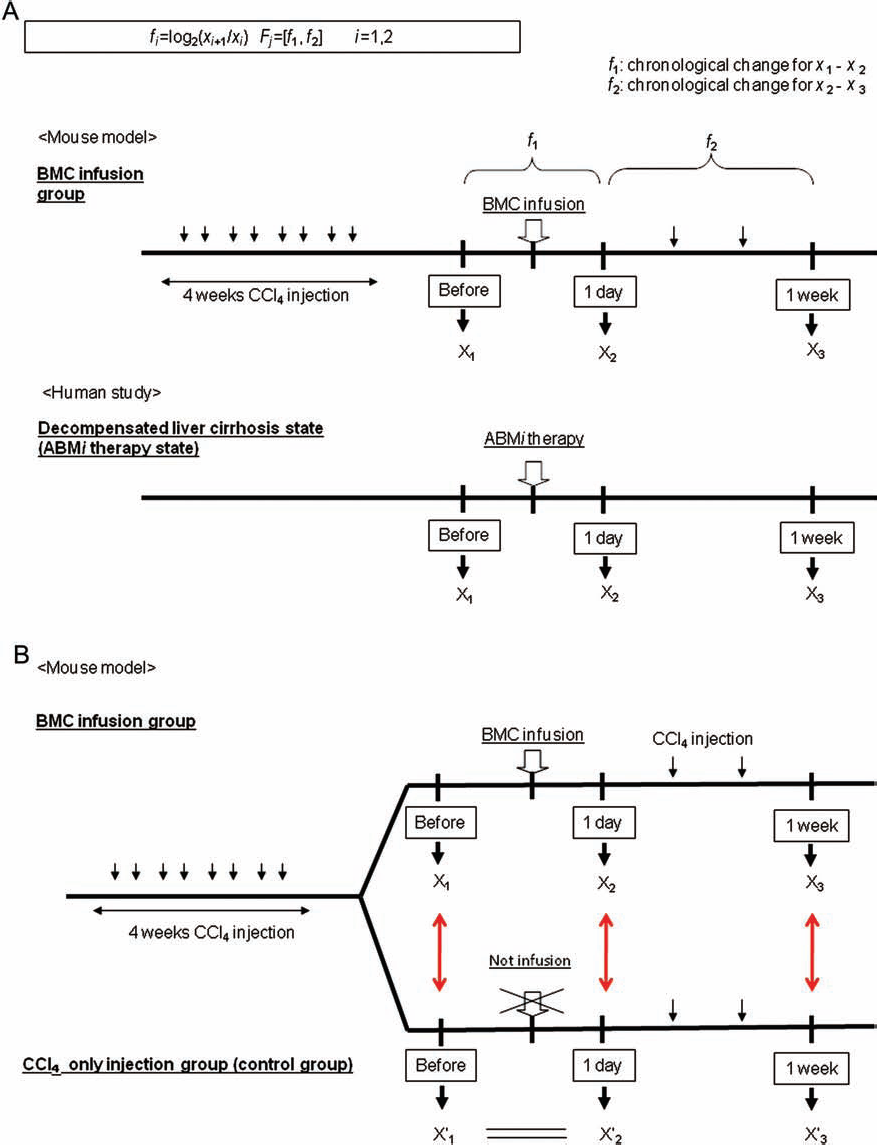
Definition of cytokine measurement points in patients and in model mice. (A) Chronological changes in each cytokine from before to 1 week after (f1) and from 1 day to 1 week after (f2) bone marrow cell (BMC) infusion were calculated as f i = log2(xi+1/x i ), i: 1,2, and base of logarithm: 2. Vectors comprising f1 and f2(F) are defined as F j = [f1, f2] to investigate chronological changes in each cytokine. ABMi, autologous bone marrow cell infusion; CCl4, carbon tetrachloride. (B) Comparison between the control group (CCl4) and BMC infusion group. Model mice received (CCl4) for 4 weeks and were then randomly assigned to either a group that continued to receive only CCl4 twice weekly (control) or another that was infused with BMCs as green fluorescent protein (GFP)/CCl4. We defined X1 as the time point before the BMC infusion and X'1 as the same time in control group before the BMC infusion on (B), each time point in each group was defined as X2: 1 day after BMCs and X'2: same time as X2 in the control group. Similarly, X3: 1 day after BMCs and X'3: same time as X3 in control group.
Comparison of Cytokines in Control Model Mice (Injected Only with CCl4) and Those Infused with BMCs
We examined cytokines with synchronized chronological changes in the ABMi model and CCl4 control model. Serum cytokines were compared at the same time points in the mice that were infused with BMCs and those that received only CCl4 to determine whether levels changed with the BMC infusion.
The mice that received CCl4 for 4 weeks were randomly divided into two groups (Fig. 1B). One group was infused with BMCs (GFP/CCl4 model), and the other continued to receive CCl4 twice weekly without BMC infusion (control). We defined X1 as the time point before the BMC infusion and X'1 as the same time in control group before the BMC infusion on Figure 1B. We defined X2 as the time point at 1 day after BMC infusion and X2 as the same time as X2 in the control group. We examined chronological changes in the patients and in two models of mice until 1 week after BMC infusion. Thus, X3 and X3 were defined as the time points at 1 week after BMC infusion and as the same time point as X3 in the control group, respectively (n ≥ 10 per group). We simultaneously compared serum concentrations of cytokines extracted from each group and X' with X, and X and X'3 using a t test.
Imunohistochemical Staining of Model Mouse Liver Tissue
We investigated G-CSF and IL-1β expression in 4-μm sections of paraffin-embedded blocks of mouse liver samples by immunohistochemical staining using the standard avidin–biotin–peroxidase complex (ABC) method. Sections were dewaxed in xylene, dehydrated in a graded alcohol series, and heated in a microwave oven for 6 min to activate antigens. Endogenous peroxidase activity was blocked by immersing the sections for 30 min in 0.3% hydrogen peroxidase in methanol. The sections were washed with distilled water, incubated in PBS containing rabbit serum for 20 min to block nonspecific antibody binding, and then incubated with goat anti-mouse G-CSF (diluted 1:300; Santa Cruz Biotechnology) and goat anti-mouse IL-1β (diluted 1:300; Santa Cruz Biotechnology) antibodies overnight at 4°C. The sections were incubated with biotin-conjugated secondary antibody in PBS for 60 min at room temperature and reacted with ABC for 30 min. Positive reactions were developed for about 3 min in PBS containing hydrogen peroxidase and 3,3′-diaminobenzidine (DAB). We captured five areas (200x) and calculated G-CSF and IL-1β-positive expression rates at each time point (before and 1–4 weeks after the BMC infusion). Values are shown as mean ± SD. Data were analyzed with the ANOVA with PLSD test. A value of p < 0.05 was considered statistically significant.
Results
ABMi Therapy Improved Liver Function in 13 Patients
Therapy with ABMi continued, and the present study examined for total of 13 patients (Table 1). Child–Pugh scores (Fig. 2) showed that liver function improved after ABMi therapy (p < 0.05).

Evaluation of liver function in 13 patients after autologous bone marrow cell infusion (ABMi). Child–Pugh scores indicate significantly improved liver function at 1 and 6 months after ABMi compared with before (∗p < 0.05).
Changes in Serum Cytokines in Patients After ABMi
Figure 3A plots the chronological changes in each cytokine from the patients on a two-dimensional plane. The x component of a vector from the origin to a plotted point (f1) indicates chronological changes from before to 1 day after BMC infusion, and the y component (f2) indicates chronological changes from 1 day to 1 week after infusion. The quadrant of each vector and the magnitude (distance) of each vector [√(|f1|2+|f2|2)] are presented. A larger distance between vectors means a greater difference in the degree of change over time for the patients. Table 2 shows that, among the 19 human cytokines, the distance between time points was the greatest for G-CSF > IL-6 > IL-1β (3.3119, 2.2181, and 1.2531, respectively), confirming differences in degrees of chronological change. Human G-CSF (F j ), IL-6, and IL-1β were located in quadrants 2, 4, and 2, respectively.
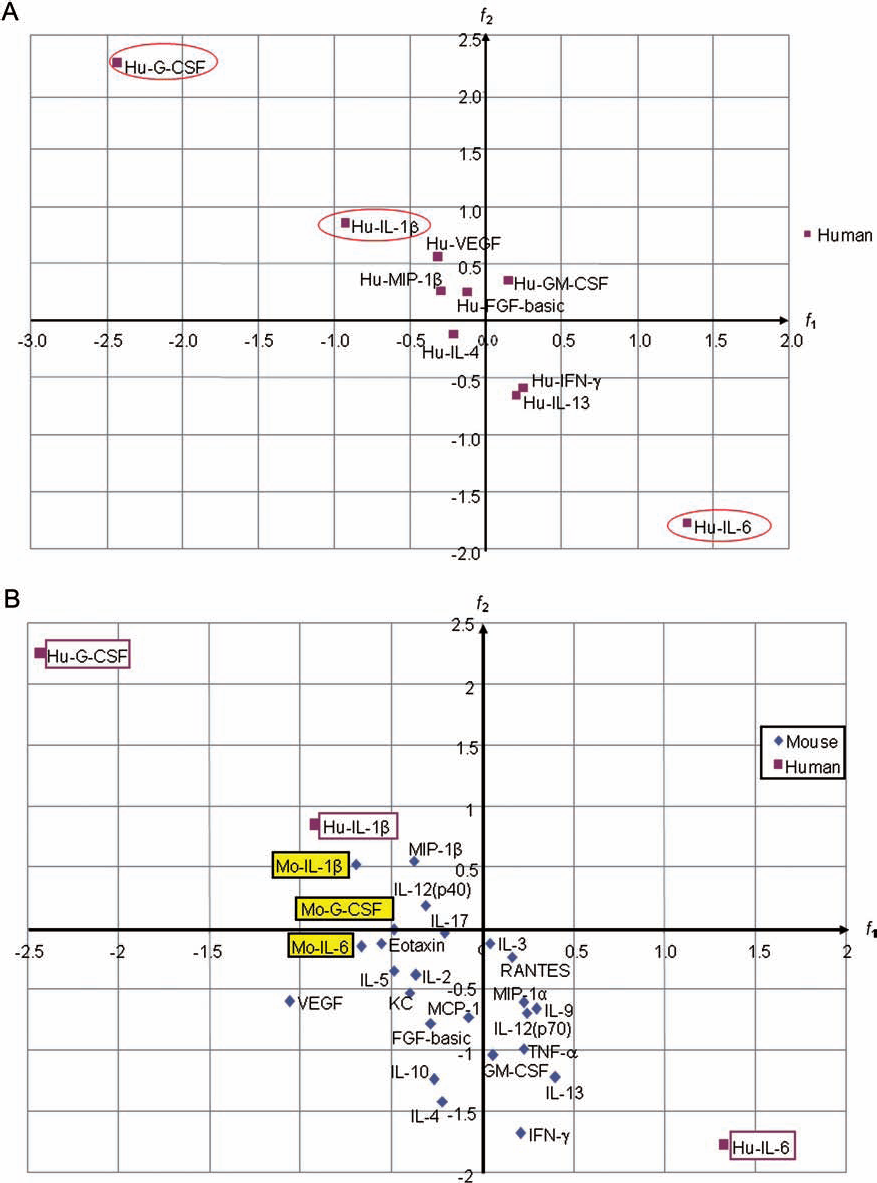
(A) Two-dimensional vector representation of chronological changes in human cytokines. Degrees of chronological changes in human cytokines are plotted on two-dimensional plane. Degree of chronological change from before to 1 day after BMC infusion is indicated as x component of vector from origin to a plotted point (f1); that from 1 day to 1 week after infusion is indicated as y component (f2). Quadrant and magnitude (distance) of each vector [√(|f1|2+|f2|2)] are shown. (B) Comparison of chronological changes in human and mouse G-CSF, IL-1β, and IL-6. Infusion with BMCs exerted significantly different chronological changes in human G-CSF, IL-1β, and IL-6 expression. These fluctuations are compared with those in mice by two-dimensional vector representation. Yellow and white boxes, mouse (M) and human (H) values, respectively. G-CSF, granulocyte colony-stimulating factor; IL, interleukin.
Specific Cytokines in Patients After ABMi

G-CSF, granulocyte colony-stimulating factor; IL, interleukin; MIP, macrophage inflammatory protein; IFN, interferon; VEGF, vascular endothelial growth factor; GM-CSF, granulocyte macrophage colony-stimulating factor; RANTES, regulated upon activation, T-cell expressed and secreted; FGF, fibroblast growth factor; TNF, tumor necrosis factor; MCP, monocyte chemotactic protein.
Comparison Between Patients and Model Mice
We plotted f1 on the x-axis and f2 on the y-axis and indicated chronological changes in cytokine levels in patient and model mouse sera as vectors on the x–y plane, as shown in Figure 3B. Cytokines with large differences in degrees of chronological change at each time point were examined and those with similar chronological changes between the patients and mice were identified.
Vectors were also calculated for the GFP/CCl4 model mice, and Table 3 shows the results along with data from the patients, which allows straightforward comparisons of changes in each cytokine between the two. Thus, we could identify important factors involved in liver regeneration after BMC infusion.
Similarity of Specific Cytokines in Patients and GFP/CCl4 Model Mice
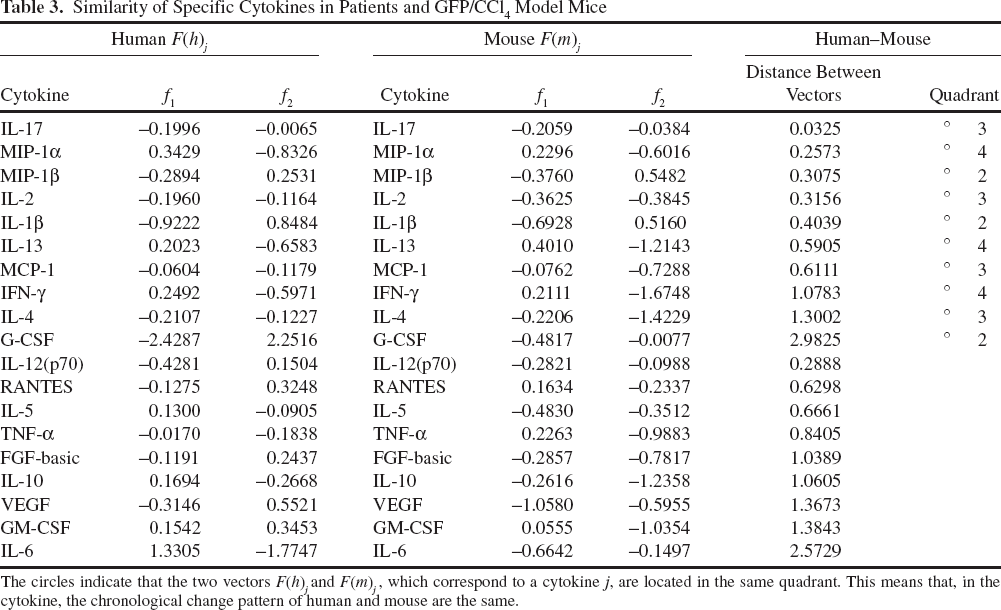
The circles indicate that the two vectors F(h) j and F(m) j , which correspond to a cytokine j, are located in the same quadrant. This means that, in the cytokine, the chronological change pattern of human and mouse are the same.
Cytokines between two models with similar chronological changes were plotted on a two-dimensional plane to calculate the magnitude of vectors for each cytokine in each model. If vectors for both models were found in the same quadrant, then we assumed identical kinetic chronological changes for that cytokine.
Analysis of G-CSF, IL-1β, and IL-6
Chronological changes in human G-CSF, IL-1β, and IL-6 expression significantly differed after BMC infusion, so we investigated their time course in the model mice.
Model mouse IL-1β lay in quadrant 2, and G-CSF lay on the x-axis at the borderline between quadrants 2 and 3. The two human cytokines also plotted in quadrant 2, thus suggesting that chronological changes after BMC infusion were the same in humans and mice. However, human and mouse IL-6 lay in quadrants 4 and 3, respectively. Thus, the profiles of chronological changes in human and mouse G-CSF and IL-1β were identical, whereas those of IL-6 were not.
Both human and model mouse G-CSF and IL-1β lay in quadrant 2, where the vectors indicated a “decrease” in f1 and an “increase” in f2. The two-dimensional vector for G-CSF was primarily located on the x-axis, thus clarifying that the chronological change from before to 1 day after BMC infusion was negative and that the degree of change tended to decrease. The chronological change was small from 1 day to 1 week after infusion. Levels of human and mouse IL-1β decreased from before to 1 day after but increased from 1 day to 1 week after BMC infusion (Fig. 3B). Thus, the comparable chronological changes in serum G-CSF and IL-1β in humans and mice suggested a high degree of similarity between the two models.
Comparison of G-CSF and IL-1β between Model Mice Injected with CCl4 (Control) and Those Injected with CCl4 and Infused with BMC
Both G-CSF and IL-1β chronologically changed in a synchronized fashion in the GFP/CCl4 mouse model and in the patients after ABMi. We compared the concentration of each cytokine in the control mice and the BMC-infused mice at the same time point (1 day and 1 week after BMC infusion) to determine whether the BMC infusion altered cytokine concentrations. In addition, we performed the t test on two groups, control group (X'1) and the group before the BMC infusion (X1) on Figure 1B, and we confirmed that there is no significant difference between the two groups, which they divided at random, X'1 and X1. We defined the two groups, X'1 and X1, as equal groups (Fig. 4a, b). We thought that the difference between the two groups (control group and BMC group) from before BMC infusion to 1 day after BMC infusion is due to the BMC infusion. And since the time from X'1 to X'2 in the control group is only a day, we thought that each group at these two time points are approximately equal groups. We measured serum levels of each cytokine in two groups at each point using the t test. Serum concentrations of G-CSF and IL-1β in the BMC-infused group at 1 day after BMC infusion and in the control group tended to decrease with a significant difference (p < 0.05) (Fig. 4c, d) but did not significantly differ at 1 week after BMC infusion (Fig. 4e, f).

(a–d) Comparison of serum G-CSF and IL-1β between control (CCl4) and BMC-infused model mice. Serum concentrations of G-CSF and IL-1β were between control and BMC-infused model mice at 1 day and 1 week after BMCs. ∗,†Significant difference compared with values of control and BMC groups at 1 day after BMC infusion (p < 0.05).
G-CSF and IL-1β Expression on Mouse Liver Tissue After BMC Infusion
Although the key factors involved in the liver repair mechanism of BMC infusion were identified, therefore, we immunostained liver tissues to investigate the expression of G-CSF and IL-1β, which might be regulated at the early phase after BMC infusion. Liver tissues from model mice apparently did not express G-CSF before and at 1 week after BMC infusion, but the ratio of the stained area was significantly greater at 2 weeks thereafter (Fig. 5a–e). The rates of expression became relatively stable and were significantly higher at 2, 3, and 4 weeks after BMC infusion than before and at 1 week thereafter (p < 0.01) (Fig. 5f). The results were the same for IL-1β (Fig. 6a–e) (p < 0.01) (Fig. 6f).

Expression (a–e) and labeling index (f) of G-CSF in liver tissues from model mice. Immunohistochemistry of G-CSF expression in model mice shows that liver G-CSF expression is essentially absent before BMCs (a) and at 1 week (b) after, but obviously increased at 2 (c), 3 (d), and 4 (e) weeks after BMC infusion. Original magnification: 200x (a–e). (f) Summary of (a–e). Time course of ratio (%) of G-CSF expression in mouse liver shows increases from 2 weeks after BMC infusion. ∗Significant difference compared with value before and at 1 week after BMC infusion (p < 0.01).
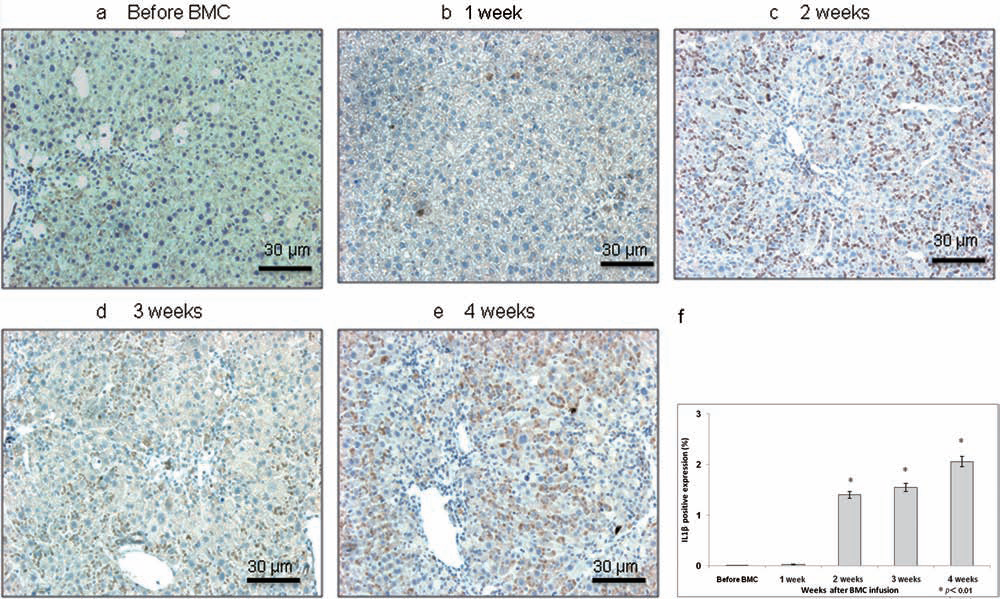
Expression (a–e) and labeling index (f) of IL-1β in liver tissues from model mice. Immunohistochemistry for IL-1β in model mice infused with BMCs show similar distribution of areas of liver that are positive for expression of IL-1β and G-CSF. Interleukin-1β is essentially absent before (a) and at 1 week after (b) BMC infusion, but obviously increased at 2 (c), 3 (d), and 4 (e) weeks thereafter. Original magnification: 200x (a–e). (f) Summary of (a–e). Time course of ratio (%) of IL-1β expression in mouse liver shows gradual increase from 2 weeks after BMC infusion. ∗Significant difference compared with value before and at 1 week after BMC infusion (p < 0.01).
Discussion
Here, we comprehensively compared chronological changes in serum cytokines after BMC infusion between humans and mice and clarified the importance of early-phase changes in the kinetics of G-CSF and IL-1β, both of which are involved in liver regeneration.
To the best of our knowledge, the present study is the first to comprehensively measure chronological changes in cytokines during liver repair after BMC infusion in humans and mice. Substantial differences in chronological changes at each time period were found for G-CSF, IL-6, and IL-1β. Furthermore, IL-1β and G-CSF chronologically and similarly changed between model mice and patients with LC after BMC infusion. With respect to the F(h) j for human G-CSF and human IL-1β (vectors indicating chronological changes), Table 2 shows a decrease for f1 (two-dimensional x component) and an increase for f2 (two-dimensional y component). Human serum G-CSF and IL-1β levels decreased from before to 1 day after ABMi, but IL-1β increased from 1 day to 1 week after ABMi, whereas G-CSF levels did not change. These results indicate that ABMi transiently downregulated G-CSF and IL-1β at 1 day after infusion in both patients and model mice and that infused BMCs repair the cirrhotic liver by suppressing the early expression of these cytokines. G-CSF and IL-1β in sera of LC patients without ABMi therapy were not changed 1 week after admission (data not shown). However, proving that the BMC infusion caused these cytokine changes in the patients treated with ABMi is difficult. Therefore, we examined whether the chronological changes were an incidental artifact caused by the act of BMC infusion in the mouse model. The comparison between the control CCl4 alone and BMC-infused groups showed a clear downward shift in two cytokines at 1 day after BMC infusion. We indicate the downregulation of these cytokines as the super early phase. Since these changes persisted for 1 week, the serum cytokine concentrations appeared to move into an equilibrium phase that did not significantly differ from control values. Although the values of the two serum cytokines changed soon after the BMCs, we speculate that these cytokines interacted with others, which led to similar values to those of the control group over time. We also analyzed G-CSF and IL-1β expression in the cirrhotic mice liver after BMC infusion. Neither G-CSF nor IL-1β were expressed in mouse liver tissues before or at 1 week after BMC infusion, but the rate of expression significantly increased starting from 2 weeks thereafter. During the early phase of BMC infusion, G-CSF and IL-1β were induced in the blood, but not in the liver. Also during the early phase of BMC infusion, G-CSF and IL-1β expression in liver tissue was suppressed, but at 1 week thereafter, their expression might not have been suppressed. This also suggests that suppressing changes in G-CSF and IL-1β during the early phase of BMC infusion might be important to repair of cirrhosis liver.
Recent human studies have found that transplantation with bone marrow stem cells after peripheral induction with G-CSF confers therapeutic effects against acute myocardial infarction (4,7). In addition, clinical studies of neovascularization for peripheral vascular diseases based on small doses of G-CSF injected subcutaneously are under way, and the therapeutic effects are comparable to those of autologous BMC transplantation (2). Monotherapy with G-CSF does not appear to significantly improve liver function and in fact might hinder liver regeneration (10,16). Here, the rapid decrease in serum G-CSF following BMC infusion might have induced the recovery of liver function. These results indicate that chronological changes in G-CSF are more important than its simple administration. Human and mouse IL-1β transiently decreased and then increased after BMC infusion. IL-1β is an inflammatory cytokine that is secreted by various cells including macrophages, T-cells, and B-cells, and it suppresses liver repair after hepatectomy or after acute liver dysfunction (3,9). Such decreases in IL-1β might have helped to improve liver function after BMC infusion.
Still many unknown things remained, but the finding of early cytokine change such as G-CSF and IL-1β might be important to understand the repairing mechanism for cirrhosis liver after BMC infusion.
Conclusion
Changes in cytokines after BMC infusion defined herein appear to be important for understanding the repair mechanisms involved in nitrating liver cirrhosis patient by ABMi therapy.
Footnotes
Acknowledgments
This study was supported by Grants-in-Aid for Scientific Research from the Japan Society for the Promotion of Science (Nos. 18590737, 19390199, and 22390150) and by the Ministry of Health, Labour and Welfare, Japan Science and Technology Agency, and the Knowledge Cluster Initiative for translational research. The authors declare no conflicts of interest.