
Abstract
Cell transplantation has been suggested to display several neuroprotective and/or neuroregenerative effects in animal models of central nervous system (CNS) trauma. However, while most studies report on clinical observations, currently little is known regarding the actual fate of the cell populations grafted and whether or how the brain's innate immune system, mainly directed by activated microglia and astrocytes, interacts with autologous cellular implants. In this study, we grafted well-characterized neural stem cell, mouse embryonic fibroblast, dendritic cell, bone marrow mononuclear cell, and splenocyte populations, all isolated or cultured from C57BL/6-eGFP transgenic mice, below the capsula externa (CE) of healthy C57BL/6 mice and below the inflamed/demyelinated CE of cuprizone-treated C57BL/6 mice. Two weeks postgrafting, an extensive quantitative multicolor histological analysis was performed in order (i) to quantify cell graft localization, migration, survival, and toxicity and (ii) to characterize endogenous CNS immune responses against the different cell grafts. Obtained results indicate dependence on the cell type grafted: (i) a different degree of cell graft migration, survival, and toxicity and (ii) a different organization of the endogenous immune response. Based on these observations, we warrant that further research should be undertaken to understand—and eventually control—cell graft-induced tissue damage and activation of the brain's innate immune system. The latter will be inevitable before cell grafting in the CNS can be performed safely and successfully in clinical settings.
Introduction
Severe injuries to the central nervous system (CNS), due to trauma, stroke, autoimmunity, or disease, are within the top 5 causes of death and represent an important social and economical burden on our Western society. While there is currently no effective treatment to restore damaged and/or dysfunctional neural tissue, much progress in this field is expected to come from stem cell research. Several reports indeed ascribe improved functional recovery in animal models of neural deficit to the beneficial influence of infused mesenchymal (MSC), neural (NSC), and other stem cell populations (16,24,26,31). However, although functional recovery was the primary endpoint in these studies, little is known about the actual in vivo fate and/or physiological function of transplanted cell populations. For the latter, several studies using premortem in vivo bioluminescence and magnetic resonance imaging or postmortem histological analysis have indicated that cellular grafts can survive in the (injured) CNS environment (1,5,11), although their mode of action remains elusive (7). Moreover, to date, it is still not fully unraveled which role the brain's innate immune system plays in recognizing cellular grafts within the highly organized CNS environment and how these inflammatory processes might eventually control and/or stimulate neuroregeneration (27). In this context, our previous studies have focused on the determination of autologous, allogeneic, and xenogeneic MSC and NSC survival following implantation in brain or spinal cord tissue. Although others report on the in vitro and in vivo immunosuppressive character of MSCs and NSCs (2,31,34) and the immune-privileged status of the CNS (8), in our hands allogeneic and xenogeneic MSCs were rapidly eliminated by activated microglial cell populations in the absence of immune suppressive therapy (4,25,29). These data underscore our preceding suggestion that cell transplantation research in the CNS would benefit from profound immunological studies (22). With regard to grafting of reporter gene-modified syngeneic MSCs (generally referred to as autologous cell transplantation), we previously noted that an initial recognition of cell implants by CD11b-expressing activated microglia was not detrimental for cell survival and disappeared at 2–3 weeks postgrafting (3). Moreover, introduced reporter genes did not display direct immunogenicity for autologous cellular grafts in brain tissue, while they are likely to be subject of T-cell-mediated recognition upon autologous cell grafting in peripheral tissues of immune competent mice (3,4). In course of these studies, we additionally focused on comparing the reactivity of endogenous astrocytes towards autologous reporter gene-modified MSC and NSC grafts in the CNS of healthy immune competent mice (12,23). Interestingly, next to activation of microglia against autologous cellular grafts, also astrocyte responses were initiated at early time points postgrafting, although they appeared to be different dependent on the cell type grafted. Thus far, on the preclinical level, very few studies (6,10,20,35) have thoroughly investigated and compared (i) the actual survival, migration, and toxicity of grafted cell populations in both healthy and injured CNS and (ii) whether or how the brain's innate immune system interacts with autologous cellular implants. In this study, we have therefore grafted five well-characterized (stem) cell populations, among them adherently cultured NSCs, mouse embryonic fibroblasts (MEFs), dendritic cells (DCs), bone marrow mononuclear cells (BMMNCs), and splenocytes (SPLEENs), all isolated or cultured from C57BL/6-enhanced green fluorescent protein (eGFP) transgenic mice, below the capsula externa (CE) of healthy C57BL/6 mice and below the demyelinated/inflamed CE of cuprizone-treated C57BL/6 mice. The cuprizone model for CNS inflammation is used here as a tool to obtain reproducible neuroinflammation within the corpus callosum (CC) and CE without involvement of peripheral immune responses and/or large necrotic lesions (18). The five cell populations were selected based on their physiological properties in their natural environment. NSCs obviously are the first choice of target cells for CNS therapy; however, as known from the limited endogenous repair mechanisms of the injured and/or aged CNS (15,33), their exploitation might need strategies to improve migration, survival, and targeted differentiation (17). MEFs, on the other hand, like MSCs and fibroblasts, can easily be expanded ex vivo and have previously been shown to be robust cell types for grafting studies at various sites throughout the body (19). DCs are the professional antigen-presenting cells of the peripheral immune system and have the ability for long distance migration from sites of injury and/or antigen deposition towards draining lymph nodes (9). Here we included this cell type as a putative positive control to unravel potential novel mechanisms for long-distance cell migration in injured CNS tissue. BMMNCs or the hematopoietic stem cells within this population are often used to treat haematological malignancies. Their ability to migrate to the bone marrow indicates that this cell population has certain properties for targeted migration to sites of inflammation and survival in this environment. As this mechanism is (partially) mediated via C-X-C chemokine receptor type 4/stromal cell-derived factor 1α (CXCR4/SDF1α) signaling (28), we included this population for cell grafting studies in the CNS, as neuroinflammation in the cuprizone mouse model is also characterized by local secretion of SDF1α by activated astrocytes and microglia (21). Finally SPLEEN cells, which consist of multiple cell populations including macrophages and T cells, encompass a population of cells displaying high migratory capacity in the CNS upon pathological conditions (32). Two weeks postgrafting, an extensive quantitative multicolor histological analysis was performed in order to investigate cellular interactions between the grafted cell populations and the CNS environment. The presented data in this study provide a detailed characterization of different cellular grafts with regard to localization, migration, survival, immunogenicity, and toxicity in the CNS under both healthy and inflammatory conditions.
Materials and Methods
Animals
Female C57BL/6-eGFP transgenic mice were obtained via Jackson Laboratories (strain code 003291) and further bred in the animal facility of the University of Antwerp until use for (stem) cell isolation or culture (n = 12). Female wild-type C57BL/6J mice, 8–10 weeks of age, were obtained via Charles River Laboratories (strain codevvv 027) and used for cell implantation experiments (n = 93) or for (stem) cell isolation or culture (n = 4). For all experiments, mice were kept in normal day–night cycle (12/12) with free access to food and water. All experimental procedures were approved by the ethics committee for animal experiments of the University of Antwerp (approval no. 2006/36 and 2009/1).
Induction of CNS Inflammation and Demyelination
Female wild-type C57BL/6J mice, 8–10 weeks of age, had ad libitum access to standard rodent lab chow mixed with 0.2% w/w cuprizone (Sigma-Aldrich, Germany) for 4 weeks to induce inflammation and demyelination in the CC/CE. After 4 weeks of cuprizone administration, mice underwent cell grafting below the CE and were allowed to recover for 2 weeks with ad libitum access to standard rodent lab chow without cuprizone.
Neural Stem Cell Culture
NSCs were cultured from embryonic brains of wt C57BL/6J or C57BL/6-eGFP transgenic mice according to previously described protocols (23). Briefly, embryonic brains (E14.5) were enzymatically dissociated using a 0.2% collagenase A (Roche)/DNase-I (1000 Kunitz units/50 ml, Sigma) solution (in PBS) for 2 h at 37°C in a shaking water bath. The cell population obtained was then resuspended in 10 ml “neural expansion medium” (NEM), consisting of neurobasal A medium (Invitrogen) supplemented with 10 ng/ml epidermal growth factor (EGF, ImmunoTools), 10 ng/ml human fibroblast growth factor-2 (hFGF-2, ImmunoTools), 100 U/ml penicillin (Invitrogen), 100 mg/ml streptomycin (Invitrogen) and 0.5 μg/ml amphotericin B (Invitrogen), and 1% modified N2 supplement. The modified N2 supplement consisted of Dulbecco's modified Eagle's medium (DMEM)/F12 (Gibco) supplemented with 7.5 mg/ml bovine serum albumin (BSA, Invitrogen), 2.5 mg/ml insulin (Sigma), 2 mg/ml apo-transferrin (Sigma), 0.518 μg/ml sodium selenite (Sigma), 1.6 mg/ml putrescine (Sigma), and 2 μg/ml progesterone (Sigma). Cells were plated in a T25 culture flask for 5–7 days in order to obtain a neurosphere population. Next, harvested neurospheres were dissociated for 5 min in 2 ml accutase (Sigma A6964, ready-to-use solution) at 37°C, and cells were replated in 10 ml NEM on fibronectin-coated (5 μg/ml in PBS, R&D Systems) T25 culture flasks in order to allow outgrowth of adherently growing NSC cultures. Following 24 h of culture, non-adherent cells were removed and 10 ml fresh NEM was added to the cultures. After 7 days, cultured cells were harvested following accutase treatment (2 ml per T25 flask) for 5 min at 37°C and replated in a new fibronectin-coated T25 flask in 10 ml NEM (passage 1). For routine cell culture, NEM was replaced every 3–4 days and NSC cultures were split 1:5 every 7 days. All cultured NSCs were incubated at 37°C and 5% CO2.
Mouse Embryonic Fibroblast Culture
MEFs were cultured from embryos of wt C57BL/6J or C57BL/6-eGFP transgenic mice. For this, embryos (E14.5) were harvested and liver, spleen, and brain were removed. Next, the embryo is dissociated by mechanical trituration until the cell suspension has no large tissue clumps left. The obtained suspension is then further enzymatically digested by means of trypsin-EDTA (Invitrogen)/DNAse-1 (1,000 Kunitz units/50 ml, Sigma) incubation until a single cell suspension is obtained. The total cell population obtained was plated in a T25 culture flask (one flask per embryo) in 10 ml MEF medium, consisting of DMEM containing l-glutamine (Invitrogen) supplemented with 10% fetal calf serum (FCS, Hyclone), 100 U/ml penicillin (Invitrogen), and 100 mg/ml streptomycin (Invitrogen). For routine cell culture, MEF medium was replaced every 2–3 days and MEF cultures were split 1:3 every 4–5 days. All cultured MEFs were incubated at 37°C and 5% CO2.
Dendritic Cell Culture
DCs were cultured from bone marrow (BM) of wt C57BL/6J or C57BL/6-eGFP transgenic mice according to previously described protocols (23). For this, BM cells flushed from femurs and tibias of 8- to 12-week-old female mice were dispersed through a 100-μm nylon cell strainer (BD Falcon) to obtain a single cell suspension. To initiate DC cultures, 5 × 10⁶ BM cells were seeded in a T175 culture flask in 20 ml DC medium with following composition: RPMI-1640 medium supplemented with l-glutamine (Invitrogen), 10% fetal calf serum (FCS), 50 μM β-mercaptoethanol, 100 U/ml penicillin/streptomycin, and 20 ng/ml recombinant mouse granulocyte-macrophage colony stimulating factor (rmGM-CSF, ImmunoTools). At day 3 of culture, an additional 20 ml DC medium was added to each culture flask. At days 6 and 8, half of the culture supernatant was collected and centrifuged and the cell pellet was resuspended in 20 ml fresh DC medium and returned to the culture flask. All cultured DCs were incubated at 37°C and 5% CO2. Cells were harvested and used for experiments at day 10 of culture.
Bone Marrow Mononuclear Cell Isolation
BMMNCs were isolated from bone marrow (BM) of wt C57BL/6J or C57BL/6-eGFP transgenic mice by flushing BM cells from femurs and tibias of 8- to 12-week-old female mice. Cells were dispersed through a 100-μm nylon cell strainer (BD Falcon) to obtain a single cell suspension. Cells were then centrifuged and resuspended at the appropriate concentration.
Splenocyte Isolation
SPLEEN cells were isolated from dissected spleens of wt C57BL/6J or C57BL/6-eGFP transgenic mice by dispersing the spleens of 8- to 12-week-old female mice were through a 100-μm nylon cell strainer (BD Falcon) to obtain a single cell suspension. Cells were then centrifuged and resuspended at the appropriate concentration.
Immunophenotyping of Cultured Cell Populations
For immunophenotyping of NSC, MEF, DC, BMMNC, and SPLEEN cell populations isolated or cultured from wild-type C57BL/6 mice, flow cytometric analyses were performed using the following directly labeled monoclonal antibodies: phycoerythrin (PE)-labeled rat anti-mouse stem cell antigen-1 (Sca-1; R&D Systems, FAB1226P), PE-labeled anti-mouse A2B5 (Miltenyi Biotec, 130-093-581), and PE-labeled rat anti-mouse CD45 (eBioscience, 12-0451-82), as previously described (3,23). For assessment of eGFP transgene expression in NSC, MEF, DC, BMMNC, and SPLEEN cell populations isolated or cultured from transgenic C57BL/6-eGFP mice, direct flow cytometric analyses were performed, and data are provided as mean percentages of eGFP-expressing cells. For all measurements, cell viability was assessed through addition of GelRed (1x final concentration, Biotum) to the cell suspension immediately before flow cytometric analysis, and data are provided as mean percentage of cell viability. Flow cytometric analysis was performed using an Epics XL-MCL analytical flow cytometer (Beckman Coulter). At least 10,000 cells were analyzed per sample, and flow cytometric data were analyzed using FlowJo software.
Cell Transplantation Experiments
All surgical interventions were performed under sterile conditions, as previously described (12,23). In brief, mice were anesthetized by an intraperitoneal injection of a ketamin (80 mg/kg) + xylazin (16 mg/kg) mixture in PBS and placed in a stereotactic frame. Next, a midline scalp incision was made and a hole was drilled in the skull using a dental drill burr at the height of Bregma and 2 mm to the right side of the midline. Thereafter, an automatic microinjector pump (kdScientific) with a 10-μl Hamilton syringe was positioned above the exposed dura. A 30-gauge needle (Hamilton), attached to the syringe, was stereotactically placed through the intact dura to a depth of 2.5 mm (directly below the CE). After 2 min of pressure equilibration, 5 × 10⁵ cells of the respective populations were injected in a volume of 2 μl PBS at a speed of 0.7 μl/min. The needle was retracted after another 4 min to allow pressure equilibration and to prevent backflow of the injected cell suspension. Next, the skin was sutured and a 0.9% NaCl solution was administered subcutaneously in order to prevent dehydration while mice were placed under a heating lamp to recover.
Histological Analysis
Histological analysis was performed according to previously optimized procedures (12,23). Consecutive 10-μm-thick cryosections were prepared using a microm HM500 cryostat for all cell-grafted brains starting before the graft site until beyond the graft site, keeping track of both successful and lost slides. Slides were observed by direct immunofluorescence microscopy in order to locate eGFP-expressing cell transplants. Further immunofluorescence analyses were performed using the following antibodies: a polyclonal rabbit anti-GFAP (glial fibrillary acidic protein; Abcam, ab7779) in combination with a Marina Blue-labeled goat anti-rabbit secondary antibody (Invitrogen, M10992) or with a Texas Red-labeled goat anti-rabbit secondary antibody (Abcam, ab6719), a rabbit anti-IBA1 (ionized calcium binding adaptor molecule 1 Wako, 019-19741) in combination with a Marina Blue-labeled goat anti-rabbit secondary antibody (Invitrogen, M10992), a monoclonal biotinylated rat anti-CD11b (eBioScience, 13-0112) in combination with an Alexa Fluor® 568-labeled streptavidin (Invitrogen, S11226). Myelin was stained using Fluoromyelin Red® (Invitrogen, F34652) according to manufacturer's guidelines. For some analyses, slides were stained with 4′,6-diamidino-2-phenylindole (DAPI, Sigma, 1/1,000 dilution) in order to determine the number of nuclei. Following staining, sections were mounted using Prolong Gold Antifade (Invitrogen, P36930). Immunofluorescence analysis was performed using a standard research fluorescence microscope (Olympus Bx51 fluorescence microscope) equipped with an Olympus DP71 digital camera. Olympus Cell^F Software was used for image acquisition, processing, and analysis, as described below.
Cell Graft Localization, Migration, and Survival Analysis
For cell graft localization and migration analysis, all consecutive 10-μm-thick coronal cryosections containing eGFP-expressing cell grafts were collected and numbered accordingly to allow a 2D top-down view reconstruction of the graft site. For this, the brain's midline was used as a reference point to manually determine the location of the injection spot (based on location of the needle tract) as well as the migration to the left and right of this injection spot for each consecutive slide containing eGFP-expressing cells in both directions along the x-axis. Data from missing slides were linearly extrapolated based on data from adjacent slides. Next, obtained data from each cell type in a specific condition (healthy vs. cuprizone-treated brains) were overlaid based on the location of the injection spot to obtain a 2D overview of cell graft localization and migration in the xy plane. For data analysis, the penalized smoothing splines technique, a flexible semiparametric method to smooth the response of interest over time/space, was first used to obtain the smooth function of the cell migration for each condition. The 95% point-wise confidence bands for the smoothed curves are also constructed in order to assess the difference in the area of the cell migration around the referenced injection spot. Next, in order to compare the difference in area of cell migration around the referenced injecting spots, a bivariate (i.e., slides and distances are both taken as the response variables) linear mixed model with random effects of samples was used. Differences in migrational behavior for a given cell type in healthy and cuprizone-treated mice were evaluated using the likelihood ratio test, and the obtained p values were adjusted for multiple tests in four areas around the referenced injection spot using Bonferroni correction. An adjusted p < 0.05 was then considered to be statistically significant. For cell graft survival analysis, the graft site volume (i.e., the three-dimensional area where eGFP-expressing cells could be detected) was first determined following manual delineation of the actual surface of the graft site in the xz plane on each consecutive slide using Olympus Cell^F Software. Data from missing slides were linearly extrapolated based on data from adjacent slides, allowing the calculation of total graft site volume, provided as graft site volume in mm3 [= sum of each individual graft volume per slide (= graft site surface in xz plane × 10 μm)]. In order to determine the cell density within the delineated graft site, at least three representative slides per individual cell grafted mouse were stained with DAPI. Based on manual counting of the nuclei using Olympus Cell^F Software, the cell density within the delineated graft site was determined for each individual cell grafted mouse and provided as mean # nuclei/mm3 [= (# nuclei counted within graft site on three slides) / (graft site volume in mm3 of same three slides)]. Based on the above-described parameters, the absolute number of cells per graft site was calculated and provided as # nuclei/graft site [= (mean # nuclei/mm3) × (graft site volume in mm3)]. In order to determine cell graft survival, the ratio of eGFP+ versus eGFP nuclei was manually counted in Olympus Cell^F Software and provided as percentage of eGFP+ nuclei. The actual percentage of cell graft survival was then calculated based on the latter two parameters and corrected for cell viability + eGFP-expression before injection [= (# nuclei/graft site) × (% eGFP+ nuclei) × (mean % cell viability) × (mean % eGFP-expression)]. For statistical analysis, differences in total migration (in xy plane), graft site volume, # nuclei/mm3, and # nuclei/graft site, between healthy and inflammatory conditions and between cell types, were evaluated using t tests in a two-way ANOVA model, which include the main effects of cell types, conditions, and their interaction. The response variables were log-transformed in order to improve the normality of the data. Percentage of eGFP+ nuclei and percentage of cell graft survival were fitted in the generalized linear model with a binomial distribution. Comparisons between healthy and inflammatory conditions were adjusted using Tukey's method and an adjusted p < 0.05 was considered to be statistically significant. Comparisons between cell types were pair-wise (i.e., pooled data from both healthy and inflammatory conditions) evaluated between all cell types used and obtained p values were adjusted for multiple tests using Tukey's approach. An adjusted p < 0.05 was then considered to be statistically significant.
Cell Graft Immunogenicity and Toxicity Analysis
For evaluating cell graft immogenicity, three representative GFAP/DAPI-stained slides per graft of eGFP-expressing MEF and NSC grafts under both healthy and inflammatory conditions were manually counted for (i) the total cell number within the graft site area, (ii) the number of eGFP-expressing cells within the graft site area, and (iii) the number of GFAP+(eGFP-) astrocytes within the graft site area. The number of microglia within the graft site area was then calculated by substracting the number of eGFP-expressing cells and the number of GFAP+(eGFP-) astrocytes from the total cell number within the graft site area. The number of eGFP-expressing cells, GFAP+(eGFP-) astrocytes, and microglia were then represented as mean percentage of cellular composition of MEF and NSC grafts under both healthy and inflammatory conditions. Immunogenicity of DC, BMMNC, and SPLEEN grafts under both healthy and inflammatory conditions was visually evaluated by independent observers. For evaluating cell graft toxicity, fluoromylin red/IBA1-stained slides of eGFP-expressing cell grafts under both healthy and inflammatory conditions were visually evaluated by independent observers for myelin distribution and/or integrity around the graft site.
Results
In Vitro Characterization of Cultured Cell Populations
The five cell populations isolated from C57BL/6-eGFP transgenic mice used in this study, NSCs, MEFs, DCs, BMMNCs, and SPLEEN cells, were characterized by morphology, eGFP transgene expression, and immunophenotype. As shown in Figure 1A, NSCs and MEFs are adherently cultured cell populations displaying uniform eGFP expression, although a clear difference in cell size can be noted. DCs are cultured under slightly adherent conditions and display uniform eGFP expression. BMMNCs and SPLEEN cells are freshly isolated cell populations containing respectively 46% ± 7% SEM (n = 4) and 59% ± 1% SEM (n = 4) of eGFP-expressing cells. As shown in Figure 1B, flow cytometric immunophenotyping characterises the cell populations as follows: CD45- SCA1- A2B5+ for NSCs, CD45- SCA1+ A2B5- for MEFs, CD45+ SCA1- A2B5- for DCs, CD45+ SCA1- A2B5- for BMMNCs (a minor subpopulation expressing A2B5 can be noted) and CD45+ SCA1+/-A2B5- for SPLEEN cells. Although the latter does not allow for a full exclusive phenotyping of the five cell populations used in this study, it clearly indicates their different origin (i.e., neural, mesenchymal, or hematopoietic). For all experiments, including cell grafting studies, mean viability of NSC, MEF, DC, BMMNC, and SPLEEN populations was 93% ± 5% SEM (n = 6), 90% ± 6% SEM (n = 4), 97% ± 3% SEM (n = 4), 79% ± 10% SEM (n = 4), and 83% ± 10% SEM (n = 4), respectively.

In vitro characterization of cultured cell populations. (A) Top row: Immunofluorescence images of enhanced green fluorescent protein (eGFP)-expressing neural stem cells (NSCs), mouse embryonic fibroblasts (MEFs), dendritic cells (DCs), bone marrow mononuclear cells (BMMNCs), and splenocytes (SPLEENs) isolated or cultured from C57BL/6-eGFP transgenic mice (green fluorescence). The nuclei were stained with DAPI (blue fluorescence). A representative image was chosen from five independent images of each cell population. Scale bar: 100 μm. Bottom row: Flow cytometric analysis of direct eGFP fluorescence of cultured cell populations (filled green histogram). Cell populations cultured from wild-type C57BL/6 mice were used as control (open black histograms). A representative flow cytometric analysis was chosen from four independent experiments for each cell population. (B) Representative flow cytometric analysis for the expression of CD45, SCA1, and A2B5 on cultured NSCs, MEFs, DCs, BMMNCs, and SPLEEN cell populations. Open black histograms: control staining. Filled orange histograms: specific antibody staining. A representative flow cytometric analysis was chosen from three independent experiments for each cell population.
Identification of Grafted Cell Populations In Vivo
In order to investigate the behavior of different cell populations under healthy and inflammatory conditions in the CNS environment, cell grafting experiments were performed below the CE of healthy C57BL/6 mice and cuprizone-treated C57BL/6 mice. As shown in Figure 2A, mice that received a 4-week cuprizone treatment (Fig. 2A, middle) display severe demyelination in the CC and CE as compared to healthy control mice (Fig. 2A, left). In addition, while under control conditions GFAP+ astrocytes and IBA1+ microglia are only present in very few numbers in the CC and CE, the demyelinated CC and CE of cuprizone-treated mice has been highly infiltrated with GFAP+ astrocytes and IBA1+ microglia. Moreover, a substantial amount of microglia expresses the activation/phagocytosis marker CD11b. When cuprizone treatment is halted after 4 weeks of administration, 2 weeks later (Fig. 2A, right) spontaneous endogenous remyelination is observed, associated with the disappearance of IBA1+ microglia, but not GFAP+ astrocytes. In our experimental setup, we grafted NSC, MEF, DC, BMMNC, and SPLEEN populations below the CE of healthy control mice (n = 6 for NSC, n = 6 for MEF, n = 6 for DC, n = 6 for BMMNC, and n = 6 for SPLEEN) and below the demyelinated/inflamed CE of mice after 4 weeks of cuprizone treatment (n = 9 for NSCs, n = 5 for MEFs, n = 6 for DCs, n = 5 for BMMNCs, and n = 7 for SPLEEN cells). At 2 weeks postgrafting, all mouse brains were processed for quantitative histological analysis in order to evaluate the behavior of grafted cell populations under healthy and inflammatory conditions. Figure 2B shows representative overview images of the transplant site for the five different eGFP-expressing cell populations. In addition, inset pictures provide a higher magnification picture of the grafted cell population. From these images, it is already clear that certain differences between the different cell populations grafted can be visually observed, although differences between healthy and inflammatory conditions are less clear. While NSCs preferentially migrate along the CE, MEFs do not display any migratory behavior. At a higher magnification, it can also be noted that MEF grafts are delineated within the host tissue, while NSC grafts appear to migrate within the host tissue. At first sight, DC grafts appear to be highly motile within the CNS environment; however, their high migratory behavior is clearly associated with high toxicity as significant tissue damage can be observed. Finally, for BMMNC and SPLEEN only few cells can be detected at week 2 postgrafting, but they appear to display migratory capacity along the CE without significant toxicity.

Identification of grafted cell populations in vivo. (A) De/remyelination in the cuprizone mouse model. Immunofluorescent images taken from the corpus callosum (CC, top row) and the capsula externa (CE, bottom row) in control conditions (left), following 4 weeks of cuprizone treatment (middle), and 2 weeks following arrest of cuprizone treatment (right). For each panel, left column showing costained images of GFAP+ astrocytes (blue fluorescence) and CD11b+ activated microglia (red fluorescence) and right column showing costained images of IBA1+ microglia (blue fluorescence) and myelin (red fluorescence). Representative images given at each time point were chosen from three independently analyzed mice for each time point. Scale bar: 200 μm. (B) Overview images of grafted eGFP-expressing NSC, MEF, DC, BMMNC, and SPLEEN cell populations in both healthy and cuprizone-treated CNS at week 2 postgrafting. Inset images provide a higher magnification picture of the grafted cell populations. Representative images were chosen from multiple mice analyzed histologically (healthy control mice: n = 6 for NSCs, n = 6 for MEFs, n = 6 for DCs, n = 6 for BMMNCs, and n = 5 for SPLEEN cells; cuprizone mice n = 9 for NSCs, n = 5 for MEFs, n = 6 for DCs, n = 5 for BMMNCs, and n = 7 for SPLEEN cells). Scale bar: 500 μm for main images and 100 μm for detailed images.
Detailed Cell Graft Localization and Migration Analysis
Most published cell grafting studies provide a histological interpretation of in vivo cell graft localization and migration as described above. In this study, we aimed at a detailed description of the migratory behavior of different cell types grafted in the CNS environment. For this, we created a two-dimensional top-down view of mean cell graft localization for each grafted cell population under both healthy and inflammatory conditions, as described in the materials and methods section (n values: see section above). The cell graft localization plots in Figure 3 represent an averaged cell graft of a given cell population under healthy (blue line) and inflammatory (red line) conditions, with 95% point-wise confidence bands (dotted lines) in order to assess the difference in the area of cell graft migration around the referenced injection spot. Significant differences (p < 0.05) in cell graft localization between healthy and inflammatory conditions were observed for NSC, MEF, DC, and SPLEEN grafts. However, as no significant differences were observed with regard to total surface migration under healthy or inflammatory conditions (Fig. 3B), the observed differences for NSC, MEF, DC, and SPLEEN grafts localization might only reflect a slight reorientation of cell graft localization or migration under inflammatory conditions. Additionally, analysis of total surface migration between different cell types indicates that both DC and BMMNC grafts display a significantly higher migratory capacity as compared to NSC, MEF, and SPLEEN grafts (Fig. 3B, for all comparisons p < 0.005). No significant differences were observed between NSC, MEF, and SPLEEN grafts or between DC and BMMNC grafts.

Cell graft localization and migration analysis. (A) Top left image showing a schematic overview of the transverse (xy) and coronal (xz) plane at the respective grafting coordinates with indicative representation of the graft location. The rectangle superimposed on the transverse image corresponds to the xy-axes of the cell migration plots, where intersection of the interior lines (0 point in both planes) indicates the injection spot. The scale bar superimposed on the coronal image corresponds to the x-axis of the cell migration plots, where the 0 point indicates the injection spot below the CE. The cell graft localization plots represent an averaged cell graft of a given cell population under healthy (blue line) and inflammatory (red line) conditions, with 95% point-wise confidence bands (dotted lines) in order to assess the difference in the area of the cell migration around a referenced injecting spot for NSC, MEF, DC, BMMNC, and SPLEEN grafts. (B) Overview of total surface migration in the transverse (xy) plane for NSC, MEF, DC, BMMNC, and SPLEEN grafts at 2 weeks postgrafting in healthy and cuprizone-treated CNS tissue. Results are given as the average total migration in mm2 ± SEM. Presented data were calculated based on multiple mice analyzed histologically (healthy control mice: n = 6 for NSCs, n = 6 for MEFs, n = 6 for DCs, n = 6 for BMMNCs, and n = 5 for SPLEEN cells; cuprizone mice n = 9 for NSCs, n = 5 for MEFs, n = 6 for DCs, n = 5 for BMMNCs, and n = 7 for SPLEEN cells).
Detailed Cell Graft Survival Analysis
Not only cell migration is of importance for evaluating the success of cell grafting in the CNS but also the level of cell graft survival (Fig. 4). To evaluate the latter, we first calculated the cell density within the graft site for three animals of each experimental group based on the average number of DAPI+ nuclei counted within a delineated graft (Fig. 4A). As shown in Figure 4Bi, a significantly higher cell density is noted for NSC, MEF, and DC grafts as compared to BMMNC and SPLEEN grafts (for all comparisons p < 0.00001). However, no significant differences were observed between healthy and inflammatory conditions. Additionally, following volumetric measurement of the total graft volume (Fig. 4Bii) and calculation of the number of DAPI+ cells within a graft (Fig. 4Biii), it can be noted that DC grafts encompass the highest graft volume and contain a significantly higher number of cells per graft area, as compared to NSC, MEF, BMMNC, and SPLEEN grafts (for all comparisons p < 0.0002). No significant differences were observed between healthy and inflammatory conditions. Additionally, the percentage of eGFP+ DAPI+ cells within the total number of DAPI+ cells was counted. As shown in Figure 4Biv and D, around 25% of the counted cell population effectively displays eGFP expression and therefore corresponds to the grafted cell population, without significant differences between cell types and between healthy and inflammatory conditions. However, when recalculated to the originally 5 × 10⁵ grafted cells, only very few cells were able to survive under both healthy and inflammatory conditions. Without significant differences between healthy and inflammatory conditions, mean cell graft survival was estimated to be 2.2% ± 0.2% SEM (n = 6) for NSC, 2.6% ± 0.5% SEM (n = 6) for MEF, 2.8% ± 0.6% SEM (n = 6) for BMMNC, and 1.3% ± 0.2% SEM (n = 6) for SPLEEN grafts (Fig. 4C). In contrast, DC grafts displayed a significantly higher survival rate of around 17.7% ± 3.7% SEM (n = 6) as compared to NSC, MEF, BMMNC, and SPLEEN grafts (for all comparisons p < 0.05), although the latter might have been influenced by the proliferative nature of an activated DC population.

Cell graft survival analysis. (A) Immunofluorescent images of the NSC, MEF, DC, BMMNC, and SPLEEN graft sites (green fluorescence) stained with DAPI (blue fluorescence). A white line delineates the graft site. Images are representative for grafted cell populations in both healthy and cuprizone-treated CNS tissue. Scale bar: 200 μm. (B) For each cell type grafted in healthy and cuprizone-treated CNS tissue, overview of (i) the observed cell density within the delineated graft site provided as # nuclei/mm3, (ii) the observed graft site volume in mm3, (iii) the calculated # nuclei/graft site, and (iv) the observed percentage of eGFP-expressing nuclei within a delineated graft site. Results are given as the average ± SEM of three grafted mice analyzed for each group. (C) For each cell type grafted in healthy and cuprizone-treated CNS tissue, overview of the percentage of surviving cells from the initially 5 × 10⁵ grafted cells. Results are given as the average ± SEM of three grafted mice analyzed for each group. Presented data in (A), (B), and (C) were calculated based on multiple mice analyzed histologically (n = 3 for each cell population in healthy control mice; n = 3 for each cell population in cuprizone mice). (D) Quantitative analysis of the number of eGFP-expressing NSCs or MEFs, GFAP+ astrocytes, and microglia within delineated NSC and MEF grafts sites. Presented data were calculated based on multiple mice analyzed histologically (n = 3 for NSC and MEF grafts in healthy control mice; n = 3 for NSC and MEF grafts in cuprizone mice).
Detailed Cell Graft Immunogenicity and Toxicity Analysis
In order to further investigate the limited cell graft survival, we investigated the endogenous neuroimmune response against the different cell populations grafted (Figs. 5 and 6). For this, the graft sites were stained for (i) IBA1 in order to demonstrate the presence of microglia, (ii) CD11b in order to demonstrate the presence of activated microglia, (iii) GFAP in order to demonstrate the presence of astrogliosis, and (iv) myelin in order to investigate the influence of cell grafting on either myelin structure in healthy mouse brain or the endogenous remyelination process following arrest of cuprizone treatment in demyelinated CNS tissue (see also Fig. 2A). From the representative overview images provided in Figure 5 and the detail images provided in Figure 6, it is clear that at week 2 postgrafting the different cell populations grafted induce (i) a different type of endogenous immune reactivity and (ii) a different degree of toxicity to the CNS architecture in both healthy and demyelinated CNS tissue. While NSC grafts spread along the CE in both healthy and demyelinated CNS tissue, in both conditions the graft site displayed extensive invasion of GFAP+ astrocytes and IBA1+ microglia. Few microglia display expression of the CD11b activation/phagocytosis marker. It can also be noted that NSC grafting in healthy CNS tissue induces structural damage to the myelin in the CE, while NSC grafting in demyelinated CNS tissue prevents endogenous remyelination at the graft site. In contrast, MEF grafts do not display any migratory behavior, which can partially be explained by the formation of a dense astrocytic scar surrounding the MEF graft in both healthy and demyelinated CNS tissue. Similar to NSC grafts, MEF grafts are extensively invaded by microglia, of which only few express the CD11b marker. With regard to CNS architecture, it is clear that MEF grafts physically interfere with the myelin structure at the graft site in both healthy and demyelinated CNS tissue. Obviously, there is a clear difference between NSC and MEF grafts in CNS tissue, although no difference is observed between healthy and demyelinated CNS tissue. In both conditions, NSC grafts are invaded by microglia and astrocytes, while MEF grafts are invaded only by microglia (Fig. 4D). Additionally, astrocyte scar tissue can be noted in the surrounding of both NSC and MEF grafts. DC grafts are extremely toxic to both healthy and demyelinated CNS tissue, displaying a complex reactivity between grafted DCs and endogenous microglia, both expressing the CD11b marker and endogenous astrocytes. Finally, BMMNC and SPLEEN grafts, despite their very low survival, display similar immune reactivity. For both groups extensive astrogliosis, but limited microglial invasion and activation, is observed in both healthy and demyelinated CNS tissue. Although a slightly higher degree of toxicity to the CNS architecture can be observed under inflammatory conditions as compared to healthy brain tissue, the overall interference with myelin structures is rather limited as compared to DC, MEF, and NSC grafts.

Cell graft immunogenicity and toxicity analysis: overview pictures. Images of grafted eGFP-expressing NSC, MEF, DC, BMMNC, and SPLEEN cell populations in both healthy and cuprizone-treated CNS at week 2 postgrafting. For each panel: left column showing costained images of GFAP+ astrocytes (blue fluorescence) and CD11b+ activated microglia (red fluorescence) and right column showing representative co-stained images of IBA1+ microglia (blue fluorescence) and myelin (red fluorescence). Representative images were chosen from multiple mice analyzed histologically (healthy control mice: n = 4 for NSCs, n = 3 for MEFs, n = 4 for DCs, n = 4 for BMMNCs, and n = 4 for SPLEEN cells; cuprizone mice: n = 4 for NSCs, n = 3 for MEFs, n = 4 for DCs, n = 3 for BMMNCs, and n = 3 for SPLEEN cells). Scale bar: 500 μm.
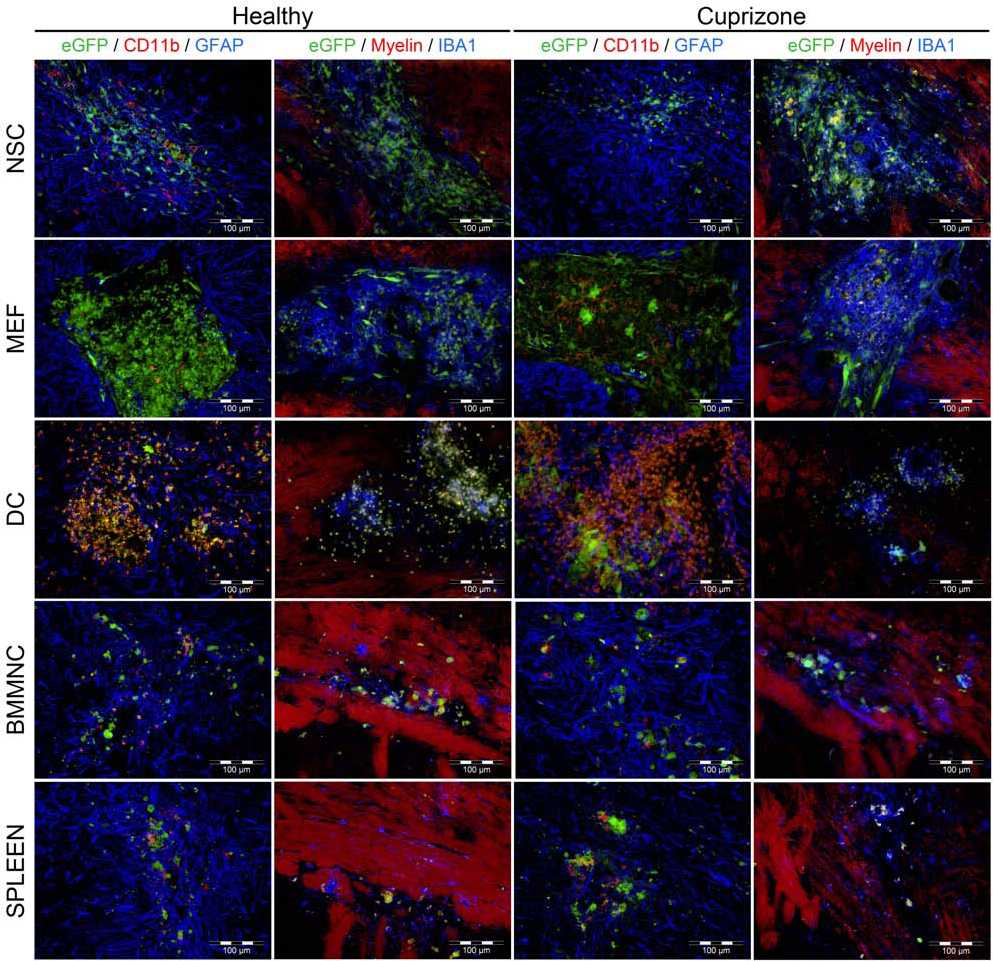
Cell graft immunogenicity and toxicity analysis: detailed pictures. Images of grafted eGFP-expressing NSC, MEF, DC, BMMNC, and SPLEEN cell populations in both healthy and cuprizone-treated CNS at week 2 postgrafting. For each panel: left column showing co-stained images of GFAP+ astrocytes (blue fluorescence) and CD11b+ activated microglia (red fluorescence) and right column showing representative costained images of IBA1+ microglia (blue fluorescence) and myelin (red fluorescence). Representative images were chosen from multiple mice analyzed histologically (healthy control mice: n = 4 for NSCs, n = 3 for MEFs, n = 4 for DCs, n = 4 for BMMNCs, and n = 4 for SPLEEN cells; cuprizone mice n = 4 for NSCs, n = 3 for MEFs, n = 4 for DCs, n = 3 for BMMNCs, and n = 3 for SPLEEN cells). Scale bar: 100 μm.
Discussion
In this study, we performed a detailed histological characterization NSC, MEF, DC, BMMNC, and SPLEEN grafts in the CNS. By comparing the behavior of these five cell populations under healthy and inflammatory conditions, we have now described several differences between these populations with regard to migrational behavior, survival, immunogenicity, and toxicity.
With regard to cell graft migration, for all cell populations grafted we did not observe a significant increase in cell migration under inflammatory conditions as compared to cell migration under healthy conditions, despite a small reorientation of graft site localization observed for NSC, MEF, DC, and SPLEEN grafts under inflammatory conditions. Although we have no definite explanation for these unexpected observations, that is, the lack of increased cell migration under inflammatory conditions, it might suggest that inflammatory responses are not the sole trigger to direct migration of (stem) cell grafts in the CNS. A possible explanation might, however, be found in the graft site location, which was directly below the site of inflammation, and thereby excludes the need for directed migration. In contrast, when comparing actual migration between cell populations, it can directly be noted that DC and BMMNC grafts display a significantly higher migratory capacity as compared to NSC, MEF, and SPLEEN grafts. However, further study of DC grafts can be excluded due to their extreme toxicity to CNS tissue. In contrast, BMMNC grafts displayed the highest migratory capacity, without extreme toxicity as observed with DC grafts. Further study towards the specific cell type within BMMNC grafts, which is capable of migrating into inflammatory tissue, and identification of the signaling pathway involved might enable (genetic) modification of NSC grafts to improve their migration behavior under inflammatory conditions.
With regard to cell graft survival, to our surprise, only very few of the initial amount of grafted NSCs, MEFs, BMMNCs, and SPLEEN cells were able to survive under both healthy and inflammatory conditions. This low number of cell survival (in general <3% at week 2 postgrafting) should basically be considered as an unsuccessful transplantation. At the moment, it is unclear why such a small number of grafted cells survive, although we might suggest that cell grafting into an unconditioned environment (i.e., the lack of angiogenesis causing hypoxia at the grafting site and the disruption of the complex CNS architecture) may not be well tolerated by cellular grafts. As also demonstrated in this study, grafted cell populations do not directly contribute to remyelination, probably due to their low survival and the endogenous immune response triggered, and therefore, future research might need to focus on either improving their intrinsic survival in the CNS environment or aiming to understand the endogenous immune response against grafted cells.
With regard to cell graft immunogenicity, we observed striking differences in how the endogenous immune response against the grafted cell populations is orchestrated. Although it is clear that microglia and astrocytes are the key players in the recognition of autologous cellular grafts (4), they do behave differently dependent on the cell type grafted. While NSC grafts become highly invaded by microglia and astrocytes, MEF grafts become highly invaded by microglia and surrounded by astrocytic scar tissue. Currently, it is unknown which response is the most favorable for long-term cell graft survival. Initial microglial invasion of cell grafts might be very deleterious (e.g., cell graft survival < 3%); however, microglia may also display a neuroprotective role after their initial inflammatory role, thereby allowing long-term survival of remaining cells. On the other hand, astrocyte invasion of cellular grafts may lead to total immune recognition but may also provide cellular and structural support for graft survival, as this is one of the main features of astrocytes. Alternatively, in case of MEF grafting, astrocytic scar tissue surrounding cellular grafts might result in shielding the grafted cells from the surrounding CNS tissue and thereby inhibiting their (cytokine-secreting) function, although it cannot be excluded that astrocytic scarring might enable graft survival and function by preventing further invasion of immune effector cells. At the moment, it is unclear why this endogenous immune response against NSC and MEF grafts is orchestrated differently, but it still leads to the same degree of cell graft survival. In contrast, BMMNC and SPLEEN grafts are less invaded by microglia but still display high level of astrocyte invasion. It cannot be excluded that (immune-modulating) cytokines produced by BMMNC and SPLEEN grafts might inhibit the migration of microglia, but it does not seem to have an effect on astrocyte responses. Finally, DC grafts are rejected by endogenous microglia and the observed high toxicity to CNS tissue is most likely mediated trough the secretion of TNFα, NO, and proteases by both populations (30). However, as differences in microglia and astrocyte responses are observed between NSC, MEF, BMMNC, and SPLEEN grafts, a further study of the local cytokine milieu created by grafted cells, microglia, and astrocytes might lead to a better understanding of the brain's innate immune responses to grafted cells and—eventually—allow to prevent, deviate, or tolerate these responses, resulting in increased graft survival.
With regard to cell graft toxicity, we noted that none of the cell populations grafted could directly contribute to remyelination of the demyelinated CC and CE. While this was not expected for MEF, DC, BMMNC, and SPLEEN grafts, it is clear that NSC grafting, even in an environment where endogenous remyelination is occurring, is not sufficient to trigger their differentiation towards oligodendrocyte progenitor cells (OPCs) and or mature oligodendrocytes. One might speculate that a 2-week time period is not sufficient for proper differentiation of grafted NSCs; however, endogenous remyelination does occur within a time period of 2 weeks. Further studies will therefore have to reveal the potency of other cell types to be grafted, including NSC-differentiated OPCs or oligodendrocytes, olfactory ensheating cells or Schwann cells, for their in vivo remyelinating capacity and—most importantly—their interaction with the brain's innate immune system. Alternatively, we have not yet investigated the influence of cell grafting in the CNS on endogenous remyelination itself. Further studies using diffusion tensor MRI should reveal differences in the degree and speed of endogenous recovery following cell grafting and/or the different immune responses induced against cellular grafts. Furthermore, caution should be taken with cell grafting in CNS tissue as our studies noted that no endogenous remyelination was observed at the grafts site of all cell populations grafted. Most likely, the ongoing local immune reaction is responsible for the lack of regeneration.
Summarizing our results, we here describe dependent on the cell type grafted in both healthy and injured CNS tissue: (i) a different degree of cell graft migration, survival and toxicity and (ii) a different organization of the endogenous immune response. Although several authors report on the clinical safety of cell grafting in CNS tissue (13,14,31), our results warrant that further research should be undertaken to understand—and eventually control—cell graft-induced tissue damage and activation of the brain's innate immune system. Alternatively, we cannot exclude that this graft-induced immunogenicity will be needed to activate endogenous repair mechanism. In case the latter turns out to be the working mechanism for transplantation-induced repair, research should be focusing on the replacement of cellular therapeutics with noncellular therapeutic alternatives aiming to stimulate a similar cascade of events. The latter will be inevitable before therapeutic intervention, aiming at the stimulation of endogenous repair mechanisms in the CNS, can be performed safely and successfully in clinical settings.
Footnotes
Acknowledgments
We acknowledge helpful assistance from Frank Rylant and Ingrid Bernaert (Laboratory of Pathology) with histological techniques. This work was supported by research grant ID-BOF 2006 of the University of Antwerp (granted to P.Po. and A.V.d.L.), by research grant G.0136.11 and G.0130.11 (granted to P.Pa., A.V.d.L., Z.B. and P.Po.) and 1.5.021.09.N.00 (granted to P.Po.) of the Fund for Scientific Research-Flanders (FWO-Vlaanderen, Belgium), by research grant BRAINSTIM of the Flemish Institute for Science and Technology (granted to Z.B. and A.V.d.L.), and in part by a Methusalem research grant from the Flemish government (granted to H.G. and Z.B.). We also gratefully acknowledge financial support from the IUAP research network nr P6/03 of the Belgian Government (Belgian Science Policy). Nathalie De Vocht holds a Ph.D.-studentship from the FWO-Vlaanderen. Peter Ponsaerts is a postdoctoral fellow of the FWO-Vlaanderen. The authors declare no conflict of interest.