
Abstract
In this study, we assess the feasibility of bioluminescence imaging to monitor the survival of Schwann cells (SCs) and olfactory ensheathing glia cells (OECs) after implantation in the lesioned spinal cord of adult rats. To this end, purified SCs and OECs were genetically modified with lentiviral vectors encoding luciferase-2 and GFP and implanted in the lesioned dorsal column. The bioluminescent signal was monitored for over 3 months, and at 7 and 98 days postsurgery, the signal was compared to standard histological analysis of GFP expression in the spinal cords. The temporal profile of the bioluminescent signal showed three distinct phases for both cell types. (I) A relatively stable signal in the first week. (II) A progressive decline in signal strength in the second and third week. (III) After the third week, the average bioluminescent signal stabilized for both cell types. Interestingly, in the first week, the peak of the bioluminescent signal after luciferin injection was delayed when compared to later time points. Similar to in vitro, our data indicated a linear relationship between the in vivo bioluminescent signal and the GFP signal of the SCs and OECs in the spinal cords when the results of both the 7 and 98 day time points are combined. This is the first report of the use of in vivo bioluminescence to monitor cell survival in the lesioned rat spinal cord. Bioluminescence could be a potentially powerful, non-invasive strategy to examine the efficacy of treatments that aim to improve the survival of proregenerative cells transplanted in the injured rat spinal cord.
Keywords
Introduction
An injury to the spinal cord often results in permanent loss of function. It was estimated by Wings for Life, a member of the International Campaign for Cures of Spinal Cord Injury Paralysis (ICCP), that the absence of successful treatment has resulted in 2.8 million people suffering from spinal cord injury-induced paralysis worldwide. Presently, one of the most promising therapeutic approaches for spinal cord injury is implantation of cellular implants in the damaged area of the spinal cord. These cell implants form a permissive substrate for regrowing axons, reduce the growth inhibitory environment, ameliorate secondary tissue damage, and assist in wound repair (9,10,33, 60,66,70,72,77,80,81,85,88). A number of clinical trials has been conducted or is ongoing to investigate the safety and efficacy of implantation of olfactory ensheathing cells (OECs), Schwann cells (SCs), bone marrow cells (BMCs), and embryonic stem cells (ESCs) (14,17,38,44,52,53,76,78,89). Moreover, it has been shown in animal models that cellular implants can be genetically modified to further improve their effectiveness (7,8,12,22,23,36,46,48–50,55,71,74,83,90,91).
When cells are implanted into a lesioned spinal cord, they encounter a reactive cellular environment in which they need to survive and integrate (2,3,20,34,47,81,82). In experimental animals, long-term cell survival rates varied from less than 1% to 36%, depending on the cell type, the lesion type, and the moment and method of implantation (4,26,27,43,63,64,86). If the survival rates of transplanted cells could be improved, this could have a lasting positive impact on the repair- promoting effects of cellular implants. Research aimed at improving the long-term viability of implanted cells is important in view of the clinical potential of cell transplantation as a strategy to improve spinal cord repair. The feasibility of improving spinal cell implants has been highlighted by recent studies showing that a calpain inhibitor, polysialic acid, and the use of suspension matrices do have beneficial effects on the survival of donor SCs (25,49,63).
Most studies investigating the survival of cell implants are based on histological analysis. This type of analysis cannot be conducted without sacrificing groups of animals at different postlesion time points. The use of a noninvasive imaging method would have the advantage that cell transplants in individual animals can be monitored longitudinally. Recently, noninvasive bioluminescent imaging was successfully applied to investigate the survival of neural stem/progenitor cells following transplantation into the lesioned mouse spinal cord (58,79). However, it is not clear if bioluminescence can also be applied to monitor cell survival in the lesioned spinal cord of rats, the most widely used experimental animal in research on the repair of the spinal cord.
The present study had two aims. First, we wished to assess the feasibility of bioluminescence imaging as a noninvasive method to study cells after implantation in the lesioned rat spinal cord. Second, we monitored the survival of two proregenerative cell types, SCs and OECs, that have shown promise following transplantation in several animal models of spinal cord injury (5,6, 10,16,18,22,31,37,41,42,45,51,61,62,67–69,75,84,87). To this end, purified SCs and OECs were genetically modified with lentiviral vectors (LV) encoding luciferase-2 (Luc2) and green fluorescent protein (GFP) and implanted in a lesioned dorsal column of adult rats. The bioluminescent signal was monitored for more than 3 months. At two time points, 7 and 98 days postsurgery, the results obtained with noninvasive imaging were compared to standard histological assessment of the cellular implants.
Materials and Methods
Experimental Design
The overall experimental design of this study is shown in Figure 1. SCs and OECs were isolated and purified as described below. Both cell types were transduced simultaneously with LV-Luc2 and LV-GFP 2 weeks prior to transplantation. At t = 0, rats received a dorsal column lesion and concomitant implantation of either transduced OECs or SCs. At 1, 3, 7, 11, 16, 21, 42, 63, 84, and 98 days postsurgery the bioluminescent signals were measured. At day 7 and 98 days postsurgery, a set of randomly selected animals was sacrificed for analysis of GFP expression in the spinal cord. At t = 10, bioluminescence was measured in cultures of transduced OECs and SCs. Three weeks postsurgery, transduction efficiency and purity of OECs and SCs was assessed in vitro, as described below, to examine GFP expression stability.

Experimental design. Two weeks before the surgery, purified olfactory ensheathing cells (OECs) and Schwann cells (SCs) were thawed, and 24 h later, these cells were transduced with lentiviral-luciferase2 (LV-Luc2) and green fluorescent protein (LV-GFP). OECs and SCs were expanded, and after 2 weeks, they were implanted separately in rats in dorsal column lesions at thoracic level 8. At 1, 3, 7, 11, 16, 21, 42, 63, 84, and 98 days after surgery, bioluminescent signals were measured. At 7 and 98 days after surgery, rats of both groups were sacrificed for analysis of GFP expression in the spinal cords. Ten days postsurgery, in vitro bioluminescence of the transduced cultured OECs and SCs was established. Three weeks after surgery, transduction efficiency and purity of OECs and SCs was assessed in vitro.
Animals
A total of 52 inbred Fisher 344 rats (female, 180–200 g; Harlan, The Netherlands) were used in this experiment. Of these 52 animals, 28 were used to prepare the OEC and SC cultures and 24 rats underwent surgery and received SC (n = 12) or OEC (n = 12) implants. Two rats of the SC group did not survive the surgery. All rats were housed under standard conditions with ad libitum access to food and water. All experimental procedures were conducted in accordance with the guidelines of the local animal welfare committee.
Schwann Cells
SCs were prepared from sciatic nerves as described previously (19,54). In short, rats were anesthetized with 5% CO2 and decapitated. The sciatic nerves were dissected, and the epineurial sheaths were removed in Leibovitz-15 medium (L15; Invitrogen). Subsequently, the nerves were divided in segments of 1–2 mm and cultured on plastic in Dulbecco's modified Eagle's medium (DMEM; Invitrogen) supplemented with 10% fetal calf serum (FCS; Invitrogen) and 1% penicillin/streptomycin (PS; Invitrogen) (D-10S). For 5 consecutive weeks, the sciatic nerve explants were replated every 7 days to allow fibroblasts to migrate out of the explants. After 5 weeks, no fibroblasts could be observed and the explants were incubated overnight at 37°C in 0.05% collagenase (Invitrogen) in D-10S. The next day, the explants were spun down at 290 x g for 3 min, dissociated in D-10S supplemented with 2 μM forskolin (Sigma-Aldrich) and 20 μg/ml pituitary extract (PEX, Sigma-Aldrich), and plated in dishes coated for 2 h at 37°C with 20 μg/ml poly-l-lysine (PLL; Sigma-Aldrich). After 3 days of subsequent culturing, SCs were frozen in DMEM containing 30% FCS, PS, forskolin, PEX, and 10% dimethyl sulfoxide (DMSO; Sigma Aldrich) and stored in liquid nitrogen.
Olfactory Ensheathing Cells
Rats were anesthetized with 5% CO2 and decapitated. Olfactory bulbs were dissected and placed in L15 medium. Meninges were removed using forceps, and the glomerular and olfactory nerve layers (ONL) were isolated manually from the rest of the bulbs using a dissection microscope. The ONL was then incubated for 15 min in Ca2+- and Mg2+-free Hank's buffered saline solution (HBSS; Invitrogen) containing 0.125% trypsin (Invitrogen) at 37°C. Dissociation was stopped by adding Dulbecco's modified Eagle's/Hams F12 medium (DMEM/F12, Invitrogen), supplemented with 10% FCS and 1% PS (DF-10S). Subsequently, this solution was spun down at 290 x g for 3 min. The pellet was triturated in DF-10S and plated on PLL-coated dishes. After 1 week, p75-positive OECs were purified from the cultures by immunopanning as previously described (19,68). Briefly, 100-mm dishes (Sterilin) were incubated overnight at 4°C with 1:1,000 anti-mouse IgG, Fc-specific (Jackson ImmunoResearch) in 50 mM Tris (ph 9.5). Dishes were washed with phosphate-buffered saline pH 7.4 (PBS) and incubated overnight at 4°C with a p75-monoclonal antibody (a gift of Dr. P Wood) diluted 1:2.5 in PBS. After washing with PBS, dishes were blocked for 1 h at room temperature (RT) in 0.5% bovine serum albumin dissolved in PBS (ph 7.4), after which they were washed again twice with PBS and twice with DMEM/F12. Bound cells were detached by trypsinization and dissolved in a single cell suspension in DF-10S. Five milliliters of cell suspension was incubated on each coated dish for 5 min at 37°C. Dishes were carefully washed 10 times with DMEM/ F12 to remove nonadherent cells, after which the adherent cells were scraped off from the dish in DF-10S. The entire immunopanning procedure was repeated to diminish the percentage of contaminating cells. OECs were plated in DF-10S on PLL-coated dishes. After 2 days, medium was replaced by DF-10S supplemented by 2 μM forskolin and 20 μg/ml pituitary PEX for further culturing. After 4 days of subsequent culturing, OECs were frozen in DMEM/F12 containing 30% FCS, PS, forskolin, PEX, and 10% DMSO and stored in liquid nitrogen.
Lentiviral Vector Production
Self-inactivating lentiviral vectors were produced as described previously (15,24,56). The LV-Luc2 plasmid was constructed by replacing the GFP sequence from the transfer vector pRRLsin-PPthCMV-GFP-wpre by the Luc2 sequence of the pGL4.10 vector (Promega). Stocks were generated for LV-GFP and LV-Luc2 by a polyethylenimine (linear; Polysciences)-based cotransfection with three plasmids [the transfer GFP or Luc2 vector (25 μg), the vesicular stomatitis Indiana virus G (VSV-G) envelope protein vector pMD.G.2 (8.75 μg), and the viral core packaging construct pCMVdel-taR8.74 (16.25 μg)] into 11.25 × 10⁶ human embryonic kidney (HEK) 293T cells per 15-cm dish in Iscove's modified Dulbecco's medium (IMDM; Invitrogen) containing 10% FCS, 1% PS, and 1x Glutamax (Invitrogen). After 16 h of incubation at 37°C, the medium was replaced by IMDM containing 2% FCS, 1% PS, and 1x Glutamax. To obtain high titer LV stocks, the medium was harvested after 24 h, filtered through 0.20-μm pores and ultracentrifuged for 2.5 h at 20,000 rpm in a SW-28 rotor (Beckman Coulter B V, The Netherlands). The viral pellet was resuspended in PBS (ph 7.4), and the viral vector stocks were stored in aliquots at −80°C. To determine the number of transducing particles in the LV-GFP stock, HEK 293T cells were transduced, and after 48 h, the number of GFP-expressing cells was counted. LV-GFP stock titers were expressed as transducing units per milliliter (TU/ml). The LV-Luc2 stock was titered with a p24 antigen ELISA assay (HIV-1; PerkinElmer) together with the LV-GFP stock. The ratio between the TU/ml and the p24 content of the LV-GFP stock was used to calculate relative TU/ml titers for the LV-Luc2 stock.
Preparation of Schwann Cells and Olfactory Ensheathing Cells for Spinal Transplantation
SCs and OECs were thawed and plated separately on PLL-coated dishes. After 24 h, cells were harvested by trypsinization, counted, and plated in the appropriate densities. Cells were transduced after 24 h with LV-Luc2 at a multiplicity of infection (MOI) of 100, and medium was refreshed after 16 h. After 8 h, SCs and OECs were cotransduced with LV-GFP and LV-Luc2, both with an MOI of 50, and the media were refreshed 16 h later. Two weeks after transduction with the LV vectors, OECs and SCs were harvested by trypsinization, which was blocked with D-10S. Cells were then washed (DMEM/F12 for OECs and DMEM for SCs) and centrifuged three times (3 min at 290 x g). Pellets were resuspended in DMEM/F12 or DMEM, cells were counted, and the concentration was adjusted to 1.67 × 10⁵ cells/μl. Cells were kept at 4°C until needed.
Surgery and Cellular Implantation
Implantation of SCs or OECs into a dorsal column lesion was performed as follows. Rats were anesthetized with an intramuscular injection of 0.08 ml Hypnorm/100 g body weight (0.32 mg/ml fentanyl citrate plus 10 mg/ml fluanisone; Janssen Pharmaceutical, Beerse, Belgium) combined with an intramuscular injection of 0.08 ml Dormicum/100 g body weight (midazolam; Roche, Almere, the Netherlands). The dorsal column was lesioned at thoracic vertebra 8 (T8) as previously described (24). The rats were immobilized with a spinal cord fixator, after which a laminectomy at T 8 exposed the spinal cord. Subsequently, a bilateral lesion (1.2 mm deep) of the dorsal columns was made using a microknife (a 25-gauge needle with a file-sharpened 1.2 mm tip bended 45°). Immediately after the lesion was made, OECs or SCs were carefully injected as previously described (24,73). Each animal received three injections of a 1-μl cell suspension of either OECs or SCs containing 1.67 × 10⁵ cells/μl. One injection was placed directly in the lesion, one injection was 1 mm rostral from the lesion, and one injection was 1 mm caudal from the lesion. Injections were conducted at a depth of 0.8 mm from the dorsal surface of the spinal cord and consisted of pressure injections (syringe pump, Harvard Apparatus, Inc., Holliston, MA; injection speed, 0.2 μl/min). After infusions, muscle and skin were closed in separate layers, and animals received postoperative care including 3 days of subcutaneous injections with the analgesic Temgesic, 0.03 ml/100 g body weight (buprenorphine hydrochloride; Schering-Plough, Weesp, the Netherlands).
Bioluminescent Imaging
In Vitro Imaging
Genetically modified OECs and SCs that were not used for implantation in the spinal cords were cultured for 10 additional days to allow a comparison between bioluminescence in vitro and bioluminescence in vivo. Subsequently, OECs and SCs were plated separately in 24-well plates (Cellstar; Greiner Bio-one) in triplicate at densities of 104, 2 × 10⁴, 3 × 10⁴ cells/well in 0.5 ml culture medium. d-luciferin sodium salt (Synchem OHG) in PBS was added to each well to obtain a concentration of 0.3 mg/ml. Plates were imaged with an IVIS 200 imaging system (Caliper Life Sciences) in a field of 12.7 × 12.7 cm. Bioluminescence was measured for each plate in a consecutive series of images of 1 min. The binning factor was set at 8, and the lens aperture was set at 1. For each well, the region of interest (ROI) was set at 2.6 cm2, and total radiance was measured. The total flux was determined after approximately 5 min. The values of the three wells for each cell density were averaged.
In Vivo Imaging
Rats were anesthetized with 5% isoflurane, and anesthesia was maintained with 2.5%. Before each measurement, hair was removed around the lesioned area. Each injection contained 37.5 mg d-luciferin sodium salt in 0.4 ml PBS (luciferin). Luciferin was administered (IV) in one of the tail veins since a pilot experiment had shown that intraperitoneal luciferin injections resulted in relatively weak bioluminescent signals with a long half-life (unpublished data). Animals were then placed in prone position and were imaged in a field of 12.7 × 12.7 cm using an IVIS 200 imaging system. The binning factor was set at 8, and the lens aperture was set at 1. In the first 2 weeks postsurgery, some animals developed a subcutaneous buildup of wound fluids. These fluids were removed with a syringe before the bioluminescence measurements to avoid quenching of the signal. Luminescence was measured in consecutive series of images for 5–15 min immediately after injections at 1-min intervals. When luciferin tail vein injections were not successful, measurements were not used for further analysis for the 1, 3, and 7 day time points and repeated 24 h later for the 11, 16, 21, 42, 63, 84, and 98 day time points. When no clear signal was observed, luminescence was measured at 5-min intervals. Before each luminescent measurement, a grayscale photographic image was taken with autoexposure settings on which a pseudocolor representation of the luminescent signal was superimposed. For each measurement, the ROI was set at 2.6 cm2, and it was manually centered over the area with the highest luminescent signal. A background signal was established by measuring the luminescent signal before injections to correct subsequent bioluminescent measurements. The maximal radiance per ROI for each animal and each time point was used for further analysis. The time that passed between the first measurement after the luciferin injection and the moment that the maximal radiance was observed was averaged for each time point postsurgery for the SC and OEC groups and determined the delay in “peak of the bioluminescent signal.”
Immunochemistry
Immunocytochemistry
To determine cell purity and transduction efficiency, the percentage of p75 and GFP positive OECs and SCs was determined. OECs and SCs were plated separately on PLL-coated coverslips at a density of 104 cells per coverslip approximately 3 weeks postsurgery. Cells were fixed the next day with 4% paraformaldehyde (PFA) (ph 7.4). Subsequently, coverslips were washed three times with PBS and blocked for 30 min in Tris-buffered saline (TBS) (ph 7.4) containing 0.1% Triton-X-100 (Sigma Aldrich) and 2% FCS (blocking buffer-1). Then the coverslips were incubated with rabbit-anti-p75 (g323a; Promega) at a dilution of 1:500 in blocking buffer-1 at RT. After 2.5 h, coverslips were washed three times with TBS and incubated for 2.5 h with Alexa-Fluor594 donkey anti-rabbit (Invitrogen) at a dilution of 1:600 combined with Hoechst 33258 (Invitrogen) at a dilution of 1:1,000 in blocking buffer-1. The coverslips were then washed again with TBS and mounted. GFP expression was examined by epifluorescence. For each coverslip, the nuclei-, GFP-, and P75-positive cells were imaged at a 100-fold magnification in three randomly chosen areas, after which the nuclei-, GFP-, and P75-positive counts were averaged.
Immunohistochemistry
To examine OEC and SC survival after implantation, GFP expression was quantified at 2 time points. At 7 days (four SC and six OEC transplanted animals) and 98 days (six SC and six OEC transplanted animals) postsurgery, animals were deeply anesthetized using 0.11 ml Nembutal/100 g body weight (sodium pentobarbital; Sanofi Sante, Maassluis, The Netherlands) and subsequently perfused with 4% PFA in PBS. Spinal cords were postfixed overnight at 4°C, incubated in 250 mM ethylenediaminetetraacetic acid in PBS for 24 h at 4°C, and subsequently incubated in 30% sucrose in PBS for 24 h at 4°C, after which they were stored in Tissue-Tek (Sakura Finetek, The Netherlands) at −80°C. The spinal cords were then completely cut in 20-μm sections in saggital orientation. Every sixth section was used for quantification of GFP expression. Sections were postfixed for 10 min with 4% PFA in PBS, washed three times with TBS, blocked with TBS containing 0.3% Triton-X-100 and 5% FCS (blocking buffer-2), and stained overnight at 4°C with rabbit anti-GFP (AB3080; Chemicon) at a dilution of 1:50 in blocking buffer-2. Next, sections were washed three times with TBS and incubated with Alexa-Fluor488 donkey anti-rabbit (Invitrogen) at a dilution of 1:400. After washing three times with TBS, sections were mounted under coverslips in Mowiol [0.1 M Tris–HCl (pH 8.5), 25% Glycerol (Sigma), 10% Mowiol 4-88 Reagent (EMD Biosciences), 0.1% 1,4-diazabicyclo-[2.2.2]octane (Sigma)]. Fluorescence photographs were acquired at 50-fold magnification with a charge-coupled device camera (CoolSnap fx; Photometrics) with the same exposure times for all spinal cords. The measured intensities were linearly mapped into pixels with 255 representative gray values using Image-pro software. The background intensity was established, and a mask was formed for each image outlining the area with an intensity of at least three standard deviations above the background value. The total intensity of all pixels in this outlined area was determined for all sections that contained GFP-expressing cells. For absent or broken sections, the values were interpolated. The sum of the intensity values was then calculated for each animal.
Statistical Analysis
Statistical analysis was conducted with SPSS Statistics 17.0. The average bioluminescent signals of the SC and OEC groups were compared per time point using the Student's t test followed by a Bonferroni correction. The average bioluminescent signal of the SC and OEC groups over all time points was analyzed statistically using a two-way ANOVA. The average bioluminescent signals on the different time points were compared per group using a one-way ANOVA followed by the Games–Howell post hoc test. Relationship between bioluminescence and fluorescence was tested using two-tailed Pearson correlation. Significance was set at p < 0.05.
Results
In Vitro Characterization of Transduced Schwann Cells and Olfactory Ensheathing Cells
To monitor bioluminescence and GFP expression after implantation of SCs and OECs in the lesioned dorsal column of adult rats, cells were transduced with LV vectors encoding GFP or Luc2 driven by a CMV promoter. The transduction efficiency and purity of the SCs and OECs was determined by a comparison of GFP (Fig. 2A, C) and p75 (Fig. 2B, D) expression with the nuclear marker Hoechst. GFP expression was detected in 99.6% of the SCs and 99.5% of the OECs. Expression of p75 was detected in 100% of SCs and 99.7% of OECs. To determine the relationship between the bioluminescent signal and the number of SCs or OECs, cells were plated at 104, 2 × 10⁴, and 3 × 10⁴ cells per well and bioluminescence was measured the next day. Figure 2E shows that there is a linear relationship between the number of SCs and OECs and the measured bioluminescent signal. SCs have a 3.2-fold higher bioluminescent signal than OECs, which is most likely the result of differences in cellular metabolism between the two cell types.

Characterization of SC and OEC cultures. Cultures were stained for GFP (A, C) and p75 (B, D) to determine the transduction efficiency and purity respectively. GFP expression was detected in 99.6% of the SCs and 99.5% of the OECs. Expression of p75 was detected in 100% of SCs and 99.7% of OECs. Scale bar: 100 μm. There is a linear relationship between the number of SCs and OECs and the measured bioluminescent signal (E). The error indicates a calculated standard error of the mean (SEM). SCs show a 3.2-fold higher bioluminescent signal than OECs (E). This is most likely the result of differences in cellular metabolism between SCs and OECs.
In Vivo Bioluminescent Imaging of Implanted SCs and OECs in the Lesioned Rat Spinal Cord
To examine the bioluminescent signals of the implanted Luc2-expressing SCs and OECs in the lesioned dorsal column of adult rats, the bioluminescent signals were measured at 1, 3, 7, 11, 16, 21, 42, 63, 84, and 98 days after implantation. For the 1, 3, and 7 day time points, the groups consisted of 10 SC and 12 OEC implanted animals. At 7 days postsurgery, 10 animals (n = 4 for the SC group and n = 6 for the OEC group) were randomly selected and perfused to perform a histological analysis of the cell transplants. Therefore, the bioluminescent signal was measured in six animals per group at the 11, 16, 21, 42, 63, 84, and 98 day time points. Figure 3A, B shows pseudocolor representations of the bioluminescent signals superimposed on grayscale photographic images of two representative animals for both the SC and OEC groups between 1 and 21 days. Figure 3C shows that, on average, the strongest bioluminescent signal was detected at 3 days postsurgery for both the SC and OEC groups.
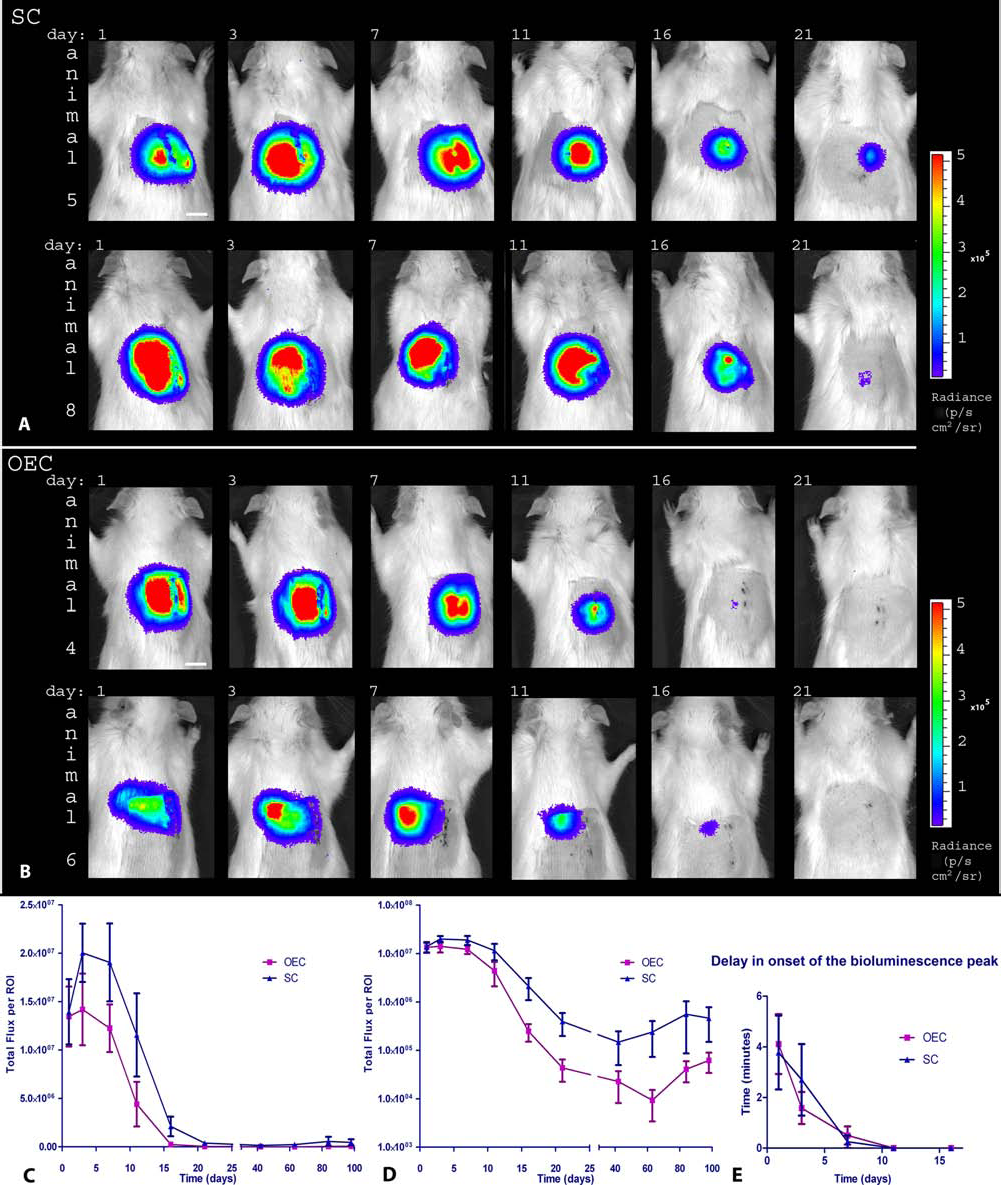
Bioluminescent signal of implanted SCs and OECs in the lesioned dorsal column of adult rats. (A, B) Pseudocolor representation of luminescent signals superimposed on grayscale photographic images of two SC and OEC implanted rats over a period of 3 weeks. Settings are consistent for all images. Scale bar: 1 cm. (C) Bioluminescent measurements obtained from all rats and averaged per time point for both the SC and OEC group at a linear scale. The error for each time point indicates a calculated standard error of the mean (SEM). Bioluminescence is expressed in total flux per ROI (photons/s in each pixel integrated over the ROI area × 4π). A reduction of the signal in the first 3 weeks can be observed for both the SC and OEC groups. The average bioluminescent signal at 7 days was significantly different from the signal at 21, 42, 63, 84, and 98 days (p < 0.05) for the SC group and from 16, 21, 4 2, 63, 84, and 98 days (p < 0.05) for the OEC group. The bioluminescent signal of the SC group was not significantly different from the OEC group when the group averages were compared per time point. Statistical analysis by two-way ANOVA of the bioluminescence of the SC and OEC groups over all time points showed that there is a significant difference in overall average bioluminescent signal between the SC and OEC implanted animals (p < 0.05), as illustrated by (D) (bioluminescent signal is presented in a logarithmic scale). After 3 weeks, the bioluminescence of three of the six remaining animals of the SC group and four of the six of the OEC group was not discernable from the background. For the other animals, the signal remained relatively stable between 42 and 98 days, except for one animal of the OEC group that had no signal at 42 and 63 days but had a clear signal at 84 and 98 days. Bioluminescent measurements that were not discernable from background levels were included as zero values in all calculations. (E) Delay in the onset of the peak of the bioluminescent signal after injection of luciferin. The delay is presented in minutes after the first measurement. There is an initial delay of approximately 4 min for both the SC and OEC groups at 1 day postsurgery. At 11 days postsurgery, there is no delay in the peak of the bioluminescent signals for either group.
The bioluminescent signal of the SC group was not significantly different from the OEC group when the group averages were compared per time point. However, statistical analysis by two-way ANOVA of the average bioluminescent signal of the SC and OEC groups over all the different time points showed that there is a significant difference in overall average bioluminescent signal between the SC and OEC implanted animals (p < 0.05), as is illustrated by Figure 3D. From 7 days postsurgery, a progressive decline of bioluminescent signal was observed, which stabilized at 21 days. The average bioluminescent signal at 7 days was significantly different from the signal at 21, 42, 63, 84, and 98 days (p < 0.05) for the SC group and from 16, 21, 42, 63, 84, and 98 days (p < 0.05) for the OEC group.
At 42 days, the bioluminescent signal of three animals in the SC and four animals in the OEC group was not different from background. The other three animals of the SC group and two animals of the OEC group had bioluminescent signals above background until 98 days postsurgery. One of the animals of the OEC group showed no bioluminescent signal at 42 and 63 days postsurgery caused by problems experienced with the tail vein injections of the luciferin but had a clear signal again at 84 and 98 days. The average time that passed before the peak of the bioluminescent signal was observed after the luciferin injection was delayed at 1, 3, and 7 days postsurgery compared to the other time points, as shown in Figure 3E. From the 11 day time point onwards, there was no delay in the peak of the bioluminescent signals for both the SC and OEC groups. No significant difference in the delay of the peak of luminescence was observed between the SC and OEC groups.
Examination of the Relationship Between In Vivo Bioluminescence and Cell Survival Based on Histological GFP Expression Analysis
We wished to determine the relationship between the bioluminescent signal derived from a cell implant in a lesioned rat spinal cord and the amount of cells present in that spinal cord following transplantation based on the GFP signal. A group of animals was sacrificed at two postsurgery time points, 7 days (four SC and six OEC rats) and 98 days (six SC and six OEC rats) immediately after in vivo bioluminescent measurements. Figure 4A shows a pseudocolor representation of the bioluminescent signal superimposed on grayscale photographic images of these measurements for all animals. To identify the implanted cells by histological analysis, the spinal cords of all animals were dissected and processed to quantify the signal intensity of GFP expression. Representative images of the spinal cords of SC and OEC implanted rats at 7 and 98 days postsurgery are shown in Figure 4B. There is a linear relationship between the measured bioluminescence in vivo and GFP expression measured in tissue sections for both SC (r = 0.97, p < 0.001) and OEC (r = 0.87, p < 0.001) implanted animals, as shown in Figure 4C. The spread of the cells in and around the lesion site was variable in both the SC and OEC groups. However, no relationship was observed between the location of the cells with respect to the lesion epicenter and the strength of the bioluminescent signal (data not shown). At 98 days compared to 7 days postsurgery, the average bioluminescent signals of SC and OEC animals were 2.2% and 0.6%, respectively, and the average GFP intensity measurements were 0.44% and 0.31%, respectively. At the 98 day time point, there is no significant correlation between the measured bioluminescence in vivo and the GFP expression for both SC and OEC implanted animals, which is most likely the result of the low background-to-noise ratio for both the bioluminescent and GFP signals (Fig. 4C).
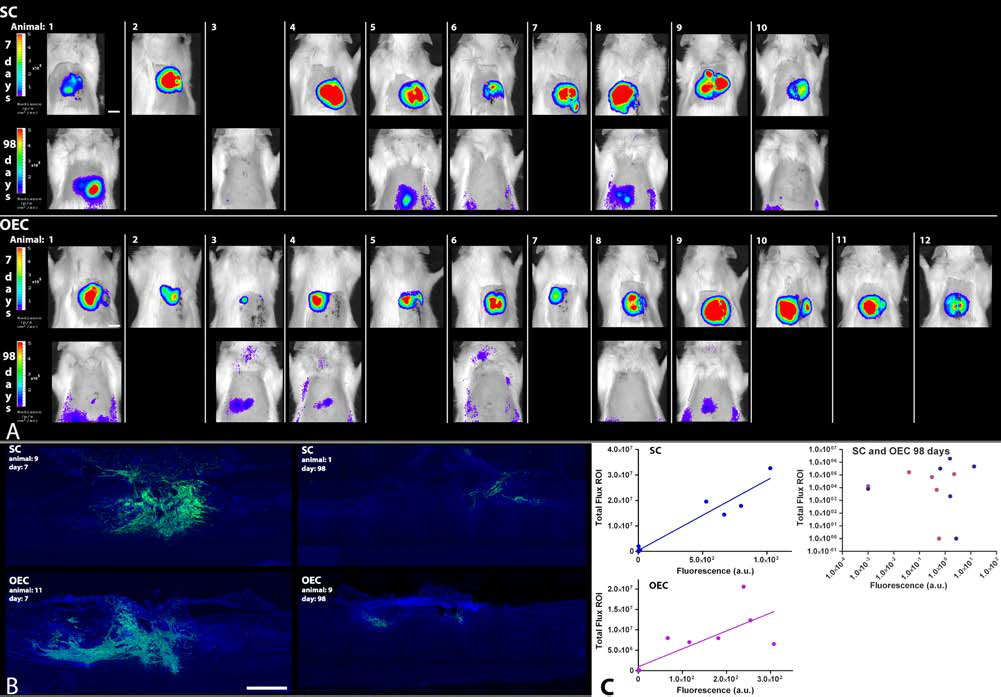
Bioluminescence and GFP expression of SCs and OECs at 7 and 98 days in the spinal cord. (A) Pseudocolor representation of the luminescent signal of all bioluminescent measurements of animals implanted with SCs or OECs at 7 and 98 days postsurgery superimposed on a grayscale photographic image. Settings are consistent for all images except for all 98 day images in which the threshold of the pseudocolor representation is uniformly lowered for presentation purposes of low bioluminescent signals. Scale bar: 1 cm. (B) GFP expression in green and nuclear staining in blue of spinal cords of rats with SC or OEC implants at 7 or 98 days postsurgery. There is a clear loss of GFP expression at 98 days compared to 7 days postsurgery for both SC and OEC implanted animals. For presentation purposes, the images of the spinal cords of the 98 day SC and OEC animals were enhanced compared to the spinal cords of the 7 day animals to allow visualization of the GFP signal. Scale bar: 1 mm. (C) Relationship between the measured bioluminescence in vivo of each animal and the total GFP intensity in the spinal cord of the same animals as measured by histological analysis. Bioluminescence is expressed in total flux per ROI (photons/s in each pixel integrated over the ROI area × 4π). Total GFP intensity is expressed in arbitrary units. The presented data consists of both the 7 and 98 day postsurgery time point. Overall, there is a significant correlation between the in vivo bioluminescent signal and GFP expression as measured in tissue sections for both the SC (r = 0.97, p < 0.001) and the OEC (r = 0.87, p < 0.001) implanted animals. At 98 days compared to 7 days postsurgery, the average bioluminescent signals of SC and OEC implanted animals were 2.2% and 0.6%, respectively, and the average GFP intensity measurements were 0.44% and 0.31%, respectively. At the 98 day time point, there is no correlation between the bioluminescent signal and the measured GFP intensity for both the SC and the OEC implanted animals. This is most likely the result of the low background-to-noise ratio for both the bioluminescent and the GFP signals.
Discussion
In vivo bioluminescence-based noninvasive imaging has been used to monitor implanted neural stem/progenitor cells in the lesioned spinal cord of mice (58,79). This methodology also proved to be useful to monitor tumors, several types of cell implants in vertebral discs, and implanted multipotent stromal cells that enhance bone formation in the rat spine (1,11,21,40). We now show that it is possible to use bioluminescence to noninvasively and longitudinally monitor grafted SCs and OECs in the lesioned rat spinal cord. In the first week postimplantation, we observed a relatively high and stable bioluminescent signal. The signal declined progressively between 7 and 21 days. A comparative analysis of the bioluminescent signal intensity and GFP signal of labeled SCs or OECs using standard histology indicated a linear relationship between the bioluminescence and GFP signals for both the SC and OEC groups. These results demonstrate that bioluminescence imaging is a valuable and relatively easy strategy for longitudinal studies on the fate of proregenerative cell implants in spinal cord-lesioned rats.
In the first week postsurgery, we observed a relatively high and stable bioluminescent signal, followed by a progressive decline in the second and third weeks. After the third week, the bioluminescent signal stabilized and remained relatively low throughout the following months. At least three variables can be contributing factors to this bioluminescence expression profile: (i) the availability of luciferin to the implanted cells, (ii) the activity of the CMV promoter that drives luciferase expression, and (iii) the survival of the implanted cells.
Luciferin was injected in the tail vein and is distributed through the body via the circulation. After a spinal cord lesion, blood vessels are damaged at the site of the lesion. The blood vessels in and around the injury site are largely restored by angiogenesis in the first 2 weeks after the lesion (32,57,59,65). Interestingly, the delay in the onset of the peak of the bioluminescent signal that we observed during the first week gradually disappeared and was no longer detectable at 11 days after transplantation. This corresponded well with the revascularization in and around the lesion and suggests that angiogenesis facilitates the uptake of luciferin by the transplanted cells. Luciferin is normally cleared rapidly from the body; thus, it is possible that a delay in the availability of luciferin reduces the reproducibility and diminishes the strength of the signal transmitted by the transplanted cells, as long as the blood flow is not restored. The importance of the availability of luciferin is clearly illustrated by the observed difference between the fast and high bioluminescent signal observed after an IV injection compared to the relatively stable and low bioluminescent signal after an IP injection (35). At 7 days after implantation, however, the bioluminescent signal correlated well with the GFP signal of the cells as measured in histological sections. This suggests that at this post-transplantation time point bioluminescence imaging is a reliable way to monitor SCs or OECs in a spinal cord lesion.
The observed decrease of the bioluminescent signal between 7 and 21 days postsurgery most likely reflects a gradual progressive loss of SCs and OECs and is not the result of a decline in CMV-driven luciferase signal. The CMV promoter that drives the luciferase is widely used to acquire long-term transgene expression in studies on transplanted SCs or OECs transduced with a lentiviral vector (22,26,28,29,73). Furthermore, CMV promoter activity has been validated in LV-GFP-transduced SCs after implantation in the lesioned rat spinal cord by showing a correlation between GFP expression and the number of incorporated GFP-DNA copies (26). This study reported that an observed decline in SC number was due to cell death and not to a downregulation of CMV-driven transgene product expression. The studies that used in vivo bioluminescence imaging to monitor neural stem/progenitor cells in the lesioned mouse spinal cord also showed a linear relationship between the number of implanted cells and the bioluminescent signal (58,79), and in line with our observations, these two studies also reported a strong decline in the luminescent signal within the first weeks after implantation.
After 21 days, the bioluminescent signal of the SC and OEC groups had decreased to 2% and 0.3%, respectively, and remained relatively stable up to 98 days. This suggests that after 3 weeks a small proportion of the cells stably integrate into the spinal cord. Interestingly, it has been shown that after a contusion injury of the rat spinal cord combined with a delayed implantation of SCs and OECs there is also a loss of cells up to 3 weeks after the implantation followed by a stabilization of cell numbers (64). Several studies have shown that transplanted SCs or OECs do survive for extended periods after a complete or partial transection of the thoracic rat spinal cord; however, hardly any quantitative information on cell survival is available on direct transplantation in spinal transection models (13,30,39,68,72,73). Quantitative studies on the survival of SCs and OECs after delayed transplantation in a contusion injury show significant cell death. For SCs, survival rates were reported of approximately 22.4%, 15%, 17.1%, and 14% at 3, 4, 11, and 12 weeks, respectively (4,26,63,64), while for OECs, survival rates were 3.1%, 2.3%, and less than 1% at 3, 11, and 13 weeks, respectively (4,43,64). However, differences in the applied injury paradigms, the timing of donor cell implantation, origin of the donor cells, and purification methods make it difficult to compare the results of these studies to the results of our study.
From 42 days onward the bioluminescent signal of approximately half of the animals in both groups was not discernable from background while histological analysis at 98 days showed GFP expression in five of six animals for both the SCs and the OECs group. Although there is a significant correlation between the in vivo bioluminescent signal and the GFP signal obtained by histological analysis when both time points are combined, our results indicate that a higher bioluminescent signal than was measured at 98 days is necessary for an accurate representation of the number of implanted cells at this time point. It has been shown in mice that opening of the skin prior to bioluminescence imaging resulted in an improvement of the detection limit from 1,000 to 100 implanted cells in the spinal cord (79). Novel versions of the luciferin protein and charge-coupled device (CCD) cameras with improved sensitivity will allow a more reliable detection of even smaller numbers of transplanted cells in the future.
Conclusion
We have successfully used bioluminescence to monitor the survival of SCs and OECs following transplantation in a transected rat spinal cord for an extended period of time. In the coming years, the use of in vivo bioluminescence imaging will facilitate the analysis of the survival of implanted cells in other lesion models such as contusion injuries and the evaluation of the effectiveness of treatments that have the potential to improve the survival of transplanted cells in the lesioned rat spinal cord in a noninvasive and longitudinal manner.
Footnotes
Acknowledgments
This work received financial support from the Netherlands Ministry of Economic Affairs (SenterNovem Grant ISO52022). The authors thank Dr. Marco Breuer and Dr. Olaf van Tellingen for their support and facilitation of the bioluminescence pilot experiment (data not shown) at the Netherlands Cancer Institute and Dr. Bas Blits and Dr. Harald Petry of Amsterdam Molecular Therapeutics for facilitation of the IVIS 200 imaging system. We also thank Prof. Alan Harvey (Perth) and Dr. Martin Oudega (Pittsburgh) for their valuable advice and suggestions for the manuscript. Authors declare no conflicts of interest.