
Abstract
Stem cell transplantation is a promising therapeutic approach in neurodegenerative diseases. Studying graft survival and development has important implications for the further development of experimental and clinical transplantation protocols. Cellular elements in neural transplants are sometimes difficult to identify. The existing labeling methods cannot reliably provide stably labeled cells that can be detected in long-term experiments. Transgenic (tg) Lewis rats ubiquitously expressing green fluorescent protein (GFP) provide an ideal donor source. The aim of this project was to investigate the potential of GFP-tg Lewis rats to serve as donor tissue for neural stem cell transplantation. Ventral mesencephalon (VM) GFP-tg E14.5-derived cells were compared to wild-type (wt) in vitro and in vivo. Firstly, cells from GFP and non-GFP VM tissue were compared with regard to their proliferation and response towards 6-OHDA-toxicity in culture. Secondly, 6-OHDA-lesioned hemiparkinsonian Sprague–Dawley/Crl:CD(SD) rats received intrastriatal grafts derived from VM of E14.5 GFP-tg rats. Due to the fact that donor and recipient belong to two different rat strains, we focused on graft survival in correlation with immunosuppression and graft GFP and tyrosine hydroxylase (TH) expression. In summary, in vitro tg cells exhibited 98% GFP expression and did not differ from wt cells in any of the measured parameters. In vivo, all experimental groups showed a significant compensation in rotation behavior after transplantation. Furthermore, there was no difference on rotation behavior or graft morphology and survival pattern as well as GFP expression between immunosuppressed and nonimmunosuppressed animals. The GFP-positive population of the graft was composed of 13.3% GFAP-positive, 56.1% NeuN-positive, and 1.9% TH-positive cells. Analysis of graft subpopulations manifested that 70.6% of GFAP-positive, 86.9% of NeuN-positive, and 80.1% of TH-positive cells coexpressed GFP. In conclusion, our data show that the Lewis GFP-tg rats serve as an excellent cell source for studying primary neural precursor cells in the transplantation paradigm.
Keywords
Introduction
Transplantation of embryonic progenitor cells has been widely used for restorative therapies in models for neurodegenerative disorders. The follow-up of grafted cells plays a fundamental role not only in studying the long-term function of the transplanted tissue but also to confirm and study graft development, origin of functional cells, host–graft interactions, immunoreaction in response to the allogeneic cells, and cell migration. Furthermore, there are grafting procedures that require a tool to discriminate cografts originating from different cell types (46). In case of xenografting, it is possible to identify grafted cells by the expression and detection of donor-specific antigens (28,44). In auto- or homografts, however, this method is not available, which increases the requirements to positively identify the transplant. An alternative approach is sex-specific antigen detection in donor-derived cells by chromosome fluorescence in situ hybridization (6), which is inapplicable if donor and recipient belong to the same sex. Others have used nonviral labeling techniques (electroporation, lipofection, nucleofection) that are not sufficiently robust or long-lasting to be detected at the study end points and with high toxicity effects (8). Chemical markers such as bisbenzimide and PKH26 have been used to label Schwann cells delivered to peripheral nerve injuries, but their usefulness is limited to the short term and may in fact affect the viability and phenotype of transplanted cells (30). Furthermore, donor diving cells can be labeled by thymidine analogs but often grafted-derived thymidine analogs are incorporated into the host proliferating cells, making it difficult to distinguish donor from recipient cells (5). Viral labeling with either lacZ or fluorescent proteins such as green fluorescent protein (GFP) is increasingly popular and appears to be a relatively long-lasting method but contamination problems (14), cytotoxic effects (52), and special lab arrangement and techniques limit their wide use.
Transgenic (tg) animals constitutively expressing innocuous reporter genes have recently become available and offer an opportunity for research in the context of cell-based therapies and cellular transplantation. For example, tg rodents expressing GFP represent an ideal model since the GFP expression simplifies genotyping and can be visualized directly or by immunohistochemical enhancement. This approach has already been used in GFP-expressing mice (35), where the tissue can be transplanted as xenografts in rat disease models. However, given that most preclinical transplantation studies take place using rats, rat-derived allografts are highly desirable. Several GFP-expressing rats have been generated (9,20,21–24,29,39,45,49). Some of these animals did not express GFP ubiquitously or marker expression was weak, or it was apparent at distinct developmental stages only. An inbred Lewis GFP-tg rat strain established by Inoue et al. was chosen since it has shown to express GFP ubiquitously in neonatal as well as in the adult animals (22). The remaining question is whether the GFP expression is stable through the early developmental stages and whether it is feasible to use these animals as tissue donor in the field of neurotransplantation.
In this study, ventral mesencephalic (VM) cells derived from Lewis GFP-tg and wild-type (wt) embryos were studied and compared in vitro with respect to their dopamine (DA) profile, survival in culture, sensitivity towards 6-hydroxydopamine (6-OHDA) in vitro, and GFP expression stability over long-term culture periods. Furthermore, VM cells derived from Lewis GFP-tg were transplanted in the 6-OHDA- induced unilateral medial forebrain bundle (MFB) lesion rat model of Parkinson's disease (PD) (7,10,40,47). At several time points, the GFP expression and graft survival were evaluated to determine the immunological potential of GFP or the allograft. Additionally, we analyzed the graft composition and development after transplantation.
Materials and Methods
Animals
Inbred Lewis GFP-tg rats, kindly provided by Prof. Eiji Kobayashi, Center for Development of Advanced Medical Technology, Jichi Medical University, Tochigi, Japan, established by Inoue et al., express GFP under the control of a cytomegalovirus (CMV)/β-actin promoter (CAG promoter) (22). Lewis wt rats purchased from Charles River Laboratories were bred with Lewis GFP-tg heterozygote animals to maintain the strain. Tg and wt animals have 1:1 ratio in the progeny. GFP-tg embryos were distinguished from their wt littermates under fluorescence microscope (22). Female albino inbred Sprague–Dawley/Crl:CD(SD) (SD) rats were used as host animals for the transplantation experiments. All SD animals used in this study were purchased from Charles River.
All animals were maintained in constant 12-h light/ dark cycle, temperature of 21 ± 1°C, 50–60% relative humidity and were housed in groups of four to six in standard cages with ad libitum access to drinking water and standard food pellets (19). All animal procedures were performed according to guidelines of the German Council on Animal Care, and all protocols were approved by the University of Freiburg Animal Care Committee.
Dissection and Single-Cell Suspension Preparation
Embryonic day 12.5 (E12) [crown rump length (CRL) = 5.0–6.0 mm] and E14.5 (CRL = 10.0–11.0 mm) rat embryos derived from 18 h overnight breeding (counting the next morning as E0) were used to prepare single-cell suspensions of VM from GFP-tg as well as wt animals. Single-cell suspensions of VM from Lewis GFP-tg and wt E12.5 and E14.5 embryos were used for the in vitro part of the study (cell culture experiments), whereas for the in vivo part (transplantation) only E14.5 tg cells were grafted.
Pooled VM from tg or wt E12.5 or E14.5 embryos were microscopically dissected as previously described (13,38), and a single-cell suspension was prepared according to a modified protocol (34) of the standard cell suspension technique based on Bjorklund et al. (3). In brief, VM specimens were incubated in 0.1% trypsin (Worthington) and 0.05% DNase (Sigma) in DMEM (Gibco-Invitrogen) at 37°C for 20 min, rinsed and mechanically triturated with fire-polished pipette tips. The cell concentration in the suspension was adjusted as required. An average of 250,000 cells was obtained from one VM.
Size of the Embryos at Different Developmental Stage
Female SD rats (3–6 months old) were bred for 3 h (between 17:00 and 20:00) with male SD rats (5–7 months old) in 2:1 ratio counting the next morning as E0 (51). Alternative, female wt Lewis rats were bred with Lewis GFP-tg male rats to obtain Lewis GFP-tg and wt embryos. In order to ascertain the pregnancy of the rats, they were palpated 11 days after breeding, and embryos were collected at days E11.5, E12.5, E13.5, E14.5, E15.5, and E16.5. Lewis GFP-tg embryos were distinguished from their wt littermates under fluorescent microscopy (22). The size (CRL) of the embryos was measured under a light dissection microscope.
GFP-tg Cells Flow Cytometry
Flow cytometric analysis was performed to quantify the level of GFP expression and the viability of VM cells. GFP-tg E14.5 VM single-cell suspension was diluted to 20 million cells/ml in PBS (Gibco-Invitrogen) supplemented with 2% fetal calf serum (FCS, Gibco-Invitrogen). In total, 10 × 106 cells were processed for analysis with the MoFlo high-speed cell sorter from Dako.
In Vitro Experiments
Cell Culture and 6-OHDA Neurotoxicity
Lewis GFP-tg and wt E14.5 VM single-cell suspensions were used in parallel. For each experiment, only one tg and one wt cell suspensions were prepared. Cells were plated on day 0 (d0) and fixed on d4, d8, and d10, respectively. In the neurotoxicity experiment, cells were incubated for 12 or 24 h with 10, 15, 30, or 60 μM 6-OHDA on d4 after the initiation of cell culture. Two days after the end of 6-OHDA incubation, cells were fixed (d7) (Fig. 1A). All cell culture experiments were repeated in two independent experimental series and in quadruplicates as previously described (16).

Schematic diagram of the experimental design. (A) In vitro experiments were performed with transgenic (tg) and wild-type (wt) E14.5 venral mesencephalon (VM)-derived single-cell suspensions. The top of the diagram (black boxes) illustrates maintenance of cells in culture and fixation dates. The bottom (gray boxes) illustrates 6-hydroxydopamine (6-OHDA) neurotoxicity treatment on cell culture and fixation dates. (B) In vivo experiments were performed with 39 unilateral 6-OHDA medial forebrain bundle (MFB) lesion rats that were grafted stereotactically with E14.5 VM single-cell suspension. Lesion and graft effects were evaluated by drug-induced rotations at 7 weeks postlesion and at 2, 4, 8, 10, and 15 weeks posttransplantation, respectively.
E14.5 VM Lewis GFP-tg and wt single-cell suspensions were plated separately at a density of 130,000 cells/ well using 0.01% poly-l-ornithine (Sigma) precoated 48-well plates. Cells were plated initially overnight in Neurobasal medium (Gibco-Invitrogen) supplemented with 10% FCS, 2% B27 supplement (Gibco-Invitrogen), 1% Glutamax (Gibco-Invitrogen), and 1% penicillin–streptomycin–ampicillin (PSA, Gibco-Invitrogen) and cultured at 37°C in 5% CO2 and 20% O2 in a fully humidified atmosphere. On the next day and onwards, the same medium devoid FCS was used, and cells were cultured for 4, 8, and 10 days before they were fixed with 4% ice-cold paraformaldehyde (Merck) (PFA) in PBS for 45 min.
Cell Culture Proliferation
Lewis E12.5 VM GFP-tg and wt single-cell suspensions were cultured as spheres in suspension flasks containing expansion medium consisting of DMEM and F12 (Gibco-Invitrogen) 2:1 supplemented with 2% B27 supplement, 1% PSA, 20 ng/ml human recombinant epidermal growth factor (hrEGF; R&D Systems), 20 ng/ml basic fibroblast growth factor (bFGF; R&D Systems), and 10 μg/ml heparin (Sigma). The medium was changed once per week. After 21 days of expansion without any passaging, spheres were processed enzymatically with TrypsinLikeEnzyme express (Gibco-Invitrogen). The proliferation rate of tg and wt cell suspensions was determined.
Immunocytochemistry
Fixed cells were processed according to the immunocytochemistry protocol as previously described (16) with the following primary antibodies: polyclonal rabbit anti β-III-tubulin (PRB-435P, 1:600, Covance); monoclonal mouse anti-tyrosine hydroxylase (TH) (T1299, 1:2,500, Sigma); mouse anti-GFP (A-11120, 1:500, Invitrogen) and rabbit anti-GFP (A-11122, 1:500, Invitrogen); and the following secondary antibodies goat anti-mouse, A-11004, Alexa Fluor® 568; goat anti-rabbit, A-11034, Alexa Fluor® 488; goat anti-mouse, A-11024, Alexa Fluor® 488; goat anti-rabbit, A-11036, Alexa Fluor® 568 (1:150 Invitrogen).
Cell Counting
The numbers of DAPI and β-III- tubulin-, TH-, and GFP-positive cells were counted by fluorescent microscopy as previously described (16). Total cell numbers (DAPI) and β-III-tubulin- and TH-positive cells per well were calculated as well as the percentage of β-III-tubulin- and TH-positive cells per total cell number.
In Vivo Experiments
Unilateral 6-OHDA MFB Lesion
The animals were anaesthetized with Ketamine (100 mg/kg, Essex) and Rompun (5 mg/kg, Bayer) and were stereotactically injected with 6-OHDA hydrochloride into the right MFB using 10 μl Hamilton syringes with a 26-gauge steel cannula. The following coordinates were used (first/second track, in millimeter with reference to bregma and dura level): toothbar (TB) +3.4/-2.3; anterior/posterior (AP) −4.0/−4.4; lateral (L) −0.8/−1.2; dorsal/ventral (DV) −8.0/−7.8. Every animal received the amount of 5.5 μl of 17.5 μM 6-OHDA solution with an injection rate of 2 μl/min. The cannula was held in place for 3 min before retraction. The 6-OHDA solution was kept in dark and on ice to prevent oxidation.
Transplantation Surgery
Thirty-nine unilateral 6-OHDA MFB lesion rats were grafted stereotactically with 4 μl of E14.5 VM single-cell suspension at a concentration of 120,000 cells/μl diluted in 0.05% DNase in DMEM using a glass capillary (32,33). Every host animal received a graft into the striatum of four deposits in two tracks, using the following coordinates (in mm, with reference to bregma and dura level): AP +1.0; L −2.5 and −3.3; DV −5.0 and −4.0.
Transplanted animals were divided into two groups, one with (total n = 20) and one without immunosuppression (total n = 19). The animals in the immunosuppression group received cyclosporine daily by intraperitoneal injections (Sandimmun®, Novartis) (10 mg/kg bodyweight/ day). Immunosuppression was combined with prophylactic oral administration of sulfadoxine and trimethoprim (24% Borgal®, 1:250, Boehringer Ingelheim) in the drinking water. Animals from each group (with and without immunosuppression) were sacrificed after 2 (TX2 group), 4 (TX4 group), 10 (TX10 group), and 15 (TX15 group) weeks after transplantation (for more details, see Fig. 1B).
Drug-Induced Rotations
Lesion and transplantation effects were evaluated by drug-induced rotations (48). All groups were tested 7 weeks after lesion as well as 2 (TX2 group), 4 (TX4 group), 10 (TX10 group), and 15 (TX15 group) weeks after transplantation. Apomorphine solution (Sigma) was injected subcutaneously in a dose of 0.05 mg/kg bodyweight, and the rotational behavior was recorded for 40 min. Amphetamine solution (Sigma) was injected intraperitoneally in a dose of 2.5 mg/kg bodyweight, and the rotational behavior was recorded for 90 min as previously described (19).
Immunohistochemistry and Morphological Graft Analysis
Animals were terminally anesthetized with Ketamine/Rompun, transcardially perfused, with ice-cold 4% PFA. Removed brains were postfixed by immersion in 4% PFA for 2 h, transferred to 30% sucrose solution in PBS (19). Coronal sections of 40 μm thicknesses were cut on a microtome (Leica, Nussloch) and collected in four series in 1x PBS. Free floating sections were stained using the streptavidin–biotin method (Dako) with 3,3′-diaminobenzidine as chromogen for TH (T1299, 1:2,000, Sigma). The sections were mounted on slides, dehydrated, cover slipped, and subjected to image analysis estimating the volume of the graft, the TH-positive cell numbers in the graft, and the DA reinnervation of the lesioned striatum. Volumetric analysis of the graft was carried out by measuring the area of the TH-positive stained graft in the DA-depleted striatum on each consecutive section throughout the anterior–posterior axis of the dorsal striatum using an Olympus Ax-70 microscope with image analysis software (“Analysis,” Soft Imaging Systems). The volume of the graft was calculated by taking into account the sum of all the areas and correcting for section thickness and sample frequency [Volume (mm3) = Sum of areas (mm2) × 40 μm × 4] (26).
The total number of surviving grafted TH-positive cells per transplant was carried out using a Leica DMRB microscope with the Stereo Investigator software. TH-positive cells were counted on all sections in the AP axis of the VM grafts. The total number of surviving grafted TH-positive cells per transplant was estimated using the Abercrombie formula (1): P = M / (D + M) * A * N, where P = total cell number; M = thickness of sections, here 40 μm; D = diameter of counted cells, here 1.04 μm; A = number of counted cells; and N = number of cut series, here 4).
The DA innervation of the lesioned striatum was estimated based on calculation of the optical density (OD) of the grafts using the Olympus Ax-70 microscope and the “Analysis” software (Soft Imaging Systems). At four coordinates within the striatum with regard to the bregma (AP +1.7, +1.0, +0.5, −0.4), the TH fiber density expressed as a relative percentage of the grafted striatum compared to the intact striatum was calculated by assessing the difference in OD between the graft and the corpus callosum (internal control), and the intact striatum and the corpus callosum and expressed as a proportion: (Graft OD - Corpus Callosum OD/Intact striatum OD - Corpus Callosum OD) *100 (26).
Fluorescence Microscopy Analysis
Free floating sections permeabilized with 0.1% Triton X-100 (Sigma)/PBS and incubated with 5% goat serum/PBS (Sigma) at room temperature (RT) for 2 h. Sections were then incubated overnight at RT with the following primary antibodies: polyclonal rabbit anti-TH (1:500, Covance), mouse-anti-GFP antibody (A-11120, 1:1,000 Invitrogen), rabbit-anti-GFP (A-11122, 1:1,000, Invitrogen), mouse anti-neuronal nuclear antigen (NeuN; MAB377, 1:50 Chemicon), and rabbit anti-glial fibrillary acidic protein (GFAP; Z0334, 1:600, Dako). On the next day, incubated at RT for 2 h with DAPI [2-(4-amidinophenyl)-6-indolecarbamidine dihydrochloride, 1:10,000, Sigma] and the appropriate secondary antibodies: goat anti-mouse, A-11004, Alexa Fluor® 568; goat anti-rabbit, A-11034, Alexa Fluor® 488; goat anti-mouse, A-11024, Alexa Fluor® 488; goat anti-rabbit, A-11036, Alexa Fluor® 568 (1:150 Invitrogen). Thereafter, sections were mounted on glycerin-coated slides coverslipped with fluorescent mounting medium (Dako) (19).
Stereoinvestigator Version 5.05.1 (MicroBrightField, Inc., Colchester, VT) was used for the stereological counting. On each consecutive section, the region of interest was encircled and the Mode Optical Fractionator was chosen. Settings for the counting frame were 40 μm (x-axis) times 40 μm (y-axis) times 15 μm (z-axis) and 560 μm (x-axis) times 440 μm (y-axis) for the grid size, respectively. The depth of the section was measured manually every third grid. GFP-positive cells were visualized by fluorescence microscopy and the total number was calculated by stereological counting.
Coexpression was analyzed by standard fluorescence microscopy (100x). One hundred to 200 TH-, NeuN-, and GFAP-positive cells within the graft were checked for GFP coexpression.
Graft composition was analyzed by standard fluorescence microscopy (100x). At least 100–200 GFP-positive cells were checked for NeuN and GFAP coexpression. The counting was performed in the core of the graft to avoid counting striatal NeuN- or GFAP-positive cells originating from the host, based on previous results (6). The percentage of TH-positive cells in the graft was calculated by the total number of TH-positive cells counted by DAB microscopy divided by the total number of GFP-positive cells estimated by stereology.
Statistical Analysis
All statistical analyses were performed with StatView software using a one-factor ANOVA and a Student–Newman–Keuls post hoc test. Level of significance was set at p < 0.05. All results are expressed as means ± standard error of the mean (SEM).
Results
Lewis GFP-tg Embryos
Lewis GFP-tg embryos could not be differentiated from their wt littermates macroscopically or microscopically. No size differences between tg and wt Lewis GFP rats were observed at any developmental stage (Table 1). Lewis tg embryos consistently presented a strong fluorescence in all their body parts at all developmental ages that were studied (Fig. 2). However, differences in the size of the embryos between Lewis and SD strains were detected (Table 1). Lewis E11.5 embryos (tg and wt) had a longer CRL than SD, whereas for all later embryonic stages Lewis embryos were smaller compared to the relevant SD embryos.
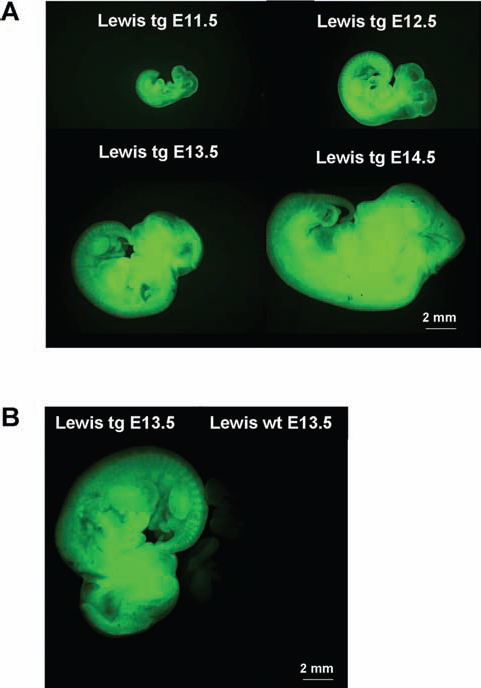
Lewis rat embryos at different embryonic ages. (A) Lewis green fluorescent protein (GFP)-tg 11.5, E12.5, E13.5, and E14.5 embryos visualized under fluorescence microscopy. (B) Lewis GFP-tg and GFP-wt E13.5 embryonic age visualized under fluorescence microscopy. FITC, fluorescein isothiocyanate.
CRL of Lewis and Sprague Dawley Crl:CD(SD) Rat Embryos at Different Embryonic Stages
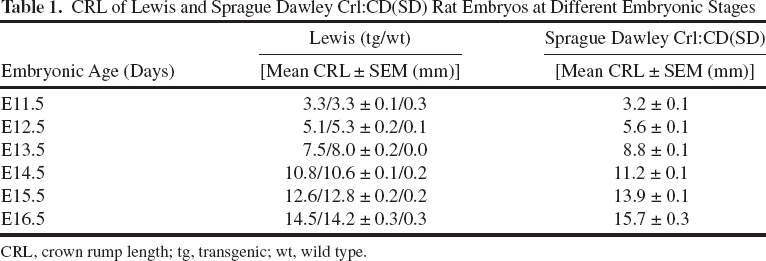
CRL, crown rump length; tg, transgenic; wt, wild type.
Flow Cytometry and GFP Expression on Fixed Cells
Results of flow cytometry analysis revealed that 78% of the cells evaluated in the cell sorter were viable according to forward and side scatter gating, and out of these surviving cells, 98% exhibited a strong green fluorescence without any additional staining procedure (Fig. 3).
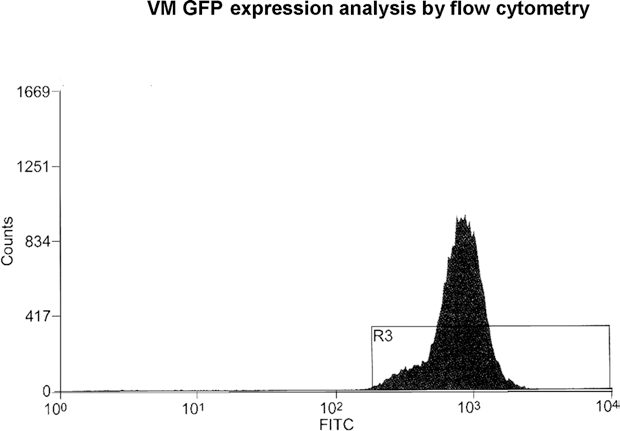
Flow cytometric analysis of E14.5 VM cells derived from GFP-tg Lewis embryos. 98.73% of analyzed cells were positive for GFP.
In all culture experiments, GFP expression could still be detected under the fluorescence microscope after fixation. However, the fluorescence signal of fixed unstained cells faded with storing time over several months, although fixed cultures were kept in the dark at 4°C. In these cases, an antibody against GFP revealed the presence of the protein. Lewis wt-derived cells were negative in immunocytochemistry against GFP.
Cell Culture
Tg VM E14.5 cells had the same viability (95–98%) as their wt counterparts after dissection and preparation of single-cell suspension and showed no differences in cell culture. Cells grew as a monolayer. The total cell number significantly increased by prolonging culturing time from d4 to d10 [tg d4/d10: 132,100 ± 32,300/ 189,800 ± 5,500 cells, F(2, 9) = 9.849, p < 0.005; wt d4/ d10: 108,300 ± 31,500/184,000 ± 35,300 cells, F(2, 9) = 5.962, p < 0.001] (Fig. 4A). Since the total cell population increase during culturing and the absolute total number of β-III-tubulin-positive cells remain in the same levels throughout the culture (data not shown), the percentage (%) of the neuronal cell populations behaved inversely (Fig. 4B). However, the TH cell population showed a significant decrease in percentage and absolute numbers (data not shown) after d4 and d10 in culture [tg d4/ d10 F(2, 9) = 20.901, p < 0.02, wt d4/d10 F(2, 9) = 6.000, p < 0.03] (Fig. 4C).

Cell culture of Lewis E14.5 GFP-tg and wt VM for 4, 8 and 10 days. The analysis of (A) total cell numbers (DAPI), (B) percentage of neuronal cell population (β-III-tubulin) per total cell number, and (C) percentage of dopamine (DA) cell population (tyrosine hydroxylase; TH) per total cell numbers does not reveal any significant difference in behavior between tg and wt embryos-derived cells during culture.
Lewis E12.5 VM cells grew in spheres as seen under the phase contrast microscope when plated in noncoated suspension flasks (free floating). Both tg and wt cells had a very low proliferation rate when cultured for 21 days free floating: tg cells reached 2.5 times their original cell number, while wt cells reached 3.5 times their original cell number in the same time. Immunocytochemical analysis revealed that the cells did not lose GFP expression during proliferation as spheres.
6-OHDA Neurotoxicity in Cell Culture
As seen before in SD cell cultures (16), E14.5 Lewis VM tg and wt cells were also affected by 6-OHDA treatment. With long incubation times of 12 and 24 h, a concentration-dependent decrease in total cell numbers was evident with fewer cells surviving at higher 6-OHDA concentrations, showing no significant difference between tg and wt cultures (Fig. 5A).

6-OHDA neurotoxicity cell culture experiments. Lewis E14.5 culture of GFP-tg and wt VM-derived cells exposed to 10, 15, 30, and 60 μM 6-OHDA for 12 and 24 h on day 4 (4d) and fixed on day 7 (7d). The analysis of (A) total cell numbers (DAPI), (B) percentage of neuronal cell population (β-III-tubulin) per total cell number; percentage of tg β-III-tubulin-positive cells significantly decrease after 12 h of 30 (*) and 60 (**) μM 6-OHDA incubation compared to the wt, and (C) percentage of DA cell population (TH) per total cell numbers does not show any significant difference in behavior between tg- and wt-derived cells after 6-OHDA treatment.
The decrease in the percentages of β-III-tubulin-positive cells demonstrated that the neuronal population was more affected by 6-OHDA than the total cell population. Analysis of the β-III-tubulin-positive cell numbers per well revealed a lower percentage (and lower absolute total number; data not shown) of survival in tg cells in comparison to the wt. The percentage of β-III-tubulin-positive cells after 12 h of 30 and 60 μM 6-OHDA incubation was significantly lower in tg cells than in wt cell. There was no significant difference for the 24-h incubation (Fig. 5B).
The changes in the percentages of TH-positive cells revealed that DA cells were not more sensitive to 6-OHDA at low concentrations in comparison to the total cell population. However, the higher concentrations of 6-OHDA (30 and 60 μM) killed DA cells more efficiently than the total cell population, showing a higher sensitivity of these cells to the toxic effects of 6-OHDA. There was no significant difference in the percentage of TH-positive cells between tg and wt cultures for both the 12 and 24 h of incubation (Fig. 5C).
Transplantation Experiments
Drug-Induced Rotations
Seven weeks after 6-OHDA lesion, the animals showed both apomorphine- and amphetamine-induced rotation behavior. The lesion was assumed to be successful in case an animal rotated four times per minute after apomorphine and six times per minute after amphetamine injection.
There was a significant decrease in apomorphine-induced rotation behavior 10 weeks after transplantation in the nonimmunosuppressed group compared to their rotation behavior 7 weeks after lesion. Both immunosuppressed and nonimmunosuppressed groups showed a significant decrease in apomorphine-induced rotation behavior 15 weeks after transplantation (Fig. 6A).

Drug-induced rotations. Transplantation effects were evaluated by drug-induced rotations tested 2 (TX2 group only), 4 (TX4 group only), 10 (TX10 group only), and 15(TX15 group only) weeks after transplantation (Post-TX) and compared to drug-induced rotations 7 weeks after lesion (Post-LX). (A) Apomorphine-induced rotations. Significant decrease (*) 10 weeks (TX10) and 15 weeks (TX15) after transplantation in the nonimmunosuppressed group. Immunosuppressed group showed a significant decrease (#) 15 weeks (TX15) after transplantation. (B) Amphetamine-induced rotations. Two weeks after transplantation (TX2), there was a significant decrease in amphetamine-induced rotation behavior in all (*) and (#). Reversion of rotation was observed 4 weeks (TX4) after transplantation, and thereafter, amphetamine-induced rotation behavior remained stable. The immunosuppressed and nonimmunosuppressed groups showed no significant difference in induced rotation behavior.
Already 2 weeks after transplantation, there was a significant decrease in amphetamine-induced rotation behavior in all groups compared to their rotation behavior 7 weeks after lesion. Reversion of rotation was observed 4 weeks after transplantation, and thereafter, amphetamine-induced rotation behavior remained stable. The immunosuppressed and nonimmunosuppressed groups showed no significance difference in induced rotation behavior test (Fig. 6B).
Morphological Graft Analysis
TH-Expressing Cell, Graft Volume, and Fiber Density
The graft was easily identified in the brain of the transplanted animals by the GFP expression (Fig. 7). The immunosuppressed and nonimmunosuppressed groups showed no significant difference in TH-positive total cell number (Fig. 8A). No significant difference was shown in either graft volume or fiber density by the immunosuppressed and nonimmunosuppressed groups (Fig. 8B, C). Assuming 8–10% of cells in the cell suspension that was transplanted (440,000 ± 40,000) were TH-positive cells (2,18,31), the survival rate of TH-positive cells after transplantation is between 2.7% and 3.3%.
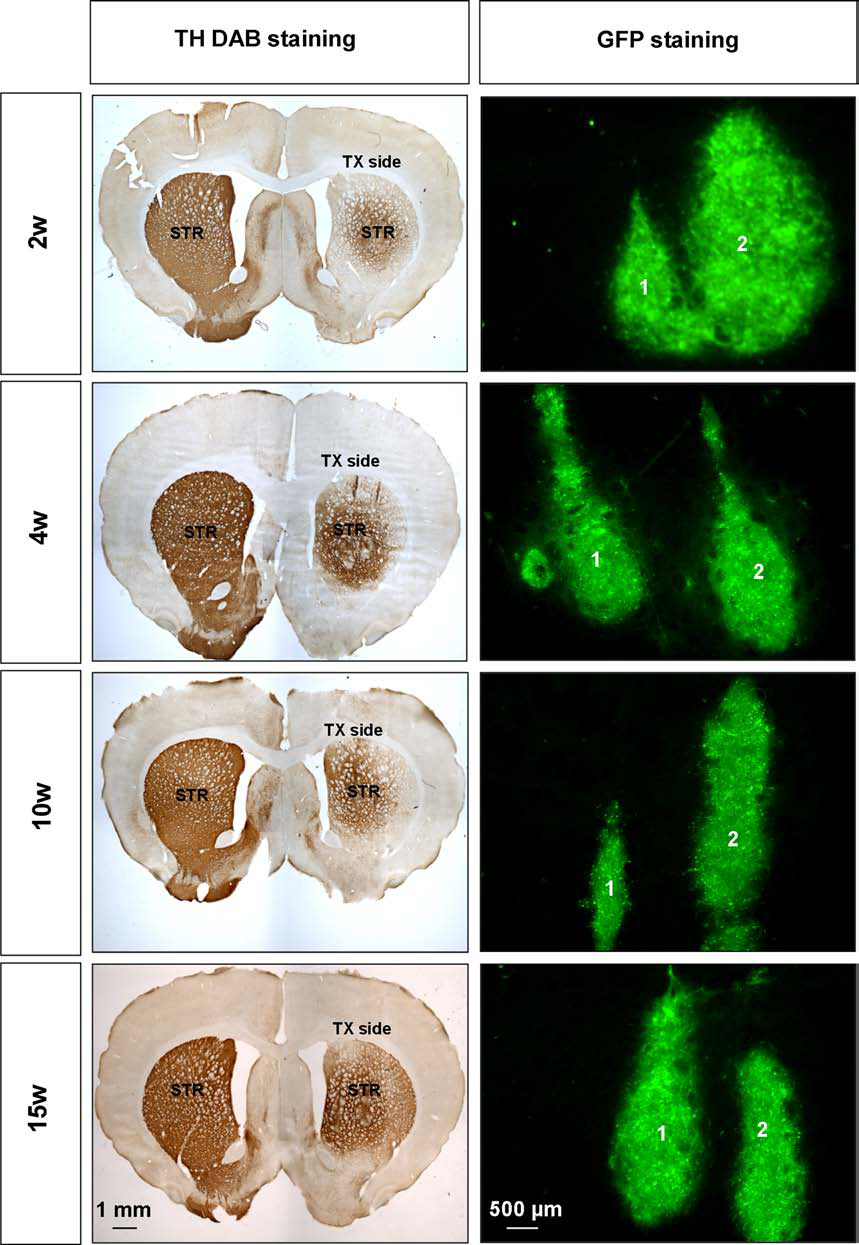
Graft visualization 2, 4, 10, and 15 weeks after transplantation (TX). DAB and fluorescence TH immunohistochemistry of brain sections at the coordinate AP +1.0. Numbers 1 and 2 represent the two transplantation tracks. The immunosuppressed and nonimmunosuppressed groups showed no significant difference in the total number surviving. GFP-expressing cells 2, 4, 8, or 10 days after transplantation. Light and fluorescence microscopy at 4x and 10x magnifications, respectively. STR, striatum.

Morphological graft analysis. (A) Immunosuppressed and nonimmunosuppressed groups showed no significant difference in TH-positive total cell number or (B) in graft volume or (C) in fiber density at any time. (D) Total numbers of GFP-positive cells of the grafts were estimated by stereology and showed no significant difference among the groups.
Graft Composition and GFP Coexpression
Total number of GFP-positive cells of the grafts were estimated by stereology and showed no significant difference among the groups. Since the total number of transplanted GFP-positive cells was in the range of 440,000 ± 40,000 and the mean of total number of GFP-expressing cells of all groups was 70,067 ± 3,053, an average of 15.9% graft-derived GFP-expressing cells were identified in the striatum of the transplanted animals. (Figs. 7 and 8D).
In the graft were identified 13.3% ± 0.9% GFAP-positive cells, 56.1% ± 1.1% NeuN-positive cells, and 1.9% ± 0.01 % TH-positive cells and, moreover, 70.6% ± 1.3% of the GFAP-positive cells, 86.9% ± 1.3% of the NeuN-positive cells, and 80.1% ± 1.7% of the TH-positive cells in the graft coexpressed GFP (Fig. 9).

Graft composition and GFP coexpression. In the graft were identified 13.3% ± 0.9% GFAP-positive cells (A–D), 56.1% ± 1.1% NeuN-positive cells (E–H), and 1.9% ± 0.01% TH-positive cells (I–L) and 70.6% ± 1.3% of the GFAP-positive cells, 86.9% ± 1.3% of the NeuN-positive cells, and 80.1% ± 1.7% of the TH-positive cells in the graft coexpressed GFP. (M–P) Higher magnification (2.5x higher) of TH-positive cells that are boxed in (L) Confocal microscopy at 20x magnification. White arrows indicate cells that coexpressed GFP and the relevant marker.
Discussion
The results of this study indicate the potential of GFP-tg Lewis rats (22) as a donor source for stem cell transplantation studies in neurodegenerative diseases such as PD.
Lewis GFP-tg embryos (E11.5, E12.5, E13.5, E14.5, E15.5, and E16.5) exhibit strong GFP-expression, which did not influence the development of the tg embryos. The tg as well as the wt embryos developed in a similar manner, and they were not distinguishable under light microscopy excluding detrimental effects of GFP expression. Lewis tg and wt embryos were in general smaller compared to SD embryos of the same age. This difference is based on the fact that they belong to different rat strains. Based on our experience and in line with other labs (http://www.criver.com/) and investigators (27), Lewis rats are smaller as embryos as well as adults in comparison to SD.
Cell culture results clearly showed that GFP expression of the tg-derived VM single-cell suspensions of untreated cells [fluorescence-activated cell sorting (FACS) analysis] as well as of GFP immunostaining remains almost 100% detectable. Previous studies found toxic and immunogenic effects of GFP (22,41,43). However, we could not find any differences neither between tg and wt cultures in growing patterns and reactivity to 6-OHDA nor between tg and wt grafts in graft survival and rotation behavior. All analyzed parameters indicate regular growing patterns in culture. In addition, Lewis cell cultures showed the same pattern compared to former experiments (16) using VM cell cultures derived from SD.
Furthermore, the results from the transplantation study revealed that Lewis tg VM-derived cells behave in the same manner in vivo as their equivalent SD cells (26,33) in terms of rotation behavior, graft cell survival, and fiber density. These results demonstrate no toxicity of GFP and showed that tg cells are equivalent to wt Lewis and SD cells in vitro and in vivo.
In addition, the animals of the nonimmunosuppressed transplanted groups did not show any difference on rotation behavior, graft survival, fiber density or GFP expression compared to the immunosuppressed transplanted groups. Thus, GFP expression of tg cells does not have an immunogenic effect in an immunologically privileged site such as the brain neither towards the host nor the grafted cells themselves (22). This is in contrast to other graft sites such as the skin and the hematopoietic system (22,43).
In agreement with other allografting studies between Lewis and SD strains focusing on immune reaction, there were no signs of graft rejection. In these studies, immune response via major histocompatibility complex (MHC) markers and DA graft rejection was analyzed (4,11,12,42). However, it had not been shown whether immunosuppression can improve the GFP-tg DA graft survival in animal models of PD. Our results indicate that GFP-tg Lewis rats can be used without immunosuppression as allogenic donors for transplantation into genetically different rats like SD. It allows introducing GFP-tg rats as resource for embryonic neural cell transplantation and transferring previously obtained data to new experiments. Additionally, it allows the use of SD rats as recipients and therefore transferring previous behavioral experiences with this rat strain to future experiments even without any immunosuppression.
Every time that tg rat strains are used, there is always the question of stable expression of the introduced gene. In our experiments, we detected GFP expression after 3 weeks in culture and 15 weeks after transplantation even without antibody enhancement (data not shown). After long storing times of several months of fixed cells or brains, GFP could still be detected by an anti-GFP antibody. This allows tracing of these cells after transplantation in order to analyze the exact graft composition, migration pattern, integration behavior, and electrophysiological characteristics.
GFP expression was analyzed in the embryonic brain and in cultured nestin-expressing neural precursor cells (22). A previous study suggested that adult neuronal cell populations do not express GFP (15). Hence, we analyzed the graft regarding the coexpression of GFP and neuronal and glial markers. The DA-denervated striatum in the MFB-lesioned rat is devoid of TH-positive cells. Thus, any TH-positive cells were derived mainly from the graft. Analysis of the graft revealed that 80% of striatal TH-positive cells on the lesion side coexpress GFP. Thus, they are graft derived and continue expressing GFP up to 15 weeks after transplantation. This represents a much higher rate than all previous studies with labeled cells reported, either derived from GFP transgenic rats by pretransplantation viral transfection of the cells or by pretransplantation staining procedures (20,22,37,45,50). The remaining 20% did not have a fluorescence microscopic detectable GFP signal. Suggesting that these cells are graft derived, they either do not express GFP or have a GFP signal, which is too weak for detection. Current theories proposing that grafting promotes the host's regeneration of degenerated cells (17) could offer the intriguing alternative explanation that these TH-positive cells could be not graft but host derived. However, as these TH-positive cells were found ectopically in the striatum as opposed to their original place in the substantia nigra, pars compacta, this scenario appears rather unlikely. A third explanation might be found in technical issues such as suboptimal staining procedures and bleaching due to long exposure to fluorescence light during several countings. Coexpression analysis of NeuN-expressing cells cannot reveal the percentage of graft-derived cells with continuous GFP expression because of the presence of host-derived neuronal cells in the striatum. But it illustrates that, up to 15 weeks after transplantation, we can find graft-derived NeuN-positive neuronal cells, which coexpress GFP in 86.9%, resulting in the ability to detect DA and other neuronal and non-neuronal grafted cells by their GFP expression.
In addition, a study using a rat model of Huntington's disease (HD) showed that 83.9% of GABAergic cells, derived from the E15.5 ganglionic eminence of GFP-expressing rats and transplanted into the striatum of SD rats, continued to express GFP posttransplantation (25). This suggests the potential usage of the Lewis GFP-expressing rat strain in different rat models of neurodegenerative diseases.
Having evaluated the stability of GFP expression, we investigated the total graft survival and graft composition in the MFB lesion model of PD. This was possible without pretransplantation labeling procedures, which could eventually affect cell survival and graft composition.
The total graft survival could be investigated for the first time in this model, showing an average cell survival of 15.9% of the originally transplanted cell numbers. Together with the estimated DAergic cell survival (2.7–3.3%), this correlates with previous findings as well (31,32). Thus, our results suggest that not only DA cells but also other cell populations are affected by cell loss after transplantation. We assume that our total cell survival mirrors findings of previous studies that could not analyze the whole graft lacking a reliable labeling method.
Further investigation of graft composition revealed that GFAP activation was mainly host-derived since only 13.3% of GFP-positive cells coexpress GFAP. Also, different hosts showed different morphological patterns of GFAP expression. For instance, the surrounding of the graft by GFAP-positive cells, which were negative for GFP, might be an indicator of a certain degree of immunological reaction by the host. To prove this theory, microglial and macrophageal markers might be of further interest. Overall, the major cell population revealed to be NeuN-positive (56.1% of the graft). The remaining percentage of missing cells indicates that the graft includes cell types that could not be identified with the present set of immunonohistochemical markers. For example, immature neurons (doublecortin-positive) (6) as well as oligodendrocytes (myelin binding protein-positive) (36) might also be present in the graft and could be of interest in further studies using GFP-tg animals
In conclusion, we provide evidence that the GFP-transgenic Lewis strain (22) can be used as a cell donor to investigate more precisely the fate of transplanted neuronal progenitor cells in models of neurodegenerative diseases such as PD and HD (25), white matter diseases such as multiple sclerosis (15). In contrast to previously used labeled cells, these tg cells provide high-GFP expression examined up to 15 weeks after transplantation. This enables a detailed analysis of the graft composition; in our case, the demonstration that such grafts pronominally consist of neuronal cells and only a minor fraction of GFAP-positive astroglia. Furthermore, one can also envision applications in two-stage grafting approaches to distinguish two different grafts in the rat model of PD. It might also serve as a useful tool to examine the electrophysiological properties of transplanted cells in future functional studies of neural transplantation, for example, in slice cultures.
Footnotes
Acknowledgments
The authors would like to thank Jan Pruszak and Máté Döbrössy for valuable suggestions on the manuscript. Johanna Wessolleck and Bruni Baumer have contributed with excellent technical work. This research was supported by grants from the European Commission under the 7th Framework Programme–HEALTH–Collaborative Project Transeuro (Contract no. 242003), the German Parkinson Foundation (dPV), and the Weber-Petri Foundation. Authors declare no conflicts of interest.