
Abstract
MicroRNAs regulate gene expression by inhibiting translation or inducing target mRNA degradation. MicroRNAs regulate organ differentiation and embryonic development, including pancreatic specification and islet function. We showed previously that miR-7 is highly expressed in human pancreatic fetal and adult endocrine cells. Here we determined the expression profile of miR-7 in the mouse-developing pancreas by RT-PCR and in situ hybridization. MiR-7 expression was low between embryonic days e10.5 and e11.5, then began to increase at e13.5 through e14.5, and eventually decreased by e18. In situ hybridization and immunostaining analysis showed that miR-7 colocalizes with endocrine marker Isl1, suggesting that miR-7 is expressed preferentially in endocrine cells. Whole-mount in situ hybridization shows miR-7 highly expressed in the embryonic neural tube. To investigate the role of miR-7 in development of the mouse endocrine pancreas, antisense miR-7 morpholinos (MO) were delivered to the embryo at an early developmental stage (e10.5 days) via intrauterine fetal heart injection. Inhibition of miR-7 during early embryonic life results in an overall downregulation of insulin production, decreased β-cell numbers, and glucose intolerance in the postnatal period. This phenomenon is specific for miR-7 and possibly due to a systemic effect on pancreatic development. On the other hand, the in vitro inhibition of miR-7 in explanted pancreatic buds leads to β-cell death and generation of β-cells expressing less insulin than those in MO control. Therefore, in addition to the potential indirect effects on pancreatic differentiation derived from its systemic downregulation, the knockdown of miR-7 appears to have a β-cell-specific effect as well. These findings suggest that modulation of miR-7 expression could be utilized in the development of stem cell therapies to cure diabetes.
Introduction
MicroRNAs (miRNAs) are small noncoding RNAs that regulate gene expression by interacting with the three prime untranslated regions (3'UTR) of target mRNAs (3,4). MiRNAs play a fundamental role in the regulation of gene expression, controlling key biological events such as cell proliferation, differentiation, death, and malignant transformation (4). To date, the microRNA registry has annotated more than 700 human miRNAs (16), which are predicted to regulate up to 30% of the human genes (32,49).
MiRNAs regulate stem cell lineage differentiation and embryonic and organ development, including pancreatic specification and islet function (5,18,19,23,27,35,37,40–42,50). Conditional deletion of Dicer, the gene encoding the enzyme responsible for miRNA maturation, reveals that miRNAs are essential for the embryogenesis of pancreatic islet cells (37).
We have previously identified a subset of miRNAs differentially expressed in islets (ratio islet/acinar > 150-fold), of which miR-7 was the most abundant in rat and human islets (6). MiR-7 is a highly conserved miRNA (33), mainly restricted to endocrine tissues such as the islets of zebrafish (48), human and rodent pancreatic islets, and human pituitary gland (30). MiR-7 is expressed at high levels in the human adult pancreas (22) and during human pancreatic development predominantly in endocrine cells (10). Based on these observations, we hypothesize a role of miR-7 in endocrine cell development. To define such role, we sought to evaluate the effects of targeted miR-7 inhibition. Knocking out miRNA genes is cumbersome because they have more than one copy, and each is located on different chromosome; for example, in the mouse the three copies of miR-7 are positioned on chromosomes 7, 15, and 19 (miRBase http://microrna.sanger.ac.uk/sequences/). Moreover, some miRNAs are found in clusters with other miRNAs (28). In both cases, the specific individual knockout is challenging. To circumvent this limitation, we developed a novel in vivo method to inhibit mature miR-7 activity in the mouse fetal pancreas by direct, intracardiac delivery of antisense miR-7 morpholino (MO) into mouse embryos. Similarly, we have succeeded to inhibit miR-7 activity in vitro in cultured pancreatic buds. MOs are synthetic antisense oligos with the capability to inhibit mature miRNA activity (9,15,25,31,46,47).
Our results indicate that miR-7 expression is required for normal development and postnatal function of β-cells.
Materials and Methods
Intrauterine Cardiac Injection
All animal procedures were approved by the University of Miami IACUC. Pregnant female C57BL/6 mice (20–25 g) were anesthetized by inhalation of 2% isoflurane and placed on a preheated platform (36–38°C) with ECG electrodes to monitor the heart rate. Using a 500-μl Hamilton syringe (Hamilton, NV), each e10.5 embryo visualized by ultrasound received intracardiac injection of Vivo-Morpholino anti-miR-7 (Morpholinos MOs Gene Tools, Philomath, OR): MO anti-miR-7a: ACAACAAAATCACTA GTCTTCCA; MO anti-miR-7b: ACAACAAAATCACAAGTCTTCCA; MO irrelevant: control CCTCTTACCTCAGTTACAAT TTATA; and MO anti-miR-7m (mutated): ACAACAA AATCACTATGGCAGAT. The needle was guided by an ultrasound biomicroscope with B-mode image (Vevo 770, Visual Sonics). Six to eight embryos per animal were injected.
miRNA and mRNA Quantification: Quantitative Real-Time PCR
RNA was isolated utilizing mirVana miRNA isolation kit (Ambion-Applied Biosystems, Foster City, CA). Relative quantification (RQ) of insulin-1 (Ins1), Ins2, glucagon (Gcg), pancreatic and duodenal homeobox 1 (Pdx1), α amylase (AMY), specific protein transcription factor 1 (Sp1), vascular endothelial growth factor a (Vegfa), glucose transporter 2 (GLUT-2), neurogenin 3 (Ngn3), somatostatin (Sst), and pancreatic polypeptide (Ppy) was performed with a 7500 Fast Real-Time PCR system, utilizing TaqMan primers and reagents (Applied Biosystems). RQ represents the fold change of expression between MO anti-miR-7 versus MO control. The quantification of miRNA by qRT-PCR was performed following the protocol for TaqMan MicroRNA Assays. RQ was calculated via Applied Biosystems SDS software based on the equation RQ = 2−ΔΔCt (36). Ct = the number of amplification cycles. Ct is normalized to endogenous control 18S rRNA.
Intraperitoneal Glucose Tolerance Test
An intraperitoneal glucose tolerance test (IPGTT) was performed in 2-week-old mice to assess glucose clearance. Briefly, animals received an intraperitoneal glucose bolus (1 mg/kg of body weight); glycemia was measured with portable glucometers (OneTouchUltra2, Lifescan, CA) over a period of 120 min in conscious animals in whole blood (tail vein). To evaluate glucose clearance, the area under the curve (AUC) of glycemic values after bolus was calculated for individual animal of each experimental group. The experimental groups were compared as described previously (20).
Insulin Content
Insulin content of fetal pancreas at different developmental stages was quantified by LincoPlex endocrine panel kit (Linco-Invitrogen, La Jolla, CA) using a Bio-Plex Platform (Bio-Rad Laboratories, Inc., Hercules, CA).
In Vitro Experiments: Pancreatic Explants Culture
Pancreatic buds [C57BL/6 or B6.Cg-Tg(Ins1-EGFP) 1Hara/J (mice that express enhanced green fluorescent protein under the control of the mouse insulin 1 promotor); Jackson Laboratories, Bar Harbor, ME] were isolated and microdissected as described elsewhere (11). Dulbecco's minimal essential medium (DMEM, Invitrogen, Carlsbad, CA, http://www.invitrogen.com) supplemented with 0.1 mM nonessential amino acids (Invitrogen), sodium pyruvate, 5% (vol/vol) newborn bovine serum, 5% (vol/vol) fetal calf serum, 0.1 mM 2-mercaptoethanol, 100 U/ml penicillin/100 μg/ml streptomycin, and 250 μM l-glutamine (Invitrogen) was used. Pancreatic buds were plated in 12-mm, 0.4-μl Millicell inserts (Millipore, Billercia, MA) (typically two per insert) and incubated at 37°C with 5% CO2. The medium was augmented with delivery agent Endoporter (6 ml/ml) (Gene Tools, LLC, Philomath, OR) plus 100 μM MO anti-miR-7 or MO control designated for in vitro use.
Inmunohistochemistry and In Situ Hybridization
Immunohistochemical analyses were carried out as de scribed before (21) using primary antibody rabbit anti-ISL1 (insulin gene enhancer protein 1; kindly provided by Helena Edlund, Umeå University) and guinea pig anti-insulin (BioGenex CA) with secondary antibody goat anti rabbit Alexa Fluor 488 and goat anti-guinea pig Alexa Fluor 568, respectively (Invitrogen Molecular Probes, CA). Terminal deoxynucleotidyl transferase dUTP nick end-labeling (TUNEL) staining kit (Promega, CA) was used to asses the cell death with nuclear stain DAPI (Invitrogen Molecular Probes) for contrast. MiR-7 in situ hybridization was performed as previously described (10) using fluorescein-labeled locked nucleic acid (LNA) mouse anti-miR-7 and control anti-miR-159 probes (Exiqon Denmark). The embryos were fixed overnight at 4°C with 4% paraformaldehyde. After the overnight hybridization, subsequent washes, and 1-h blocking with blocking solution, the samples were incubated 6 h with Alkaline phosphatase (AP) anti-fluorescein antibody (Roche Applied Science, Indianapolis, IN) dilution 1:5,000. The in situ hybridization was completed by developing in AP substrate v/v BCIP and NBT (Roche, IN) for 2–3 days.
Morphometric Analysis
Untreated and MO anti-miR-7-treated pancreatic tissue was cut in 10-μm serial sections. Every 5th section was stained for insulin and glucagon and visualized under Leica SP5 inverted confocal microscope at the Diabetes Research Institute (DRI) Imaging Facility. Images were taken with a 10x lens and a 1.5 zoom factor. The ratio of insulin-positive cell area to the total area of the pancreas was quantitatively analyzed with MetaMorph™ imaging software. β-Cell count per islet was measured using the feature of standard area count of MetaMorph. On each slide, a region was drawn around the area of insulin staining, and after thresholding the image, the DAPI-stained objects included in the region were measured. Objects were configured to be 80 pixels, the approximated average size of a β-cell nucleus. This feature counts any object with an area from 40 pixels to 119 pixels as a single nucleus and objects with an area from 120 to 239 pixels as two nuclei, following the rule Standard Area Count = Ratio (Pixel Area/Standard Area) must be between 0.5 and 1.49. To calculate β-cell number per pancreas area, the β-cell count of each slide was divided by the pancreas area or total DAPI area.
GFP fluorescent area from B6.Cg-Tg(Ins1-EGFP) 1Hara/J pancreatic bud explants were imaged by confocal microscope and measured by MetaMorph™ imaging software. NIT-1 insulinoma cells transfected with both the GFP and the dsRed2 were imaged with a Carl Zeiss LSM 510 inverted confocal microscope. The average intensity of fluorescence signals was measured using ImageJ software. A histogram of the average intensity of all cells measured per treatment was created, and the area under the curve (AUC) was determined for each histogram. GFP signal was normalized to the dsRed2 signal by calculating the ratio of GFP AUC over dsRed2 AUC for each treatment. MiR-7 in situ hybridization images were analyzed with MetaMorph™.
Statistical Analysis
Quantitative real-time PCR data were analyzed with Shapiro–Wilk normality test. Distributions determined to be Gaussian were analyzed with paired t test, while non-Gaussian data were analyzed with paired Wilcoxon test. Comparisons between multiple groups were done with one-way ANOVA with Tukey post hoc test when data were determined as Gaussian distribution and with Kruskal–Wallis analysis of variance with Dunn's post hoc test for non-Gaussian distribution. Comparisons between two independent samples were performed with Student's t test. A value of p ≤ 0.05 was considered to be significant.
Results
MiR-7 Expression During Mouse Pancreatic Development
We have established that miR-7 is expressed at high levels in the human developing pancreas (10); the next step was to determine the expression profile of miR-7 in the mouse developing pancreas. QRT-PCR showed very low MiR-7 expression, between e10.5 and e11.5, increasing at e13.5 through e14.5 (coinciding with the secondary transition) and decreasing by e18 (Fig. 1A). The in situ hybridization profile of miR-7 is consistent with the expression data by qRT-PCR analysis (Fig. 1B). To determine which cells express miR-7, we performed in situ hybridization in e17.5 pancreas with miR-7 probe and immunostaining analysis with Isl1, a marker for pancreatic endocrine cells (2). We found that Isl1 and miR-7 colocalize in most of the cells, strongly suggesting that miR-7 is expressed preferentially in endocrine cells in the mouse developing pancreas (Fig. 1C). Whole-mount in situ hybridization shows that miR-7 is also highly expressed in the neural tube (Fig. 2).
miR-7 expression during mouse pancreatic development. (A) qRT-PCR expression of microRNA 7 (miR-7) and insulin-1 (Ins1) transcripts. Pools of approximately 10 buds were used per point. Data are presented as means ± SD (n = 3). Data were analyzed with Shapiro–Wilk normality test. Distributions were determined to be Gaussian and analyzed with paired t test. *p < 0.05, two-tailed t test between e16.5, e14.5, and e13.5 versus e11.5. (B) In situ hybridization of fetal (e10.5, e14.5, and e17.5) mouse pancreatic tissue using fluorescein-labeled miR-7 locked nucleic acid (LNA) probe (black). Control (e14.5) was hybridized with irrelevant LNA probe miR-159. (C) Localization of miR-7 in the developing mouse pancreas. In situ hybridization of fetal e17.5 pancreatic tissue using fluorescein-labeled miR-7 LNA probe (black), double stained with antibody against insulin gene enhancer protein 1 (Isl1) and Alexa Fluor 488 anti-rabbit secondary antibody (green). Scale bar: 100 μm. miR-7 expression in the mouse embryo. Whole mount embryo (e14.5) in situ hybridization using fluorescein-labeled miR-7 LNA probe (black). Control was hybridized with irrelevant LNA probe miR-159. Scale bar: 2 mm.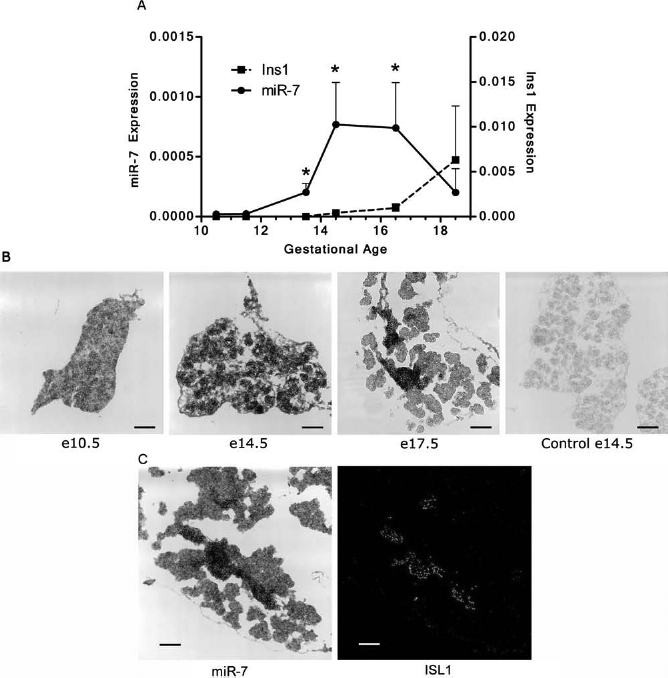

Intrauterine Cardiac Delivery of MO Into Mouse Embryos
To investigate the role of miR-7 in development of the mouse endocrine pancreas in vivo, we applied a knockdown model for loss of function studies utilizing a novel delivery of antisense MO anti-miR-7 to e10.5 embryos by ultrasound-guided intrauterine fetal heart injection (Fig. 3A). This approach was selected to achieve maximum MO concentration in each embryo injected while avoiding the risk of MO being diluted by mother's circulation (which can be expected with systemic administration). To assess the distribution of MO through the developing pancreas, we injected e10.5 embryos with 100 μM fluorescein isothiocyanate-labeled MO (MO-FITC) directed against irrelevant sequence. Twenty-four hours later, the pancreatic buds were retrieved and analyzed by confocal microscopy (Fig. 3B). The fluorescence distribution pattern revealed a good penetration of MO-FITC throughout the pancreatic tissue structure, indicating that the specific MO and MO control would reach the target in a similar fashion. The postinjection survival of embryos was greater than 90%.
Ultrasound-guided intracardiac injection into e10.5 embryos. (A) Ultrasound image of the tip of the injection needle. Scale bar: 1 mm. (N) inserted through the uterus and intra ventricle (H). (B) Image of the mouse pancreatic buds injected with morpholino fluorescein isothiocyanate (MO FITC) via intracardiac injection at e10.5 and evaluated ex vivo by confocal microscopy (z-stack) after 24 h (e11.5). The green fluorescence shows throughout the tissue (maximum projection plane is shown). Original magnification: x20. (C) Fluorescence of pancreatic tissue from embryos injected with saline solution. (D) 3x zoomed image shows intracellular uptake of fluorescence. Scale bar: 100 μm.
MO Anti-miR-7 Affects the Expression of Insulin
To ascertain the MO anti-miR-7 specificity to endogenous miR-7, we designed a miR-7 sensor molecule consisting of the green fluorescent protein (GFP) gene bearing in its 3'UTR three miR-7 binding sites (Fig. 4). As an endogenous control, we used the red fluorescent protein (DsRed2) containing mutated inactive miR-7 binding sites. Both constructs were transfected into an insulinoma cell line, NIT-1 cells, in which we have previously confirmed the miR-7 expression (data not shown). After 24 h in culture, the cells were treated with MO anti-miR-7 or MO control (an irrelevant MO with a sequence not found in the mammalian genome); 48 hours later, the cells were evaluated by confocal microscopy. MO anti-miR-7 inhibited miR-7, which resulted in stronger expression of GFP while the MO control did not have that effect and GFP in these samples was diminished. The intensity of the green fluorescence was normalized to red fluorescence protein intensity carrying the mutated miR-7 binding sites. The results strongly suggest that the MO anti-miR-7 activity is specific and it targets endogenous miR-7.
MO anti-miR-7 targets the endogenous miR-7. Insulinoma NIT-1 β-cells expressing both the green fluorescent protein (GFP) and the dsRed2 genes under cytomegalovirus (CMV) promoter were transduced with MO anti-miR-7 or MO control. The 3'UTR of the GFP gene contains three target sites for miR-7; the 3'UTR of the dsRed2 gene contains mutated miR-7 sites. GFP signal is normalized to the dsRed2 signal by calculating the ratio of GFP area under the curve (AUC) over dsRed2 AUC for each treatment. Values are shown as mean ± SEM (n = 3). Comparisons between multiple groups were done with one-way ANOVA with Tukey post hoc test for data determined as Gaussian distribution.*p < 0.05.
To investigate if manipulation of miR-7 activity has an effect on insulin expression in the developing pancreas, we injected MO anti-miR-7 or irrelevant MO control into the fetal heart of e10.5 embryos. At this developmental stage, miR-7 is barely expressed.
The 26 μg/embryo dose of the MO anti-miR-7 caused a significant degree of fetal reabsorption. This phenomenon was specific for MO anti-miR-7; it was not observed in embryos injected with the same dose of MO control.
For that reason, we utilized a lower dose of MO anti-miR-7 (8.6 μg/embryo), which in comparison with physiological pregnancies was innocuous regarding the size and survival of the fetus. This also allowed us to study the effect of the intervention on newborn mice. The pancreatic insulin transcript levels in MO anti-miR-7-injected embryos were significantly diminished by e17.5 (Fig. 5A). Quantification by qRT-PCR showed a statistically significant reduction in Ins1 and Ins2. No changes were observed in transcript levels of the endocrine hormones Gcg, Sst, and PPy (produced by a, d, and pancreatic PP cells, respectively). Neither the proendocrine marker Ngn3 nor Ipf1/Pdx1 (a homeodomain transcription factor expressed in early pancreatic progenitor cells and differentiated β-cells) (12) were changed in a statistically significant fashion. Likewise, delivery of MO anti-miR-7 did not affect the level of transcripts of Vegfa and Sp1. Vegfa is an angiogenic factor that has been reported to have a critical role in endocrine pancreatic development (8,29). Sp1 is a DNA-binding protein that interacts with a variety of gene promoters to maintain a basal transcription of “housekeeping” genes (45). Thus, the lack of effect of anti-miR-7 treatment on Sp1 underscores the specificity to Ins1 and Ins2 mRNA levels. The effect of MO anti-miR-7 on insulin reduction in the fetal pancreas varied from animal to animal; in some the inhibition was very pronounced, whereas in others more attenuated. Assessment of cell death by TUNEL assay showed extensive cell death throughout the pancreatic tissue in MO anti-miR-7-treated animals, but not in the MO controls (Fig. 5B). Because of the high miR-7 expression in the embryonic brain and the fact that all cell types (not only endogenous cells expressing miR-7) were affected equally, we assume that a systemic effect is the major contributor. The intrafetal administration of MO anti-miR-7 did not affect the glycemic status of the mother (data not shown), thus ruling out the possibility that maternal sharp variation of blood glucose levels could have induced apoptosis of incipient fetal β-cells (38).
In vivo delivery of MO anti-miR-7. 8.6 μg/embryo of MO anti-miR-7 or MO control were injected into the heart of e10.5 embryos. (A) Pancreatic buds were retrieved at day e17.5, and a panel of genes was assessed by quantitative qRT-PCR (see Materials and Methods for definition of genes). Each set represents analysis of a pool of pancreatic buds isolated from six to eight mice. Control and anti-miR-7 on the x axis represent MO control calibrator = 1 and RQ = MO anti-miR-7, respectively (n = 7). Data were analyzed with Shapiro–Wilk normality test. Non-Gaussian data were analyzed with paired Wilcoxon test. *p < 0.05. (B) Assessment of cell death by in situ detection of fragmented DNA (TUNEL reaction). The MO anti-miR-7 and MO control were delivered and collected as described above. Scale bar: 200 μm.
Intraperitoneal glucose tolerance test (IPGTT) in 2-week-old mice injected in utero (e10.5) with MO anti-miR-7 showed glucose intolerance (Fig. 6A, B); moreover, the islets had lower insulin content than the controls (Fig. 6C) and lower number of insulin-expressing cells (Fig. 6D). This correlated with the lower transcript levels determined by qRT-PCR (Fig. 6E).
Insulin expression assessment in newborn mice. Mice (2 weeks old) that received at e10.5 intracardiac injection of MO anti-miR-7, MO control, or remained untreated. (A) Intraperitoneal glucose tolerance test (IPGTT). The areas under the glucose curve (AUC) from each mouse were calculated. Data are presented as mean ± SEM (n = 16). (B) Representative glucose tolerance curve. (C) Assessment of insulin content in pancreas. Values are shown as mean ± SEM (n = 3). Comparisons between multiple groups were done with one-way ANOVA with Kruskal–Wallis analysis of variance with Dunn's post hoc test for non-Gaussian distribution. *p < 0.05. (D) Morphometric analysis of insulin-producing cells. The total count of insulin-producing cells in the entire pancreatic section. Values are shown as mean ± SEM (n = 3). Comparisons between two independent samples were performed with Student's t test. *p < 0.05). (E) Quantitative qRT-PCR. Control and anti-miR-7 on the x axis represent MO control calibrator = 1 and RQ = MO anti-miR-7, respectively (n = 7). Data were analyzed with Shapiro–Wilk normality test. Non-Gaussian data were analyzed with paired Wilcoxon test. *p = 0.015 for insulin 1, PDX1, and Gcg and p = 0.218 for Glut-2. See Materials and Methods for gene definitions.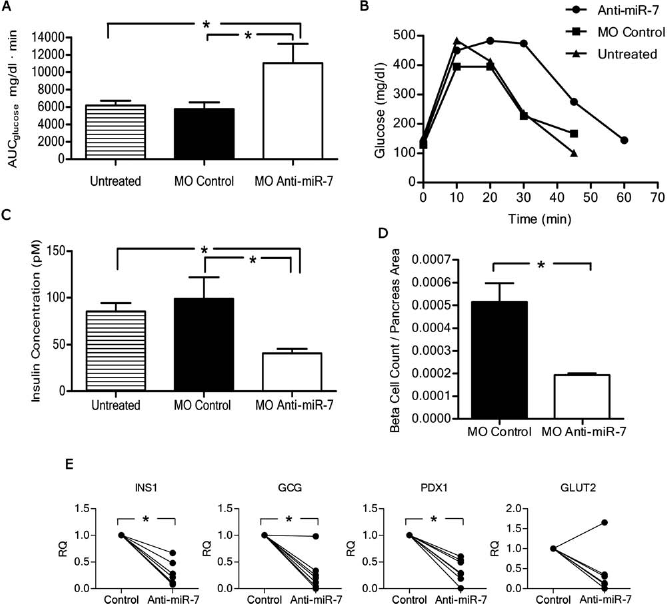
QRT-PCR analysis of the GcG, Pdx1, and Glut-2 expression was statistically significant for Gcg and Pdx1 but not for Glut-2 (p = 0.21), a gene regulated by Pdx1 (1) (Fig. 6E).
Overall, these results suggest (a) that inhibition of miR-7 results in lower β-cell number and therefore in less insulin and (b) that the intolerance to glucose observed in 2-week-old mice treated in utero is due to fewer insulin producing cells.
In Vitro Regulation of Insulin Expression in Cultured Pancreatic Buds
To investigate the effect of miR-7 inhibition in fetal pancreas without the potentially confounding contribution of nonpancreatic factors, we used cultured pancreatic buds, which have been shown to recapitulate to a large extent the in vivo development (44). To assess the in vitro transduction potential of MOs, the e13.5 pancreatic buds were cultured in the presence of MO-FITC. Fluorescence was detectable throughout the transduced pancreatic buds (Fig. 7A). The next step was to determine miR-7 expression in cultured pancreatic buds. MiR-7 expression profile is similar to the one observed in vivo (Fig. 7B). For the in vitro transduction experiments with MO anti-miR-7 and MO control (Fig. 7C), the dorsal e12.5 pancreatic buds were used. At this stage, the dorsal and ventral portions of the pancreas are not yet fused (13). Compared to MO control, the Ins1 and Ins2 expression was significantly reduced in MO anti-miR-7-treated explants (Fig. 7C). To exclude the potential cytotoxicity effects on downregulation of Ins1 and Ins2, we used a nonfunctional MO anti-miR-7m containing a mutated recognition site as additional control. There was no significant difference between MO control and MO anti-miR-7m results (data not shown). Assessed by TUNEL assay, pancreatic buds cultured with MO anti-miR-7, but not with MO control and untreated samples, showed increased cell death specifically of insulin-producing cells (Fig. 8). Dying β-cells demonstrated weaker insulin staining localized in disorganized spots, while insulin in normal β-cells stained strongly in cytoplasm surrounding the nucleus. The efficiency of MO anti-miR-7 transduction varied from sample to sample. In some samples, we could still see groups of normal β-cells together with dying β-cells colocalizing with TUNEL staining (MO anti-miR-7 II) (Fig. 8).
In vitro experiments in pancreatic buds. (A) MO transduction in mouse pancreatic buds. Mouse pancreatic buds (e13.5) were incubated for 48 with a FITC-labeled MO plus Endoporter vehicle. The fluorescence of MO-treated unfixed pancreatic buds was analyzed by Z-sectional scanning (2 μm optical sections) with confocal microscope. The fluorescence pattern clearly indicates penetration of MO throughout the tissue structure. No fluorescence signal was detected in untreated cultured pancreatic buds (data not shown). (B) miR-7 and Ins1 expression in cultured pancreatic buds. Mouse pancreatic buds (e12.5) were cultured for 5 days. qRT-PCR of miR-7 and Ins1 transcripts was assessed each day. Pools of approximately 10 buds per point were used. Data are presented as means ± SD; square and solid line represent miR-7; circle and dotted line represent Ins1 (n = 3). (C) Inhibition of miR-7. Quantitative qRT-PCR assessing the transcripts of the hormones and embryonic markers in cultured pancreatic buds. Pancreatic buds (e12) were cultured for 6 days in the presence of MO anti-miR-7 or MO control. Control and anti-miR-7 on the x axis represent MO control calibrator = 1 and RQ = MO anti-miR-7, respectively (n = 6). Data were analyzed with Shapiro–Wilk normality test. Non-Gaussian data were analyzed with paired Wilcoxon test. *p < 0.05. See Materials and Methods for gene definitions. Inhibition of miR-7 in cultured fetal pancreatic buds caused beta cells death. Embryonic pancreatic buds from e12 were cultured for 5 days in the presence of MO anti-miR-7 and MO control. Cell death was assessed by in situ detection of fragmented DNA (TUNEL reaction). For each panel, DAPI (blue), insulin (red), TUNEL (green), and merged colors are shown. The examples of two different results are shown (I and II). Scale bar: 200 μm.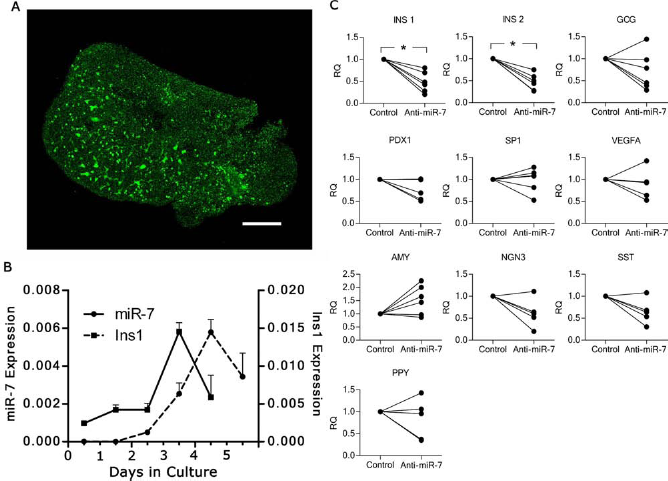

To corroborate our previous in vitro experiments and evaluate visually the changes in the number of insulin-producing cells throughout the course of the investigation, the buds from transgenic mice expressing GFP under control of the mouse insulin 1 promoter were incubated with MO anti-miR-7 or MO control (Fig. 9). Transgenic GFP mice are undistinguishable from normal animals with respect to glucose tolerance and pancreatic insulin content (17). As expected, the number of GFP-expressing β-cells in explants treated with MO anti-miR-7 was reduced more than 55% after only 2 days in culture (Fig. 9).
Inhibition of miR-7 in pancreatic buds of mouse insulin 1 promoter-GFP transgenic mice. Pancreatic buds (e12) from mouse insulin-1 promotor-GFP transgenic mice were cultured for 2 days in the presence of MO anti-miR-7, MO control, or remained untreated: (A) confocal microscopy and (B) quantification of GFP fluorescence by morphometric analysis. Comparisons between multiple groups were done with one-way ANOVA with Kruskal–Wallis analysis of variance with Dunn's post hoc test for non-Gaussian distribution. *p < 0.05. Original magnification: x10. Scale bar: 200 μm.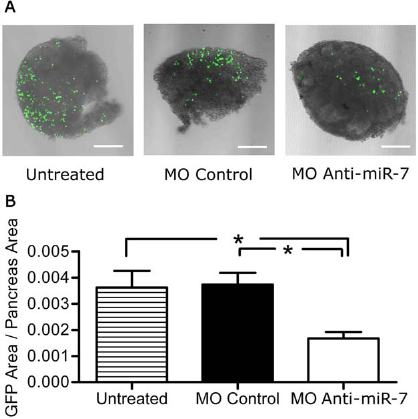
Discussion
To elucidate the role of miR-7 in the development of endocrine pancreas, we performed loss-of-function studies in mice. The generation of knockout mice to study the role of miR-7 in pancreatic development is technically complex due to the multiple gene copies of miR-7 located on different chromosomes. Because of this limitation, we developed an in vivo miR-7 knockdown model by cardiac injection of antisense miR-7 MO into the mouse embryos under ultrasound guidance. Prenatal, in utero ultrasound-guided intervention allows for the efficient delivery of compounds to the fetus by means of a minimally invasive approach (14,34,43).
Here we demonstrate that in utero delivery of MO anti-miR-7 at early stages of pancreatic embryogenesis impairs insulin expression and the number of insulin-expressing cells. It is important to notice that the experiments presented in this study are related to a single infusion of anti-miR-7 MO. MO are more resistant to the action of endonucleases than regular oligonucleotides. However, determining the actual half-life is extremely challenging. In our hands, we could detect the labeled MO in transduced tissue still at 72 h (data not shown). Thus, we assume that it is active during this period. However, the multiple injections might have an augmented effect.
Since it is known that fetus lacking pancreas can go to term (24), our observation that 26 μg/embryo injection of MO anti-miR-7 (but not MO control) results in embryonic death might be indicative of a specific and central role of miR-7 that reaches far beyond a local action on pancreas. Embryos treated with lower dose of MO anti-miR-7 were fully viable, even though the TUNEL assay still showed extensive cell death throughout the pancreatic tissue. Two weeks after birth, the inhibition of miR-7 during embryonic life resulted in reduction of insulin content in the pancreas and lower number of insulin-producing cells. This was paralleled by an impaired metabolic function of in vivo glucose challenge. No other apparent phenotype was observed in the newborn animals treated in utero (e10.5) with MO anti-miR-7. At this stage, qRT-PCR revealed specific inhibition of insulin and Pdx1 genes (Fig. 6E) but not Glut-2 gene, which is regulated by Pdx1 in a dose-dependent manner (1), indicating that further inhibition of Pdx1 is necessary to affect Glut-2 expression. The recent reports indicate that miR-7 is not expressed only in β-cells but in other human endocrine cell types such as α- and δ-cells (10). Interestingly the expression of Gcg at mRNA level decreased indicating that miR-7 might modulate α-cells as well. We have not determined if the number of α-cells was affected. Nevertheless these observations are consistent with the hypothesis that the treatment of embryos with MO anti-miR-7 could also affect vital functions in the brain, including hormone levels in the pituitary gland, which contains high concentration of miR-7 (30). Inhibition of miR-7 might affect the production of growth hormone and/or prolactin both produced by pituitary gland, which has a critical effect on islet growth and β-cell proliferation (7).
The in vitro confirmation that MO anti-miR-7 treatment of cultured pancreatic buds induces changes in their insulin expression suggests that the effect seen in vivo is in part due to a specific local action on the endocrine compartment of the pancreas. This is a reasonable assumption because the pancreatic β-cells exhibit miR-7 levels much higher than the surrounding parenchyma (Fig. 1C). Even though the decrease in expression of other mature endocrine genes (Gcg, Sst, and Ppy) was not statistically significant in vitro, there appears to be a trend suggestive of their downregulation (Fig. 7C), which might potentially become significant with the higher number of experiments (n). In vitro, inhibition of miR-7 leads to death of the developing insulin producing cells (Fig. 8), yielding a phenotype of reduced β-cell numbers in the pancreatic buds, suggesting that the presence of miR-7 is critical for β-cell viability.
These studies expand our understanding of new molecular pathways involved in development of the endocrine pancreas. Modulation of miR-7 may become a valuable strategy to compensate β-cell loss in diabetes. It could be applied ex vivo (39) to generate insulin-producing cells from stem cells or as an in vivo tool for regenerative medicine, targeting pancreatic β-cells (26).
Footnotes
Acknowledgments
This work was made possible thanks to the generous support of the Diabetes Research Institute Foundation (www.diabetesresearch.org). We thank Dr. Alessia Fornoni, M.D., Ph.D. (Diabetes Research Institute), for the critical reading of the manuscript and George MacNamara, Ph.D., and Kevin Johnson from the Diabetes Research Institute's Imaging and Histology Core for their excellent technical assistance. The authors declare no conflicts of interest.