
Abstract
There is worldwide enthusiasm for the prospect of some kind of cellular transplant therapy for repair of failing organs. The olfactory mucosa of a patient's nose is easily biopsied to provide a ready source of multipotent cells. In this article we address practical issues pertinent to using olfactory neural stem cells for tissue repair. These cells are emerging as potentially most significant candidates for human tissue repair strategies. Previously we have shown that stem cells from olfactory mucosa are multipotent. As well, we have recently published three potential clinical applications. Their expression of dopaminergic markers in vitro and in a Parkinson's rat transplant model has been demonstrated. Their conversion to chondrogenic phenotype in vitro and in vivo has also been described, as has their transplant into a rat model of cardiac infarction. Here we examine in detail the biology of the olfactory neural stem cell using the rat as our animal model cell source. We establish its presence by examining self-renewal capacity and for phenotypic acquisition in inductive circumstances. We determine its frequency within the cell population and show that our culture system selects for this putative stem cell. Our studies demonstrate that adult olfactory stem cells, when transplanted into an environmental niche different from that of their origin, are able to demonstrate multipotency by acquiring the phenotype of the resident cells. We investigate how immediate the instruction need be. We test the hypothesis that olfactory neurospheres contain stem cells whose capacity for differentiation is triggered by signals of the immediate environmental niche. Significantly, of importance to any tissue regeneration endeavor, stem cell numbers were shown to be enriched by our culture methods. This was confirmed whether measured by sphere-forming capacity or differentiation response rate.
Introduction
There is worldwide enthusiasm for the prospect of some kind of cellular transplant therapy for repair of failing organs (7,82,84). Recently we have demonstrated the prospect of autologous tissue repair for Parkinson's disease (69), herniated disc (68), and heart attack (61). Using a patient's own neural stem cells derived by simple nasal biopsy and expanded in vitro to supply cellular substrate for the assisted healing of damaged or diseased tissue is an attractive scenario.
Potential of Olfactory-Derived Stem Cells
The olfactory epithelium must undergo vigorous neurogenesis and continual replacement of sensory neurons throughout adult life (10,29,57). We work on the potential use of the putative olfactory stem cell in tissue transplant therapies and have demonstrated a broad multipotency of these cells (67). They reconstituted the hematopoietic system of irradiated rats (67) and made nonneural cell types in vitro in transwell coculture experiments (67). They are an attractive source of autologous stem cells because of the ease with which they can be obtained by simple biopsy of as little as 10 mm3 of tissue from a patient's nose (67).
Recently their expression of dopaminergic markers in various growth factor conditions and on protein attachment substrates has been demonstrated (69) as has their conversion to chondrogenic phenotype in vitro and in vivo (68). In a rat model of cardiac infarction transplantation of neurosphere-derived cells from adult rat olfactory mucosa restored heart rate, with other trends towards improvement in other measures of ventricular function indicated (61). Importantly, donor-derived cells engrafted in the transplanted cardiac ventricle and expressed cardiac contractile proteins.
The identity of the olfactory stem cell in vivo has been long debated (13,17,36,49). Importantly, it is not to be confused with the olfactory ensheathing cell (a type of glial cell that ensheathes olfactory neurons), which has been applied to a number of spinal repair protocols (5,51,54–56). For the purposes of this article we define the olfactory stem cell pragmatically as the neurosphere-forming cell in olfactory mucosal cultures. These cells have recently been shown useful for studying disease of neurogenic origin (60,87). We examine basic aspects of the biology of the olfactory neural stem cell with the view to fully exploit its potential in cell transplant therapy scenarios. We examine its potential for self-renewal and for phenotypic expression in various inductive circumstances. We determine its frequency within the cell population and establish a culture system for selecting this putative stem cell.
Many studies have demonstrated that adult stem cells, when transplanted into an environmental niche different from that of their origin, are able to acquire the phenotype of the resident cells (6,9,20,22,37,39,48,59,63,73). How immediate need the instruction be? Here we test the hypothesis that rat olfactory neurospheres contain multipotent stem cells whose capacity for differentiation is triggered by signals of the immediate cellular environment. The relative importance of cell–cell contact or soluble factors was examined by direct contact cocultures, and transwell cocultures, in which cells were physically separated but shared a common medium.
Materials and Methods
Animals
Female adult (6 weeks old) Sprague-Dawley rats were obtained from the Royal Brisbane Hospital Animal House (Queensland, Australia). Animals were killed by lethal injection (pentobarbitone sodium) in accordance with the guidelines of Griffith University Animal Ethics Committee and the National Health and Medical Research Council of Australia.
Olfactory Mucosa Cultures
Rat olfactory epithelium (24) and lamina propria (5) was prepared as previously described. The olfactory mucosa was dissected free from the nasal cavity and washed twice in Hanks balanced salt solution (HBSS). The mucosa was incubated for 45 min at 37°C in 2.4 U/ml dispase II solution. The olfactory epithelium was then carefully separated from the underlying lamina propria using a microspatula. It was removed and washed in HBSS, then incubated at 37°C for 10 min in 0.25% collagenase IA solution in DMEM-ITS [Dulbecco's modified Eagles medium/Ham's nutrient mixture F-12 (DMEM) supplemented with insulin, transferrin and selenium (ITS), and penicillin and streptomycin]. The tissue was dissociated by gentle trituration and the collagenase activity stopped by adding HBSS. The dissociated cells were then centrifuged and resuspended in DMEM-FCS [DMEM with penicillin and streptomycin, plus 10% heat-inactivated fetal calf serum (FCS)]. After the removal of the lamina propria the remaining olfactory epithelium was collected in HBSS and gently triturated to separate the cells. The dispersed cells were then centrifuged and resuspended in DMEM-FCS. The lamina propria cells and olfactory epithelium cells were then combined and plated on uncoated plastic dishes.
Defined Serum-Free Sphere-Forming Conditions
Primary olfactory mucosa cultures were expanded as a monolayer in DMEM-FCS until confluent, usually 8–12 days. Once confluent, the cells were passaged by using a 2:5 solution of 0.25% trypsin, 0.02% EDTA in HBSS and incubating at 37°C in 5% CO2 for 10 min, after which DMEM-FCS was added to inhibit the trypsin. The detached cells were collected, centrifuged, and resuspended in DMEM-ITS. Cell counting was carried out in triplicate, using a hemocytometer. Cells were plated in serum-free conditions onto plastic wells that had been coated with poly-l-lysine (PLL; Sigma p6282; 0.85 μg/cm2) for 3–4 h. For all the sphere formation experiments three wells were established for each condition per experiment and the experiments repeated three times.
For assay of sphere formation, cells were plated at 50,000 cells/cm2 in DMEM-ITS, DMEM-ITS + 50 ng/ ml epidermal growth factor (EGF), DMEM-ITS + 25 ng/ml basic fibroblast growth factor-2 (FGF2), or DMEM-ITS + 50 ng/ml EGF and 25 ng/ml FGF2. The media was changed every 2 days at which time sphere counts were carried out.
For the cell density assay of sphere formation, cells were plated at 40,000, 50,000, 60,000, 70,000, 80,000, and 90,000 cells/cm2 in DMEM-ITS + EGF and FGF2. In order to be classified arbitrarily as a “sphere” an aggregate measured at least 100 μm in diameter, and was spherical and optically dense.
Formation of Second/Next Generation Neurospheres
After neurospheres had formed, the wells were gently washed three to four times with DMEM-ITS to collect floating and loosely attached neurospheres. They were dissociated in dispase 2.4U/ml and 10 μg/ml DNase on an orbital shaker at 37°C, 100 rpm for 15 min after which they were gently triturated 15 times. This procedure was repeated twice. The dissociated neurospheres were washed in HBSS and resuspended in DMEM-FCS and plated onto plastic dishes. In the same way as the primary cultures, the dissociated neurosphere cells were proliferated adherently to confluence in DMEM-FCS. This was called “expansion phase.” Expanded first-generation neurospheres were passaged as described above, replated onto PLL-coated wells in EGF and FGF2, at 5,000, 10,000, 20,000, 30,000, 40,000, and 50,000 cells/ cm2, and sphere counts and media changes were carried out every 2 days. Similarly, in turn, later generation neurospheres were collected, dissociated, expanded, and then plated at 5,000 to 50,000 cells/cm2.
Clonal Analysis of First- and Sixth-Generation Neurospheres
Neurospheres were generated and dissociated as described above; the dissociated cells were labeled with PKH26 red fluorescent cell linker kit, as per instructions, and plated onto wells (96-well plates) coated with collagen IV (5 μg/cm2) at a planned density of 0.5 cells/ well in DMEM-FCS. This procedure was aimed at minimizing the number of wells containing more than one cell. After 24 h wells were examined to confirm which had single cells plated. Single cells were then expanded to confluence and passaged to increase cell numbers. When there were sufficient cells, clones were passaged and plated in sphere forming conditions.
Cytospinning
Neurospheres were dissociated as previously described and cells were then cytospun at 1100 rpm for 5 min onto SuperFrost Plus microscope slides (Menzel-Glaser) using the SIGMA cytology rotor as per manufacturer's instructions at a density of ~10,000 cells/ slide.
Immunochemistry
Cells were fixed in 4% paraformaldehyde for 7 min, washed, and stored in phosphate-buffered saline (PBS) + 0.1% sodium azide. Wells were blocked in 10% goat serum, 2% bovine serum albumin (BSA), 0.1% Triton X-100 in PBS for 1 h at room temperature. Primary antibodies were: rabbit polyclonals—β-tubulin-III (Covance, 0.33 μg/ml), glial fibrillary acidic protein (GFAP) (Dakocytomation, 6 μg/ml), β-1-integrin (Santa Cruz Biotechnology, 4 μg/ml), tyrosine kinase receptor-1 (TrkA) (Santa Cruz Biotechnology, 1 μg/ml), tyrosine kinase receptor-2 (TrkB) (Santa Cruz Biotechnology, 1 μg/ml), tyrosine kinase receptor-3 (TrkC) (Santa Cruz Biotechnology, 1 μg/ml), hairy enhancer of split-5 (Hes5) (Chemicon, 10 μg/ml), and hairy enhancer of split-1 (Hes1) (Chemicon, 10 μg/ml); mouse monoclonals— CD90 (Thy1) (Serotec, 10 μg/ml), CD117 (C-Kit) (Zymed Laboratories Inc., 5 μg/ml), nestin (Chemicon, 5.2 μg/ml), neurofilament 200 (Sigma, 1.11 mg/ml), P75 (low-affinity neurotrophin receptor) (Neubody, 1 μg/ ml), intercellular adhesion molecule-1 (ICAM-1) (Phar-Mingen, 10 μg/ml). Primary antibodies were applied in blocking solution for 1 h at room temperature, after which cells were washed in PBS. Secondary antibodies, goat anti-mouse IgG conjugated with AlexaFluor 594/ 488 and goat anti-rabbit IgG conjugated with AlexaFluor 568/488, were applied at 5 μg/ml, for 1 h at room temperature. The cells were washed in PBS, the nuclei were stained with 1 mM Hoechst 33342 for 10 min, and the cells were washed again.
Phenotype of Neurophere Cells (Expanding in Monolayer)
Dissociated first-, second-, third-, and sixth-generation sphere cells were plated onto uncoated eight-well chamber slides in DMEM-FCS at a cell density of 5,000 cells/well. The media was changed after 2 days and the cells were fixed the following day (day 3).
RNA Isolation and RT-PCR
Whole first-generation neurospheres were harvested and RNA extracted using the guanidinium thiocyanate-phenol-chloroform method (19) followed by DNase I (Ambion) digestion of genomic DNA. Reverse transcription was carried out using SuperScript III (Invitrogen) with oligo(dT12-18) primers (Invitrogen) after which the cDNA was treated with RNase H (Invitrogen). The PCR reaction mix included: 1x PCR buffer, 1.5 mM MgCl2, 0.2 mM DNTPs, 1 U Taq DNA polymerase plus 0.3 μM of both forward and reverse primers. Cycle profile was 5 min at 95°C, 40 cycles of 30 s at 95°C, 60 s at annealing temperature (Table 1), 60 s at 72°C followed by 10 min at 72°C.
Conditions for PCR Reactions, Primer Sequences, and PCR Products for Various Genes

Nestin, Hes1 (hairy enhancer of split-1), Hes5 (hairy enhancer of split-5), Notch-1, CD90 (Thy-1), TrkA (tyrosine kinase receptor-1), TrkB (tyrosine kinase receptor-2), TrkC (tyrosine kinase receptor-3), P75 (low-affinity neurotrophin receptor), Lif-r (leukemia inhibitory factor receptor), CD117 (c-Kit), Oct-4 (octamer-binding transcription factor 4), Pax-6 (paired box protein-6), ICAM-1 or CD54 (intercellular adhesion molecule-1), β-1-integrin or CD29, CD133, CD135, and presenilin-1.
Establishing Skeletal Muscle Cultures
Skeletal muscle tissues were diced into 200-μm2 fragments using a McIlwain tissue chopper. The tissue pieces were collected in 10 ml of HBSS in a 50-ml tube and centrifuged for 5 min at 300 x g. The tissue pieces were disaggregated by resuspending in 6 ml of a 0.042% trypsin and 0.25 mg/ml collagenase IA solution in HBSS and incubating in an orbital shaker at 37°C, 110 rpm, for 30 min. The tissues were triturated vigorously prior to deactivating the trypsin. Cells were resuspended in HBSS and the larger tissue pieces allowed to settle for a few minutes. The supernatant was collected and passed through a 40-μm filter. Tissue pieces were subjected to this treatment several times.
The dissociated skeletal muscle cells were then collected by centrifugation and plated in DMEM-FCS onto uncoated plastic flasks for 2 h to allow fibroblasts to attach. The unattached cells were then collected and plated onto uncoated glass eight-well chamber slides at a cell density of 2,000 cells/well (2,860 cells/cm2).
3T3-L1 Differentiation
Dexamethasone (DEX), isobutyl-1-methyl-xanthine (IBMX), biotin, insulin, and oil red O were purchased from Sigma (St Louis, MO, USA). Transwell cell culture inserts (0.6 cm2) with a pore diameter of 0.4 μm were purchased from Millipore (Billerica, MA, USA). 3T3-L1 cells were a generous donation from Dr. Jon Whitehead and Dr. Louise Hutley (Cell Signalling Group, Department of Diabetes & Endocrinology, University of Queensland). Nonconfluent (80%) 3T3-L1 mouse fibroblast preadipocyte cell line cultures were passaged using a 1:5 solution of 0.25% trypsin, 0.02% EDTA in HBSS and incubated at 37°C in 5% CO2 for 2 min. 3T3-L1 cells were seeded at ~5,000 cells/cm2 onto plastic flasks and allowed to proliferate until 2 or 3 days postconfluent in DMEM-FCS. Then medium was changed to differentiation medium: DMEM-FCS with the addition of 0.22 μM DEX, 0.1 μg/ml biotin, 2 μg/ml insulin, and 0.5 mM IBMX. The cells were cultured in differentiation medium for 3 days after which the medium was changed to postdifferentiation medium (DMEM-FCS plus 2 μg/ml insulin) and the cells cultured for a further 3 days. The medium was changed to normal DMEM-FCS and the cells cultured for a further 6 days.
Green Fluorescent Protein (GFP)-Positive, Dissociated Neurosphere Cells Cocultured with 3T3-L1 Cells
3T3-L1 cells were passaged onto chamber slides at 7,000 cells/cm2 without neurosphere cells, or with GFP-labeled neurosphere cells at 100, 200, or 500 cells/well (142 cells/cm2, 284 cells/cm2, and 714 cells/cm2, respectively). In separate wells control cultures were established with only GFP-labeled neurosphere cells. The control cells were plated at the same cell densities as cocultured wells. Both control and cocultured wells were initially plated in DMEM-FCS until 3 days postconfluent at which time the medium was changed to differentiation medium. The cells were cultured in differentiation medium for 3 days, postdifferentiation medium for 3 days, and finally in normal DMEM-FCS for a further 6 days. Immunocytochemistry for glucose transporter-4 (Glut-4) was carried out after the cells were fixed in 4% paraformaldehyde. Following Glut-4 staining, lipids were stained using oil red O.
3T3-L1 Transwell Induction Assay
As described above, cell culture inserts were coated with collagen and seeded with 3T3-L1 cells at 25,000 cells/cm2 in DMEM-FCS. Unlabelled dissociated first-, second-, and sixth-generation neurospheres were plated beneath the inserts at 1,000 cells/well (526 cells/cm2), 2,500 cells/well (1,315 cells/cm2), 5,000 cells/well (2,631 cells/cm2), 10,000 cells/well (5,263 cells/cm2), 20,000 cells/well (10,526 cells/cm2), and 30,000 cells/well (15,789 cells/cm2) in DMEM-FCS. The cells were cultured until the 3T3-L1 cells were 3 days postconfluent at which time the medium was changed to differentiation medium and the cells cultured for 3 days.
After 3 days the inserts were replaced with new collagen-coated inserts that had been seeded with 3T3-L1 cells 3 days after the initial cells were plated. The new postconfluent 3T3-L1 cells, and the dissociated neurosphere cells beneath them, were again cultured in differentiation medium for 3 days. After differentiation the medium was replaced with postdifferentiation medium for 3 days and finally normal DMEM-FCS for a further 6 days. The cells were then fixed in 4% paraformaldehyde and immunocytochemistry for Glut-4 was carried out followed by oil red O staining for lipids.
Oil Red O Staining
Oil red O stain is a lysochrome (lipid soluble dye) used to detect triglycerides. Oil red O (0.74 g) was dissolved in 200 ml of isopropanol and mixed overnight at 4°C. The filtered “stock” solution was stored at 4°C. The oil red O “working” solution was prepared by mixing 3 parts stock to 2 parts HBSS and leaving the solution to stand overnight at 4°C followed by a filtration step. Cultured cells were washed in PBS prior to adding the lipid stain for 2 h at room temperature, after which the wells were washed twice in PBS.
Statistical Methods
Data were recorded using Microsoft Excel and analyzed using Graphpad Prism software. Cumulative sphere formation numbers were assessed using one-way ANOVA. Phenotype assessments for sphere and “expanded” cultures over generations were analyzed using one-way repeated measures ANOVA. A probability of 0.05 was taken as the minimum significant difference in respect of the mean. Bonferroni post hoc tests were applied to test rejected null hypotheses. Gene expression was compared between sphere and expanded cultures using two-tailed t-test. Phenotypes of clones (both first generation and sixth generation) were assessed by one-way ANOVA followed by Tukey's Multiple Comparison Test of Pairs. Phenotypes of first-generation clones were compared to phenotypes of sixth-generation clones using two-way ANOVA with Bonferroni posttests. Clones were compared with nonclones for each gene expression level using two-way ANOVA and Bonferroni posttests. Increased sphere-forming capacity between clonal generations was assessed by application of a chi-square test. Increase in adipocyte differentiation was assessed with one-way ANOVA and Bonferroni posttest.
Results
Growing Olfactory Neurospheres
Defined Growth Factor Conditions and Optimal First-Generation Sphere Formation
Expanded primary olfactory mucosa cultures, plated onto PLL-coated wells, were able to form more neurospheres per well in combination of EGF and FGF2 than either growth factor alone or media without any growth factors (Fig. 1A). In all conditions it was found that there were very few neurospheres formed after 2 days in culture. However, 2 days later the number of neurospheres in growth factor-containing medium reached its peak (day 4, 200 neurospheres/well) (Fig. 1A). Over the successive 8 days the numbers of neurospheres per well declined steadily as neurospheres detached and were removed.

Formation of first- through sixth-generation neurospheres. (A) Formation of neurospheres from expanded primary olfactory mucosa cells in growth factor free medium (ITS), epidermal growth factor (EGF), and basic fibroblast growth factor-2 (FGF2), EGF or FGF2. (B) The formation of neurospheres from “expanded” primary olfactory mucosa cells cultured in EGF and FGF2 at various cell plating densities (from 40,000 to 90,000 cells/cm2). (C) The formation of sixth-generation neurospheres from dissociated expanded fifth-generation neurospheres cultured in EGF and FGF2 at various cell plating densities (from 20,000 to 50,000 cell/ cm2). (D) Plot showing a distillation of data detailed above to show the relative enrichment (p = 0.0002) of sphere formation as a function of generation of cultures subjected to sphere-forming conditions.
Cell Density and Formation of First-Generation Neurospheres
When expanded primary olfactory mucosa cultures were plated at 40,000, 50,000, 60,000, 70,000, 80,000, and 90,000 cells/cm2 on PLL-coated wells in EGF and FGF2, a concentration curve for optimal sphere formation was observed (Fig. 1B) with the most favorable condition being a plating density of 50,000 cells/ cm2. The maximum number of neurospheres per well was reached after 4 days (237 neurospheres/well); the same decline in neurosphere numbers over the succeeding 8 days was also observed.
Increasing Sphere Formation
Similar analyses were carried out for the formation of third-and sixth-generation neurospheres (Fig. 1C). The number of neurospheres (≥ 100 μm in diameter) produced was calculated across generations as the number of neurospheres arising from 20,000 cells plated. Floating spheres were collected and counted every 2 days; the sum of these was then added to those remaining attached on day 12; this sum was then expressed per 20,000 cells originally plated. There was a trend towards increased sphere producing cells (%) with each passing generation: generations 1, 0.48%; 3, 1.06%; 6, 1.45% (p = 0.0002) (Fig. 1D). The pattern of sphere formation for sixth-generation neurospheres is demonstrated in Fig. 2E–H.

Formation of olfactory neurospheres. (A–D) Formation of first-generation neurospheres in epidermal growth factor (EGF) and basic fibroblast growth factor-2 (FGF2) on plastic wells coated with poly-l-lysine (neurosphere-forming conditions) at day 1 (A), day 2 (B), day 4 (C), and day 15 (D). (E–H) Formation of sixth-generation neurospheres under neurosphere-forming conditions at day 1 (E), day 2 (F), day 4 (G), and day 15 (H). Scale bar: 100 μm. Non-neurosphere-forming cells have proliferated in first-generation cultures, while in the sixth-generation cultures there are few cells not participating in neurosphere formation. Bottom panels: Theoretical neurosphere yield over the six generations (if all cells were cultured), with intervening “expansion” cultures (neurospheres ≥ 100 μm in diameter) represents a cell yield greater than 35 population doublings since initial cell harvest from the olfactory mucosa.
RT-PCR Analysis of First-Generation Sphere Phenotype
Whole first-generation neurospheres were harvested, mRNA extracted, RT-PCR carried out, and products sequenced (Fig. 3, Table 2). From this study it was found that the first-generation neurospheres expressed TrkA, TrkC, P75, TrkB, presenilin-1∗, leukemia inhibitory factor receptor (Lifr)∗, Hes1, ICAM-1, CD90, β-1-integrin, notch-1∗, and Hes5. The RT-PCR also showed that the neurospheres were negative for CD117 (c-Kit), octamer-binding transcription factor-4 (Oct-4), paired box protein-6 (Pax-6), CD104 (β-4-integrin), CD133, and CD135. Where antibodies were available confirmation of mRNA expression at protein level was confirmed with immunocytochemistry (except those with ∗; Table 2).
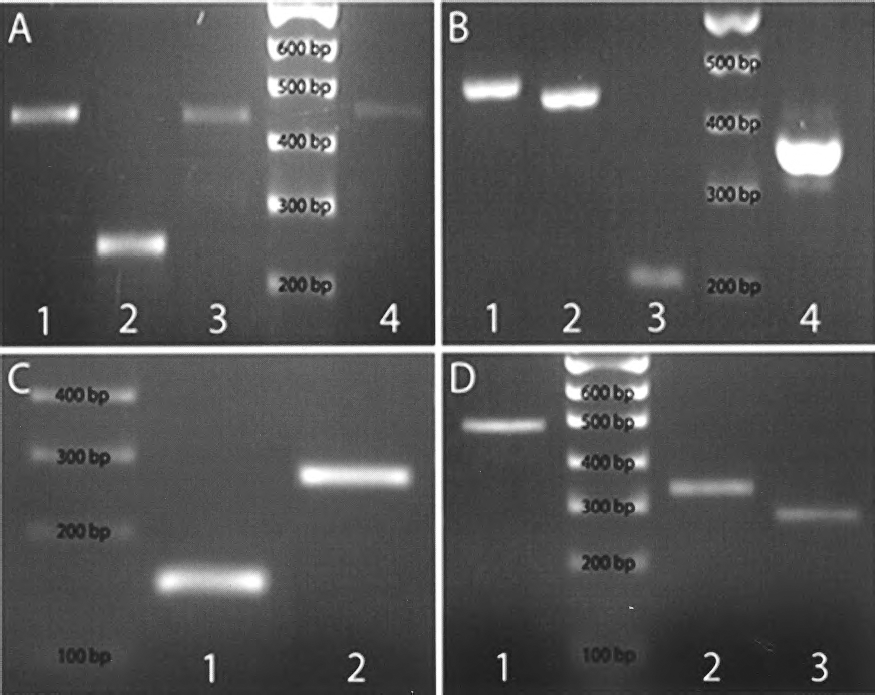
Reverse transcriptase-polymerase chain reaction (RT-PCR) analysis of first-generation spheres. (A) Lane 1: tyrosine kinase receptor-1 (TrkA) (484 bp), lane 2: tyrosine kinase receptor-3 (TrkC) (246 bp), lane 3: low-affinity neurotrophin receptor (P75) (428 bp), and lane 4: tyrosine kinase receptor-2 (TrkB) (443 bp). (B) Lane 1: presenilin-1 (460 bp), lane 2: leukemia inhibitory factor receptor (Lifr) (437 bp), lane 3: hairy enhancer of split-1 (Hes1) (208 bp), and lane 4: intercellular adhesion molecule-1 (ICAM-1 or CD54) (351 bp). (C) Lane 1: nestin (159 bp) and lane 2: Thy-1 (CD90) (275 bp). (D) Lane 1: β-1-integrin (CD29) (487 bp), lane 2: notch-1 (328 bp), and lane 3: hairy enhancer of split-5 (Hes5) (274 bp).
Summary of mRNA and Protein Expression in First-Generation Neurospheres

Positive mRNA expression was evaluated by polymerase chain reaction (PCR) and protein expression assessed by immunocytochemistry (ICC). PCR products were confirmed by sequencing: nestin, CD 117 (c-Kit), Hes1 (hairy enhancer of split 1), Hes5 (hairy enhancer of split 5), CD90 (Thy1.1), TrkA (tyrosine kinase receptor-1), TrkB (tyrosine kinase receptor-2), TrkC (tyrosine kinase receptor-3), P75 (low-affinity neurotrophin receptor), Oct-4 (octamer-binding transcription factor 4), Pax-6 (paired box protein-6), Lif-r (leukemia inhibitory factor receptor), CD29 (β-1-integrin), CD104 (β-4-integrin), CD133 (prominin 1), CD135, intercellular adhesion molecule-1 (ICAM-1) or CD54, presenilin-1, and notch-1.
Sphere Phenotype Remained Constant
First-, second-, third-, and sixth-generation neurospheres were dissociated, cytospun, and assessed for their quantitative expression of different markers using immunofluorescence. From these experiments (Figs. 4 and 5A) it was found that the phenotype of the neurospheres remained relatively constant across the generations (repeated measuressures one-way ANOVA for each marker across four generations; means were not significantly different, p > 0.05).

Phenotype of dissociated neurospheres and expanding neurospheres. (A, B) Cytospun dissociated first-generation sphere cells immunopositive for nestin, green (A) and β-1-integrin, green (B). (C, D) Dissociated first-generation neurospheres expanded in serum containing media for 3 days labeled with nestin, red (C) and P75 (low-affinity neurotrophin receptor), red (D). Dissociated sixth-generation neurospheres expanded in serum containing media for 3 days immunostained for GFAP (glial fibrillary acidic protein), green (E) and β-1-integrin, green (F). Nuclei were labeled blue using Hoechst. Scale bar: 30 μm. (G, I) Culture of GFP (green fluorescent protein)-positive, dissociated neurosphere cells with rat neonatal skeletal muscle cells. Cell(s) expressing GFP (G) incorporated into a myotube expressing skeletal muscle myosin, red (H), merged in (I). Scale bar: 30 μm.

Comparison of the phenotype of neurospheres and dissociated expanding sphere cells across the generations. (A) Phenotype of dissociated spheres expressed as the percentage of positive cells. GFAP, glial fibrillary acidic protein; NST, nestin, bTubulin-III, β-tubulin III; P75, low-affinity neurotrophin receptor; b1integrin, β-1-integrin; ICAM-1, intercellular adhesion molecule 1; Hes1, hairy enhancer of split 1; NF, neurofilament; Hes5, hairy enhancer of split 5. (B) Phenotype of dissociated sphere cells expanded in serum containing media for 3 days expressed as the percentage of positive cells. n = 3 for all trials.
Phenotype of Expanding Dissociated Sphere Cells
When dissociated neurospheres were expanded on plastic as a monolayer in serum containing media it was found that there were some significant fluctuations in the expression of some markers (Figs. 4 and 5B). Cells growing out adherently in “expanding” conditions vary significantly more in collective phenotype compared to those that constitute olfactory neurospheres themselves. Phenotype for all markers was not consistent with generation [repeated measures one way ANOVA for each marker across four generations; means were significantly different (p < 0.05): nestin, p = 0.018; GFAP, p = 0.001; β-tubulin III, p = 0.0003; β-1-integrin, p < 0.0001; ICAM-1, p = 0.0075; P75, p = 0.0329]. When individual gene markers were compared from the two culture methods, three were expressed at a significantly lower level (p < 0.05) than in expanded cultures: GFAP (p < 0.0001), β-1-integrin (p = 0.000341), and ICAM-1 (p < 0.0001).
Formation of Clonal Neurospheres
Single cells plated clonally under sphere-forming conditions were unable to generate neurospheres. Therefore, experiments were tried in which clonally derived cell populations were then subjected to sphere-forming conditions. Labeled cells from first- and sixth-generation neurospheres were plated at a target density of 0.5 cells/well, and examined after 24 h for the presence of solitary cells. The phenotypes of dissociated clonal neurospheres from first and sixth generations were assessed for a panel of markers (Fig. 6). These neurospheres varied in proportional expression of phenotype with one first-generation clone (11A7) not expressing either neuronal marker. We used one-way ANOVA followed by Tukey's Multiple Comparison test of pairs to discern whether clonal spheres differed in phenotype (Fig. 6). Using this test, means for GFAP (p < 0.0001), β-1-integrin (p = 0.0214), Hes1 (p = 0.0151), and Hes5 (p = 0.0106) differed significantly in expression. We used two-way ANOVA and Bonferroni posttests to look for differences between clones of the two different generations. Using this test generation 1 differed in phenotype from generation 6 for the markers: nestin (p = 0.018); GFAP (p = 0.0089); β-1-integrin (p = 0.0244), and Hes5 (p = 0.0016).

Phenotype of dissociated clonally derived neurospheres expressed as the percentage of positive cells (clones 11A7 and 11A11 are first generation; clones 3D7 and 5F6 are sixth generation). NST, nestin; GFAP, glial fibrillary acidic protein; bTubulin III, β-tubulin III; NF, neurofilament; b1 integrin, β-1-integrin; Hes1, hairy enhancer of split 1; Hes5, hairy enhancer of split 5. Clone 11A7 displays no detectable neural phenotype.
Next it seemed relevant to ascertain whether the four clonal sphere types conformed to the nonclonal sphere groups. Applying two-way ANOVA, the mean expression of GFAP, Hes1, and Hes5 in clones differed from the nonclonal groups (p = 0.0002, p = 0.0281, and p = 0.0195, respectively). As well, there was a significant increase in the ability of sixth-generation clones to make neurospheres (Table 3). Application of a chi-square test to the data of Table 3 generated a value of p < 0.0001.
Generation of Clonal Neurospheres: First Versus Sixth Generation

Application of a chi-square test to the above data generated a value of p = 0.0001, indicating strong statistical significance.
Coculture Experiments
Skeletal Muscle
When dissociated olfactory neurosphere cells were plated with skeletal myoblasts that went on to differentiate into some multinucleated myotubes, GFP-positive segments could be seen. These were stained for the coexpression of skeletal myosin. A GFP-expressing myotube subsequently confirmed to express skeletal myosin is shown in Figure 3G–I.
Adipocyte Induction
Two days postconfluence 3T3-L1 cells were put into differentiation conditions for 3 days. Differentiation was apparent from the formation of small lipid bodies. The number of differentiated cells and the quantity of accumulated lipid increased during the postdifferentiation period (Fig. 7B). Fully differentiated adipocytes were often found clumped together in large clusters (Fig. 7C). Cells were immunostained in green for Glut-4, an adipocyte marker (Fig. 7C). Control immunocytochemistry, without primary antibody, showed no positive staining.
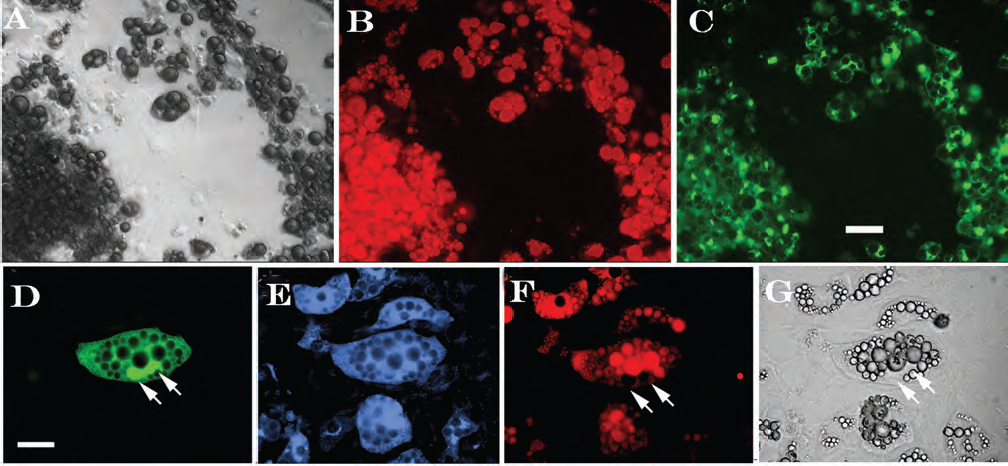
Top panels: differentiated 3T3-L1 cells. During the culture period numerous adipocytes formed usually in clumps. (A) Bright-field image of differentiated adipocytes. (B) Fluorescent image of cells with accumulated lipids stained red with oil red O. (C) Fluorescent image of adipocytes immunostained in green for glucose transporter-4 (Glut-4), an adipocyte marker. Scale bar: 50 μm. Lower panels: differentiation of GFP (green fluorescent protein)-positive neurosphere cells into adipocytes. By coculture with 3T3-L1 cells GFP-positive neurosphere cells (D) were found to be immunoreactive for the adipocyte marker Glut-4 (stained blue in E), accumulated lipid (stained red by oil red O in F), and displayed a typical adipocyte morphology (brightfield G). White arrows: lipid bodies. Scale bar: 30 μm.
When cocultured with 3T3-L1 cells GFP-positive dissociated neurosphere cells accumulated lipid and also expressed the adipocyte marker Glut-4, as shown in Figure 7D–G. Differentiated neurosphere cells were only distinguishable from differentiated 3T3-L1 adipocytes by their expression of GFP. In control cultures, none of the GFP-positive neurosphere cells differentiated into adipocytes. There was never any oil red O staining or Glut-4 immunoreactivity. Control immunocytochemistry, without primary antibody, showed no positive staining.
Transwell Adipocyte Differentiation
Using a transwell coculture assay in which neurosphere cells were exposed to a single round of differentiating 3T3-L1 cells, no differentiation was observed. Neurosphere cells exposed to successive rounds of differentiating 3T3-L1 cells differentiated into adipocytes. In this assay cells are not able to physically make contact. It was concluded that differentiation had taken place based upon the accumulation of lipid and expression of Glut-4 by dissociated neurosphere cells. Control immunocytochemistry showed no positive staining.
Comparison of Generations in Making Adipocytes
When exposed to successive rounds of differentiating 3T3-L1 cells, first-, second-, and sixth-generation neurosphere cells differentiated into adipocytes. The number of differentiated adipocytes increased with the generations (one-way ANOVA: p < 0.0001 comparing generation 1 with 6; Bonferroni posttest indicated that the result comparing Gen 1 and 2 could occur by chance) (Fig. 8). It was also calculated that approximately 0.66 ± 0.14% (n = 6) of sixth-generation neurosphere cells were capable of differentiating into adipocytes.

Increase in differentiation capability of first-, second-, and sixth-generation dissociated neurosphere cells into adipocytes. Dissociated neurosphere cells were cultured beneath 3T3-L1 cells growing on tissue culture inserts. The number of Glut-4- and oil red O-positive cells for each generation was counted.
Discussion
We have established that olfactory neural stem cells are capable of self-renewal and have the potency to differentiate into cells of different tissues. We have established that a clonally derived cell has this capacity. We have determined the proportion of such cells in the population and that these may be increased through generations in vitro. As well, we have established solutions to practical aspects of their culture and potential use in transplantation scenarios.
Self-Renewal
Our culture strategy involved expansion of cell numbers in a monolayer on plastic, subsequently plating these in sphere-forming conditions, selecting only neurospheres for the next generation of expansion, and then repeating this process. This method was successful at increasing the putative stem cell production for potential application with each successive neurosphere-forming cell generation.
Expansion and the Enrichment of Sphere-Forming Cells
The neurosphere yield (neurospheres ≥ 100 μm) over the six generations, and intervening expansion cultures, represents a cell yield greater than 35 population doublings since initial cell harvest from the olfactory mucosa (Fig. 2, lowest panel). Overall there was enrichment for sphere-forming cells across the generations (Fig. 1D). How are these sphere forming cells enriched The collective cell phenotype of neurospheres remains relatively constant across the generations but the phenotype of intervening expanding sphere-derived cells appears volatile. Neurospheres provide an environment for at least the maintenance of sphere-forming cells. Loss or disruption of this environment, in this case by mechanical and chemical dissociation, might result in a disruption of the maintenance of the sphere-forming population. Overall it is clear that cells growing out adherently in “expanding” conditions vary significantly more in collective phenotype compared to those that constitute olfactory neurospheres themselves. Whether the phenotype of expanding sphere cells changes over the course of the expansion period or not, somehow over time it provides an environment that allows enrichment of sphere-forming cells. As the generations of expanding sphere cells increase, so there is an increase in sphere formation with each generation.
Expansion of olfactory dissociated sphere cells in adherent culture on plastic in the presence of fetal calf serum would be described by many as providing a differentiating environment. Virtually every protocol for the culture of brain-derived neurospheres uses suspension culture and mitogens: EGF and/or FGF2. Induction of differentiation is done by subsequent adherent culture in the presence of FCS after withdrawal of mitogens. It could be that in providing FCS and expansion on plastic that we are encouraging differentiation of precursors into more differentiated phenotypes while maintaining genuine stem cells within the population. In this way the actual sphere-forming cells are allowed to proliferate while downstream precursors are provoked into differentiation and are therefore unable to participate in further sphere formation. In this regard, Reynolds and coworkers have provided evidence that in suspension culture brain-derived neurospheres can be formed from both stem cells and precursors (53,77). They have devised a method to enrich sphere propagation and longevity by removing small neurospheres (putatively derived from precursors rather than stem cells) from successive generations.
Self-Renewal of Olfactory Sphere-Forming Cells
The phenotype of the neurospheres remained relatively constant across the generations. This uniformity suggests that there is a cell or group of cells that are able to respond to the sphere-forming conditions in a consistent way in each generation. The maintenance of this population through six exposures to sphere formation conditions and six expansion phases requires significant self-renewal potential (Fig. 2). The self-renewal potential of dissociated sphere cells was also determined by clonal analysis. In this study cells were plated onto collagen-coated wells at clonal density and allowed to expand in serum-containing media. When clonal cells from first-and sixth-generation neurospheres had expanded it was found that they were able to form secondary neurospheres when plated in sphere-forming conditions, indicating the potential of these clones to self-renew. Interestingly, individual clones generated neurospheres with individual potency. One clone did not contain any cells that displayed neuronal phenotype (for the markers tested). This supports the view of Reynolds and Rietze (77), which suggests neurospheres can form from progenitors as well as stem cells.
Our statistical analysis has assessed that spheres in polyclonal cultures across multiple generations maintain a collectively consistent phenotype whereas cells growing out adherently in “expanding” conditions vary significantly as well as having a lower expression of some markers: GFAP, β-1-integrin, and ICAM-1. Phenotype for all markers tested from “expanded” cultures was not consistent with generation. With regard to clonal cultures, first-generation clonal spheres differed from sixth-generation clonal spheres. However, with the small number of clones tested it seemed more relevant to ascertain how well data for the four clones fitted with data for spheres in general (i.e., whether the four clonal spheres conformed to the nonclonal sphere groups). The expression of GFAP, Hes1, and Hes5 in clones differed from the nonclonal groups (p < 0.05). A logical conclusion from these data is that spheres descendant from individual cells vary in collective phenotype but spheres of a population are collectively predictable. It would seem that clonal spheres, according to the measure of collective cell phenotype, exhibit dynamics that are “highly sensitive to initial conditions.” Considering the issues of cell culture with its multiplicity of variables as well as the individual cell's complement of “determinants” at the time of cloning or sphere formation, this seems plausible. On this point it may be mentioned the findings of the Huang group investigating cell dynamics and network theory, who found that even clonal cell populations vary significantly in gene expression at the level of individual cells (15). Subcloning individual cells according to divergence of expression resulted in populations that took many cell divisions to normalize gene expression. Therefore, for the practical purpose of tissue repair by cell transplantation, it seems that derivation of clonal populations of donor cells may be counterproductive.
As well it would seem that we have selected cells more adapted to in vitro conditions. There was a substantial increase in the ability of sixth-generation clones to make neurospheres (Table 3).
We have demonstrated the self-renewal potential of olfactory stem cells by indicating their ability to generate neurospheres using clonal cell lines and by generating and enriching for neurospheres across numerous generations. Interestingly, we have observed that neurospheres can form from one cell or coalesce from several but it is clear that formation of olfactory neurospheres requires environmental contribution from multiple cells.
Multipotency
Differentiation of GFP-Positive Neurosphere Cells to Express a Skeletal Muscle Marker
Myotubes are syncytia that typically form from the fusion of mononuclear myoblasts. When cultured with neonatal skeletal muscle cells GFP-positive neurosphere cells were present within a skeletal muscle myosin-positive myotube. The formation of a myotube, myogenesis, is a relatively well-defined process divided into distinct stages that include: specification, differentiation, cell–cell recognition, adhesion, alignment, and finally membrane fusion (88). A review of the factors involved in regulating myogenesis revealed that some also have a role in neurogenesis (3,40,70,89). An endorsement of the potentiality of neural progenitor cells to acquire the myogenic lineage is the work of Rietz et al. (80) and Galli and coworkers (28). Utilizing the C2C12 myoblast cell line (91), both these studies demonstrated that adult neural stem cells, derived from the brain, were accepted as partners in myotube formation.
Induction of Adipocyte Phenotype
The 3T3-L1 preadipocyte cell line was established in 1974 by Green and Meuth after they observed that resting cultures of the embryonic mouse fibroblast cell line 3T3 contained clusters of cells that contained lipid droplets (30). 3T3-L1 cells are a cell line that is now known to differentiate consistently into adipocytes in a predictable and extremely robust manner in well-defined culture conditions. Therefore, coculture with this cell line provided an ideal environment to test for the differentiation of neurosphere cells into a specific cell type. Here it was demonstrated that GFP-positive dissociated neurosphere cells differentiated into adipocytes in a direct contact coculture situation. It was also found that secreted factors produced by 3T3-L1 cells were sufficient to induce the differentiation of neurosphere cells into adipocytes using a transwell coculture assay.
Stem Cell Numbers Increased with Each Generation
That olfactory neurosphere-derived cells differentiated into adipocytes is a significant finding. That they did this in the absence of cell–cell contact is also significant, but most striking of all is the clear result that with each passing generation of olfactory neurospheres cultivated according to our method there was an enrichment of cells able to respond to the soluble signals emanating from the adipocyte coculture. This result fully supports the enrichment seen in sphere-forming capability in the growth experiments.
Technical Aspects of Olfactory Stem Cell Cultures
Expansion of Olfactory Mucosa
Initially we attempted to culture dissociated rat olfactory mucosa directly onto PLL-coated wells in EGF and FGF2, but sphere formation was sporadic and inconsistent. An initial cell expansion step on plastic in 10% serum-containing media was found to be beneficial. Cell numbers increased and more experiments could be carried out with minimal animal use.
The Highest Number of Neurospheres Formed with EGF and FGF2
EGF has been demonstrated to be a mitogen for neural stem cells (21,78,86) as has FGF2 (32,43,75,79), and both factors in combination have been used to expand neural stem cells (31,45,90). Hence, both factors were tested together and in isolation, to determine how olfactory stem cells respond. When expanded olfactory mucosa was passaged onto PLL at high cell density in growth factor-free media (ITS), EGF, FGF2, or EGF and FGF2 it was found that EGF and FGF2 together resulted in the most neurospheres forming. The observation that the number of neurospheres formed in EGF and FGF2 is not cumulative of the number for the relative concentration of each growth factor alone would suggest that each factor is not acting exclusively on a particular cell type. Rather, it would suggest that there is an overlap between the EGF- and FGF2-responsive cells. This result is not dissimilar to that obtained by Tropepe and colleagues (18) investigating neural stem cell populations derived from E8.5 mouse telencephalon where FGF2-responsive stem cells emerged first followed by an EGF-responsive population. In vitro both populations could respond to either mitogen and their combined effect was additive. A more recent investigation has ascribed the apparent additive effect when both FGF2 and EGF are included to initial commitment of neural and glial precursors swelling cell numbers (58). They attribute self-renewal mainly to FGF2. In our experiment ITS media failed to generate significant numbers of neurospheres, indicating that high plating density and the PLL coating alone cannot account for sphere formation; mitogenic assistance is required.
Cell Density
While neural stem cells derived from the brain are able to form neurospheres in clonal conditions (32,65), neither freshly dissociated olfactory mucosa nor dissociated sphere cells were able to proliferate at clonal dilution in sphere-forming conditions, highlighting the importance of cell–cell interaction in sphere formation. This could have been due to a need for cell contact or for trophic factor exchange. The importance of cell density in the formation of neurospheres has been emphasized by the observation that neural stem cell proliferation is increased when cells are grown at high density in EGF and FGF2 (66). Therefore, when expanded primary olfactory mucosa cultures were plated in sphere-forming conditions, a range of cell plating densities was tested to determine the optimal cell density for sphere formation.
Comparison of Generations
The concentration curve observed for the formation of first-generation neurospheres at different cell densities indicates that the optimal cell density is 50,000 cells/cm2 and that there is a slight decrease in sphere numbers at lower cell densities. Similarly, there is a decrease in the number of neurospheres as the cell density increases. However, the formation of later generation neurospheres was characterized by an overall increase in sphere numbers, indicating a significant enrichment of sphere forming cells. Similar to other generations there was a dramatic drop in sphere numbers above a particular cell density.
Olfactory Sphere Populations Displayed a Consistent Phenotype
Olfactory neurospheres contain a heterogeneous population of cells, including committed precursors or progenitor cells, neurons, glia, and presumably stem cells. Here we show that these neurospheres contain nestin-positive precursor or progenitor cells. While it is apparent that these nestin-positive cells are able to give rise to both neurons (β-tubulin-III+ and neurofilament+) and glia (GFAP+), it is evident that olfactory neurospheres generated in the conditions established here predominantly give rise to glial cells, not neurons, in contrast to the studies reported by Roisen and colleagues (81,93), where β-tubulin-III+ precursors prevailed in the culture conditions they described. While their role as mitogens for neural progenitors seems clear, the role of EGF and FGF2 in determining the fate of proliferating progenitors is less clear. FGF2, for example, has been demonstrated to be proneurogenic in some situations (62,74) and in others to inhibit neurogenesis and promote gliogenesis (64,75,92). Similarly, EGF has been reported to induce both neural (23,76) and glial (11,47) fates.
In our hands EGF and FGF2 in combination produce olfactory precursors that differentiate predominantly into glial cells. A possible mechanism for the inhibition of neuronal differentiation or, alternately, the promotion of glial differentiation is indicated by the high expression of the repressor-type basic helix–loop–helix (bHLH) genes Hes1 and Hes5 in olfactory neurospheres. Hes1 and Hes5 have been shown to be highly expressed by neural stem cells (1,2,83) and are essential for their proliferation and maintenance (14,38,71). Hes1 and Hes5 have also been demonstrated to be inhibitors of neuronal differentiation by antagonizing the activator-type bHLH genes, which include mammalian achaete-schute homolog 1 (Mash1), mammalian atonal protein homolog (Math), and neurogenin (16,83). A more proactive role in the promotion of gliogenesis is suggested by the increased generation of Muller glia in the retina with the mis-expression of Hes1 and Hes5 (25,35,72). Hes1 and Hes5 expression is regulated by notch (expressed by first-generation neurospheres) signaling (41,72), which is also known to inhibit neuronal differentiation and maintain neural stem cells (26). Interestingly, it has been demonstrated that notch signaling may promote differentiation of glia from neural progenitors in the embryonic forebrain (27). Similarly, Tanigaki and coworkers (85) have shown an instructive role for notch-1 in the induction of an astroglial fate in FGF2-responsive adult hippocampus-derived neural progenitors. It has also been found that first-generation neurospheres express presenilin-1, which is important for notch signaling in the central nervous system (4,34,46). Taken as a whole the presenilin–notch–Hes1/Hes5 pathway may maintain the self-renewal of the olfactory stem cells found in neurospheres, as well as promote a glial lineage in preference to a neuronal lineage.
Similar to notch signaling, the expression of β-1-integrin is associated with maintaining stem cells in an undifferentiated state (8,12,50,94). Interestingly, β-1-integrin is expressed in the horizontal basal cells of the olfactory epithelium (13); however, its expression has been more thoroughly examined in the epidermis. In the skin it has been demonstrated that selecting for cells with the highest expression of β-1-integrin enriches for stem cells (42,44) and that a decrease in β-1-integrin expression is associated with a depletion of stem cells and an increase in differentiation (33,94). The high expression of β-1-integrin in olfactory neurospheres may indicate a defining role in the stem cell niche and as well promote cell adhesion to maintain the structure of the sphere.
Reported Use of Olfactory Stem Cells in Human Transplant
There are many internet sites from a number of countries of private clinics offering cell or tissue transplant therapy for humans with varying disease or injury disabilities. Quite a proportion of these offer “olfactory”-derived tissue or cells. Usually bona fide publications are referred to in the advertisement as credentials for the procedures. In some cases the cells are nonautologous fetal cells. Some offer autologous transplant of uncultured tissue. There are usually no scientific publications by the groups; only medical staff are named and no credentials or protocols for preparation or culture of the tissue are given. The Carlos Lima group of Portugal have scientific credibility and have recently published a human trial using olfactory autografts for spinal repair (52). The group says they cultured olfactory stem cells for six of the patients but no protocols are published for the culture.
Conclusion
We have addressed pragmatic issues pertinent to using olfactory neural stem cells for tissue repair. The olfactory neural stem cell is emerging as potentially a most significant candidate of all possible sources for human tissue repair strategies. It can be derived from adult humans; a patient's own cells are readily available from minimally invasive biopsy; it can be grown in defined media; source cell numbers present a higher percentage capability than iPS cells (for instance); it does not produce teratomas upon xenotransplantation (ES and iPS cells); it has performed well in preclinical models of disease and transplantation—hematopoietic, Parkinson's, herniated disc, and heart attack (61,67–69); and it seems to emulate a wound-healing process where the cells acquire appropriate phenotype in an apparently orderly fashion over time.