
Abstract
Three-dimensional (3D) gelatin sponge (GS) scaffolds were constructed by ensheathing GS with a thin film of poly-(lactide-co-glycolide) (PLGA). Rat bone marrow-derived mesenchymal stem cells (MSCs) were isolated, cultured, and then seeded to the scaffolds. Distribution of cells and cell growth, survival, and proliferation within the scaffolds were then determined. Immunofluorescence and Western blot analysis were employed to detect the deposition of fibronectin to the scaffolds on day 3 and day 7 of culture. Scaffolds with or without MSCs were then transplanted into the transected rat spinal cord. One or 8 weeks following transplantation, cavity areas, activated macrophages/microglia, expression of TNF-α and IL-1β, and neovascularization within the grafts were examined and quantified. Deposition of fibronectin (FN) and expression of vascular endothelial growth factor (VEGF) and hypoxia-inducible factor-1α (HIF-1α) as potential inducing factors for angiogenesis were also examined. Results showed that 3D GS scaffolds allowed MSCs to adhere, survive, and proliferate and also FN to deposit. In vivo transplantation experiments demonstrated that these scaffolds were biocompatible, and MSCs seeded to the scaffolds played an important role in attenuating inflammation, promoting angiogenesis, and reducing cavity formation. Therefore, the GS scaffolds with MSCs may serve as promising supporting transplants for repairing spinal cord injury.
Keywords
Introduction
One of the main objectives of tissue engineering is to identify suitable scaffolds for the attachment of specific cell types in the wound-healing process. During spinal cord injury, primary and secondary insults often result in neuronal death, axonal disconnection, and sensoriomotor dysfunction. Glial scars, vast cavities, and hostile microenvironment become physical and chemical impediments for the recovery of the damaged neurons and oligodendrocytes, and hence the regeneration of axons (17). Under these pathophysiological situations, a scaffold may then be required to serve primarily as a bridge to fill the gap between the cut ends of the ruptured spinal cord, and also as a vehicle to deliver cells and biomolecules for cell replacement or modification of the unfavorable microenvironment.
Gelatin is a cross-linked form of collagen, which is abundant in the connective tissue of animals. Most natural gelatin originates from the skin or the bone of animals, and is mainly composed of type I collagen. It has been reported that the implantation of plain collagen filaments to a gap of up to 5 mm following spinal cord damage resulted in axonal regeneration within the transected spinal cord and restoration of functions (58). Collagen is a natural component of the extracellular matrix (42). It can be made in a spongy form to become a favorable material for cell attachment (22,35,39). The porous three-dimensional (3D) structure of this gelatin sponge can provide a relatively wide surface area for repairing spinal cord injury (SCI). However, gelatin sponge is mechanically weak, and due to its hydrophilic property, it is easy to swell, causing deformation of the scaffold and compression to the surrounding tissue (16).
Mesenchymal stem cells (MSCs) are a promising cell type in tissue engineering for their convenient acquisition, easy expansion in vitro, and relatively free of histocompatibility problems and ethical concerns. MSCs have been employed in the repair of injuries in bone, cartilage, tendon, and muscle (43). After Woodbury et al. found that populations and clonal lines of MSCs were able to express ectodermal, mesodermal, and endodermal markers and possessed a broad range of differentiation plasticity, using MSCs as a potential cell source to cure SCI has become a clinically important research area (55). Studies of MSC transplantation into the injured spinal cord also showed that, besides replacing damaged cells, MSCs may also have other roles to play during the recovery, such as immunosuppression, anti-inflammation, angiogenesis, neuroprotection, and establishment of a favorable microenvironment for axonal regeneration (41).
One effective way for MSCs to establish a favorable microenvironment is to secrete fibronectin (FN) (30). FN is a glycoprotein found in many extracellular matrices (ECMs) and also in the blood plasma. It is involved in the cell attachment and migration through its interactions with cell surface receptors (2). It was reported that MSCs adhere to different ECM proteins with varying affinity (fibronectin > collagen I ≥ collagen IV ≥ vitronectin > laminin-1) (47). Hence, it raises the probability that, by coating the substrate with FN, more MSCs become adhered to the scaffold through interactions with their receptors. Another important property of FN is its affinity to collagen. The collagen binding site on FN has been localized to the 42-kDa gelatin binding domain (GBD) (4). This property has led to a simple one-step isolation procedure of FN from blood plasma on a gelatin affinity column (15). Since the formation of fibronectin–collagen complexes is mainly attributed to hydro-phobic interactions, this binding is relatively strong (20).
This work aimed to design 3D gelatin sponge scaffolds for MSCs to adhere, survive, and proliferate. Considering the mechanical weakness of gelatin sponge (GS), we constructed a poly-(lactide-co-glycolide) (PLGA) film to ensheath GS so as to prevent the 3D GS scaffold from collapsing or deforming. The PLGA film in the form of a cylinder also restricted the extent of swelling of GS. In order to reduce the acid degradation product from PLGA as demonstrated in our previous work (23), the PLGA cylinder was fabricated with a thickness of as thin as 0.02 mm. We then transplanted these scaffolds with or without MSCs to the injured site of the transected spinal cord of rats. Our observation focused on whether the 3D GS scaffolds would affect the cellular behaviors of MSCs, which would in turn affect the deposition of FN to the scaffolds, and most importantly whether these engineered scaffolds could promote tissue restoration after spinal cord injury.
Materials and Methods
Isolation and Culture of MSCs
MSCs were isolated as previously described (60) from normal regular Sprague-Dawley (for in vitro experiments) or green fluorescent protein (GFP) transgenic Sprague-Dawley rats (Osaka University, Osaka, Japan), which express ubiquitously GFP in all their tissues (for in vivo cell tracing). Briefly, 1-week-old rats were sacrificed and their femurs were flushed with and then cultured in the low-glucose Dulbecco's modified Eagle's medium (L-DMEM) (Gibco) supplemented with 10% fetal bovine serum (FBS) (TBD Co, Tianjin, China) and 4 mM L-glutamine (Invitrogen) in an incubator with 5% CO2 at 37°C. When the adherent cells grew to 80% confluence they were passaged (1:3) into different culture flasks. MSCs of passages 3–6 were employed for the study.
Preparation of 3D Gelatin Sponge Scaffolds for Cell Cultures
A 5% solution of 85:15 PLGA dissolved in dichloromethane was poured into Teflon-coated horizontal molds. After evaporation of the organic solvent in a fume hood for 48 h, a thin film of 0.02 mm thick was formed (Fig. 1A). The PLGA film was completely wrapped around a stainless steel bar of a diameter of 3 mm and two edges of the film were sealed with acetone. The bar was then removed from the film, and a hollow cylindrical tube was formed by the PLGA film (Fig. 1B). This PLGA cylindrical tube was cut transversely into smaller rings of 2 mm in length (Fig. 1B) and sterilized in 75% ethanol for 15 min followed by rinsing in D-Hank's solution three times. GS (Nanjin Jinling Co., Nanjin, China) (Fig. 1C) was also shaped into short tubes of 3 mm in diameter and 2 mm in length. The PLGA rings were stuffed with GS tubes and these scaffolds were stored in a desiccated and germ-free environment before use. Scaffolds could be also fabricated into different sizes by wrapping the PLGA film on stainless steel bars of different diameters and filling the PLGA rings with GS. GS tubes with or without the ensheathing PLGA film were examined for their extent of swelling by soaking them in PBS for 7 days. Before MSCs were seeded to the scaffolds, the scaffolds were soaked with the culture medium for 10 min and then excessive fluid was absorbed by a Waterman filter paper. A total of 1 × 10⁵ cells in 10 μl culture medium were seeded to each GS scaffold. In order to facilitate cell adhesion, scaffolds with implanted MSCs were incubated in humidified atmosphere at 37°C for 15 min in a 24-well plate (one scaffold per well) before being submerged in 500 μl culture medium. The culture medium was changed every 2 days.

Preparation of 3D gelatin sponge (GS) scaffolds (A–E) and their extent of swelling with or without a poly-(lactide-co-glycolide) (PLGA) cylindrical film on their periphery (F). (A) A PLGA film with a thickness of 0.02 mm. (B) A hollow PLGA cylindrical tube and a ring with a diameter of 3 mm. (C) Commercially available GS. (D) A hollow PLGA ring and a piece of GS, both of which are of 3 mm in diameter and 2 mm in height. (E) GS scaffolds in different diameters and heights. (F) Differences in the extent of swelling between GS with (left sample) or without (right sample) a PLGA cylindrical film on their periphery. GS swells up to about twofold without the confinement of the PLGA film. Scale bar (F): 5 mm.
Cell Proliferation and Cell Viability
Cell proliferation in scaffolds was evaluated by crystal violet staining (47) 1, 2, 3, 5, 7, and 9 days after seeding. Briefly, scaffolds with implanted MSCs (n = 5 in each group) were gently rinsed two times by warm D-Hank's solution and then fixed in 4% paraformaldehyde. Then 200 μl 0.02% crystal violet (Sigma) was added to each well to stain the scaffolds for 0.5 h before they were washed with distilled water three times and then air dried. Stained scaffolds were cut into small pieces and cells were lysed by 200 μl 1% sodium dodecyl sulphate. OD of the solution was measured at 570 nm and a cell growth curve was drawn. To subtract the background absorption of the dye by the material, plain GS scaffolds without cells were also examined and their OD values were averaged and used as background staining.
Cell viability was measured by 3-(4,5-dimethylthiazol-2-yl)-2,5-diphenyltetrazolium bromide (MTT) assay as described previously (34) 1, 2, 3, 5, 7, and 9 days after seeding. Briefly, 5 mg/ml MTT (Sigma) in 100 μl culture medium was added to each well (n = 5). After 4 h in an incubator at 37°C, every scaffold was cut into small pieces and transferred to another culture well containing 200 μl dimethyl sulfoxide (DMSO). The culture plate was shaken for 30 min to allow complete dissolution of the blue dye. OD value of each scaffold was measured at 490 nm, and a cell viability curve was drawn. The background absorption was subtracted after measuring the average OD of plain GS scaffolds without cells.
Morphological Examination
The histological appearance of MSCs within the scaffolds 7 days after culture was examined with light microscopy while their cellular morphology was studied with scanning (SEM) and transmission electron microscopy (TEM). For light microscopic studies, cryostat sections of 30-μm-thick were stained with routine hematoxylin and eosin (H&E) staining. For SEM examination, scaffolds with or without MSCs were firstly washed three times with PBS, fixed in 2.5% glutaraldehyde overnight, dehydrated with a series of graded ethanol, and then freeze dried for 2 days. The dried samples were coated with gold and examined under a scanning electron microscope (Philips XL30 FEG). For TEM examination, scaffolds were fixed with 2.5% glutaraldehyde at 4°C for 1 h and osmicated with 1% osmic acid for 1 h. Scaffolds were dehydrated through graded ethanol and embedded in Epon overnight, followed by polymerization at 60°C for 48 h. Ultrathin sections were cut with an ultramicrotome (Reichert E, Co., Vienna, Austria) and examined under a transmission electron microscope (Philips CM 10, Eindhoven, Holland).
Cell Distribution, Survival, and Proliferation Within GS Scaffolds
Cell distribution, survival, and proliferation within GS scaffolds were evaluated after Hoechst33342 staining, calcein-AM (calcein acetoxymethyl ester)/ethidium homodimer staining, and bromodeoxyuridine (BrdU) labeling, respectively. To determine whether the locations of cells within the scaffolds affected cell growth, survival, and proliferation, the central and peripheral parts of the scaffolds were selected for study. The first to the fifth sections were regarded as peripheral while the 46th to the 50th sections as central. On the seventh day, 10 μg/ml Hoechst33342 (Sigma), 2 μM calcein-AM, and 4 μM ethidium homodimer (Viability/Cytotoxicity Assay Kit for Live & Dead Animal Cells, Biotium, USA) were added to each well. After washes with PBS, scaffolds were fixed with 4% paraformaldehyde and serial cryostat sections at 30 μm were cut. Peripheral and central sections were selected and examined under an epifluorescence microscope (DMIRB, Leica, Germany). Hoechst 33342-labeled cells were counted with a 1.40 × 1.00-mm2 counting frame. The survival rate was calculated by determining the percentage of live cells (green fluorescent) over the total cell number (green and red fluorescent cells). At least five counting areas (including four corners and one center) were imaged and counted for each section.
For BrdU labeling, 10 μM BrdU (Sigma) was added to the culture medium on the sixth day. After 24 h in culture, the scaffolds were rinsed, fixed in 4% paraformaldehyde, and then cut at 30 μm with a cryostat. Peripheral and central sections were immunofluorescently stained for BrdU. The DNA of cells was denatured by incubation in 2N HCl at 37°C for 30 min. After washing three times with 0.01 M PBS, sections were blocked with 10% (v/v) goat normal serum. The mouse anti-BrdU monoclonal antibody (1:600, Sigma) and the fluorescein isothiocyanate (FITC)-labeled goat anti-mouse IgG (1:400, Jackson ImmunoResearch) were used as the primary and secondary antibodies, respectively. Negative controls were carried out by replacing the primary antibody with PBS. After washes with PBS, cells were counterstained with propidium iodide (PI) (Roche, Switzerland). The sections were examined under an epifluorescence microscope. For each section, at least five random fields were examined.
Detection of Fibronectin (FN) Deposition to the Scaffolds
For the study of FN secretion and distribution, the scaffolds were fixed on the third and seventh day with 4% paraformaldehyde. Cryosections of 30 μm thick were immunofluorescently stained for FN. After blocking with 1% bovine serum albumin (BSA), the rabbit anti-FN antibody (1:300, Boster, Wuhan, China) was used as the primary antibody and Cy3-tagged goat anti-rabbit IgG as the secondary antibody (1:400, Jackson ImmunoResearch). The sections were counterstained with Hochst33342. Nonspecific binding was determined by staining without using the primary antibody. To determine whether FN from serum also deposited to the scaffolds, cell-free GS scaffolds that had been immersed in the serum containing culture medium or D-Hank's solution for 7 days were examined for the FN deposition to the scaffolds.
The amount of FN deposited to the GS scaffolds was determined by electrophoresis and Western blot analysis. After 3 and 7 days in culture, three scaffolds from each group were rinsed three times in warm D-Hank's solution to remove the residual culture medium and then cut into small pieces by eye scissors. These small pieces were immersed in 100 μl lysis buffer containing 1 μl protease inhibitor cocktails for 20 min on ice and dissociated by an ultrasonic homogenizer to dissolve intracellular and extracellular proteins. The lysates were centrifuged at 14,000 rpm for 20 min at 4°C. After a Bradford protein assay (Bio-Rad, USA), equal amounts of the protein suspension were loaded on a 10% polyacrylamide gel, separated by gel electrophoresis, and transferred onto a polyvinylidene fluoride (PVDF) membrane (Millipore, Massachusetts, USA). After blocking with 10% nonfat milk in TBST (25 mM Tris-HCl, 0.15 M NaCl, and 0.1% Tween 20) for 1 h, membranes were incubated with the anti-FN antibody (1:5000, Boster) at 4°C overnight. After washes with PBS plus 0.1% Tween-20, membranes were incubated with the horseradish peroxidase (HRP)-conjugated secondary antibody (Jackson ImmunoResearch) for 2 h. Finally, membranes were washed again and the bands were detected with an ECL Western blot substrate kit (Pierce, Illinois, USA). Plain MSCs digested and collected from culture flasks were also analyzed by Western blotting.
Spinal Cord Injury and Transplantation
To prepare the spinal cord injury model, adult female Sprague-Dawley rats (220–250 g, supplied by the experimental animal center of Sun Yat-sen University, China) were employed. The animals were anesthetized with 1% pentobarbital (30 mg/kg, IP). A laminectomy was carried out to expose the T10 and T11 spinal segments, and the dura was cut vertically with microforceps and microscissors. Angled microscissors were used to fully transect the spinal cord, and a 1.5-mm segment of the spinal cord at the level T10 was removed. The stumps were retracted to make a 2.0-mm gap in the spinal cord. Then, the GS scaffolds of 2.0 mm in length with MSCs (GS+MSCs group) at day 7 of culture or without MSCs (GS group) were used to fill up the gap. Rats without GS scaffold transplantation after a 1.5-mm spinal cord segment was removed were used as the operation control (SCI group). After the surgical incisions were sutured, the rats received extensive postoperation care including intramuscular injection of penicillin (50,000 U/kg/day) for 3 days and manual emiction two times daily for 2 months. All experimental protocols and animal handling procedures were approved by the Animal Care and Use Committee of Sun Yat-sen University, and were consistent with the National Institutes of Health Guide for the Care and Use of Laboratory Animals.
Tissue Processing
Animals were sacrificed at the end of 1 week or 8 weeks after transplantation. All rats were deeply anesthetized with 1% pentobarbital (40 mg/kg, IP) and transcardially perfused with normal saline containing 0.002% NaNO2 and 0.002% heparin, followed by the fixative containing 4% paraformaldehyde in 0.1 M PBS (pH 7.4). The spinal cord was dissected and postfixed for 24 h in the same fixative, and then placed in 30% phosphate-buffered sucrose at 4°C for 48 h, frozen and embedded in the optimum cutting temperature (OCT) compound (Sakura Finetek, Zoeterwoude, The Netherlands). The T8–T12 successive segments of the spinal cord were cut longitudinally. The thickness of all the sections was 30 μm.
Immunohistochemistry
Sections from the 1-week experiments were incubated with one of the following primary antibodies: mouse anti-CD68 (Sigma), rabbit anti-vWF (von Willebrand factor; Santa Cruz), rabbit anti-FN (Boster), rabbit anti-HIF-1α (Boster), or rabbit anti-VEGF (vascular endothelial growth factor; Boster) antibody at 4°C overnight and then with Cy3-tagged secondary antibodies (Jackson ImmunoResearch) at 1:400 at 37°C. Sections were examined under an epifluorescence microscope (Leica) or an argon and krypton laser scanning confocal imaging system (LSM 710, Zeiss, Germany) equipped with capture and photo processing software (Zen 2008, Zeiss). For double labeling of FN (rabbit anti-FN antibody, Boster) with platelet-endothelial cell adhesion molecule-1 (mouse anti-PECAM-1 or CD31 antibody, Boster) and CD68 (mouse anti-CD68 antibody, Sigma) with TNF (tumor necrosis factor; rabbit anti-TNF-α antibody, Boster) or interleukin (rabbit anti-IL-1β antibody, Bios, Beijng, China), Cy3- and aminomethylcoumarin acetate (AMCA)-conjugated secondary antibodies (Jackson ImmunoResearch) were used. In some of the sections, nuclei were counterstained with Hoechst33342.
Histological Quantification
To assess neovascularization of the injured or graft sites, Image-Pro Plus software (Media Cybernetics, Silver Spring, MD) was used as previously described (8). One in every five sections from each animal was processed. Five randomized 0.7 × 0.5-mm2 areas for each of the sections cut through the injured/graft sites were chosen and vWF-positive blood vessels were converted to an area of interest (AOI) and pixel area of each AOI was automatically calculated by the software. The density of staining for each image was then calculated by the ratio of the total pixels of AOI over the total pixels in each image.
For cavity areas analyses, one in every five of the whole series of sections from each animal was selected. The selected sections were stained with hematoxylin and eosin. Photographs of the stained sections were taken. The cavity areas of the spinal cord were also analyzed by Image-Pro Plus software as stated above. Cavities within 3 mm rostral or caudal to the graft site were measured, and those with a diameter less than 160 μm were excluded. The total areas of all the cavities in every section were averaged for every experimental case.
To investigate the infiltration of macrophage/microglia, one in every five sections from each animal was processed and CD68 immunofluorescent cells were counted. Five randomized 0.35 × 0.25-mm2 areas for each of the sections cut through either the injured/graft site or a region 3 mm rostral or caudal to the injured/graft site were selected from all groups. Photographs of the selected areas were taken with an epifluorescence microscope, and the total number of positive cells in each photograph was manually counted.
To evaluate the percentage of TNF-α- or IL-1β-positive cells among all CD68-positive cells, one in every five sections from each animal was double stained with immunofluorescence. Ten randomized 0.14 × 0.14-mm2 areas for each of the sections cut through the injured/graft site were selected from all groups. Photographs of the selected areas were taken with a confocal microscope, and the percentage of TNF-α and CD68 double positive and IL-1β and CD68 double positive cells in each photograph was manually counted.
Statistical Analysis
All statistical analyses were performed using the statistical software SPSS11.0. Data were reported as means ± SDs. When two sets of data were compared, a Student t-test was performed. When three sets of data were compared, one-way ANOVA with a LSD-t (equal variance assumed) or Dunnett's T3 (equal variance not assumed) post hoc test was performed. A value of p < 0.05 was used to denote statistical significance.
Results
Culture and Characterization of MSCs
After successive passages, cultured cells became relatively homogeneous in appearance. MSCs at P3 (third passage) under a phase contrast microscope showed fibroblast-like shapes and upon reaching 80% confluence, and they were arranged gyrately or radially.
Structural Features of 3D Gelatin Sponge Scaffolds
As described in the Materials and Methods section, GS scaffolds could be fabricated into different diameters or lengths to cover lesions of different sizes (Fig. 1A–E). The difference in the extent of swelling between GS scaffolds with and without the PLGA film was determined (Fig. 1F). Without the confinement of the PLGA cylindrical film, GS swelled up to about twofold of its original size. After MSCs were seeded to the scaffolds, numerous cells were found within the GS scaffold (Fig. 2A). SEM revealed the multiporous structure of the GS scaffold. Small pores communicated with each other and the pore sizes varied from several to hundreds μm (Fig. 2B). MSCs were found to attach to the GS scaffold using their cellular processes (Fig. 2C). The ultrastructure of MSCs under a TEM showed that MSCs possessed long tapering cellular processes (Fig. 2D).

Structural features of GS scaffolds and mesenchymal stem cells (MSCs) (A–D) and growth and viability of MSCs within the scaffold (E–F). (A) Hematoxylin and eosin (H&E) staining shows numerous cells (arrows) residing within the GS scaffold. (B) Scanning electron microscopy (SEM) reveals the multiporous structure of the GS scaffold. Small pores communicate with each other with diameters varying from dozens to hundreds μm. (C) SEM also reveals that MSCs adhere to the scaffold with their cellular processes, and one of the cells (boxed area) is magnified in the inset, showing multiple cellular processes of a MSC on the scaffold. (D) Transmission EM (TEM) shows the ultrastructure of a MSC within the scaffold. Note the long tapering cellular process of the MSC. (E) A growth curve of MSCs within the scaffold. Cells were stained with crystal violet and the OD of the solution measured at 570 nm. Cells grew and proliferated by nearly 3.3-fold after 9 days in culture. (F) Cell viability curve following the MTT test. Cells show good viability during the 9-day culture period. Scale bar (A): 40 μm.
Cell Growth Curve and Cell Viability Curve
Cells were stained with crystal violet, and the OD of the solution was measured at 570 nm. As shown in Figure 2E, the cell number was slightly decreased on the second day, but increased steadily from the third day, and the increase was then slowed down on the seventh day. The cell population was expanded to about 3.3-fold after 9 days in culture. Figure 2F shows the cell viability curve following the MTT test. The gradual increase in the cell viability indicated that cells grew under favorable conditions for 9 days in culture.
Even Distribution of MSCs Within GS Scaffolds
The distribution of MSCs within GS scaffolds was examined following Hoechst33342 nuclear staining of sections. Sections from the central and peripheral parts of the scaffold were selected. Low magnification showed that MSCs were distributed evenly throughout sections of the scaffold on the seventh day. The cell number per counting area (1.40 × 1.00 mm2) demonstrated that there was no quantitative difference between the peripheral and central parts of the scaffold (cell numbers: 235.12 ± 35.12 vs. 205.67 ± 53.48/counting area, p > 0.05, Student t-test, n = 5) (Fig. 3A, B). MSCs within the GS scaffold grew with a mean survival rate of 93.80 ± 3.11%. The survival rates for the peripheral (93.84 ± 4.13%) and central parts (93.77 ± 2.37%) exhibited no statistical difference (p > 0.05, Student t-test, n = 5) (Fig. 3C, D). Proliferating MSCs were also examined by BrdU labeling. The average proliferation rate within 24 h of culture within the scaffold was 71.21 ± 6.79% (n = 5), while the proliferation rates for the peripheral and central parts also exhibited no statistical difference (72.90 ± 6.29% vs. 69.53 ± 8.88%, p > 0.05, Student t-test, n = 5) (Fig. 3E, F). These findings suggested that, within the 2.0-mm-long scaffold, MSCs were found to distribute evenly within the scaffold and the locations of the implanted MSCs seemed to have no discernible influences on their survival and proliferation.

(A) Distribution of MSCs in the GS scaffold. On the seventh day, MSCs that are stained with Hochest33342 (two sample positive cells are indicated by the arrows), are distributed evenly within the scaffold (inset: an overall view of a section) (B) Bar chart showing the distribution of MSCs in the scaffold. No statistical difference in MSC distribution between the peripheral and central parts (NS, p > 0.05) is observed. (C) Survival of MSCs in the scaffold. On the seventh day, surviving cells labeled with calcein-AM (calcein acetoxymethyl ester) are green fluorescent (e.g., cells marked with an asterisk) while dead cells stained with ethidium homodimer are red fluorescent (arrow). (D) Bar chart showing the percentage of surviving MSCs in the peripheral and central parts of the scaffold. No statistical difference (NS, p > 0.05) is observed. (E) Proliferation of MSCs in the scaffold. Bromodeoxyuridine (BrdU)-positive cells are counterstained by propidium iodide (PI), so they exhibit yellow fluorescence (one sample positive cell is indicated by the arrow) while BrdU-negative cells are only stained by PI, which show red fluorescence (one sample positive cell is indicated by the arrowhead). (F) Bar chart showing the percentage of BrdU-positive cells. Again no statistical difference between the peripheral and central parts of the scaffold (NS, p > 0.05) is found. Scale bars: 80 μm (A), 1 mm (inset of A) or 40 μm (C, E).
FN Deposited to the Scaffold
FN deposition was revealed by immunofluorescence staining. On both day 3 and day 7, FN was deposited to the scaffold to form thread-like fluorescent fibers (Fig. 4A, B). Under high magnification (inset in Fig. 4A), filiform FN fibers secreted by MSCs were interconnected within the GS scaffold. On day 7, FN from the serum-containing culture medium was deposited to the cell-free GS scaffold and formed dimmer thread-like fluorescent fibers (Fig. 4C). GS scaffolds incubated in D-Hank's solution for 7 days did not show any FN deposition (Fig. 4D). Western blot analysis demonstrated an increased deposition of FN from day 3 to day 7 within the scaffolds. Furthermore, on both day 3 and day 7, the levels of FN deposition within the scaffolds were higher than that in the culture flasks where MSCs were grown in culture without implanting to the scaffolds (Fig. 4E).

Immunofluorescence and Western blot detection of fibronectin (FN). (A) On the third day, FN is deposited within the GS scaffold and shows thread-like red fluorescence (arrows). Under high magnification (inset), filiform FN fibers secreted by MSCs are interconnected within the GS scaffold (arrowhead). (B) On the seventh day, more FN is deposited to the GS scaffold (arrow). (C) Within the scaffold without MSCs, FN fibers are still observed deposited from the culture medium to the GS scaffold but they form dimmer thread-like fluorescence (arrows) on the seventh day. (D) The GS scaffold incubated in D-Hank's solution for 7 days did not show any FN deposition. (E) Western blot analysis on FN deposition by MSCs within the GS scaffold for 3 days, 7 days, or in culture flask for 7 days. FN deposition is higher on day 7 than day 3 within the scaffold, and the deposition within the scaffold on both day 3 and day 7 is higher than that in a culture flask by MSCs without scaffolds. Scale bars: 40 μm (A, B, C, D, and the inset of A).
When scaffolds with or without MSCs on day 7 of culture were transplanted into the injured spinal cord for 1 week, results showed that both the graft site and the penumbral zone expressed FN. FN was deposited within the scaffold in the GS+MSCs and GS groups and formed thread-like fluorescent fibers (Fig. 5A, B). More FN fibers seemed to have been deposited in the GS+MSCs group than the GS group because positive fluorescent fibers within the scaffold of the GS+MSCs group were thicker and more strongly fluorescent. Moreover, more FN fibers were deposited in the peripheral part than the central part of the graft in the GS group while in the GS+MSCs group the deposition of FN appeared even throughout the graft (Fig. 5A, B). Although FN deposition was also observed in the SCI group (Fig. 5C), the fluorescent fibers seemed dimmer than those in the GS+MSCs and GS groups.

Detection of FN deposition in the GS+MSCs (A), GS (B), and spinal cord injury (SCI; C) groups. In the GS+MSCs group, GFP-labeled MSCs within the graft were isolated from GFP transgenic rats and their locations are indicated by their green fluorescence. Although FN is deposited within the GS scaffold in both the GS+MSCs (arrows in A) and GS (arrows in B) groups, immunoreactive fibers (red fluorescent) seem to be thicker with more intense fluorescence in the GS+MSCs group than those in the GS group (comparing immunoreactive fibers in A and B). More FN fibers are deposited in the peripheral part than the central part of the graft in GS group (B), while in the GS+MSCs group FN fibers are evenly deposited throughout the graft (A). Asterisk in (A) indicates the transplanted cells in the surrounding tissue (rostral to the graft). FN is also deposited in the injured site of the SCI group, but the fluorescence in this site is dimmer (arrow in C) as compared with that in the GS+MSCs and GS groups. The dotted lines in (A) and (B) indicate the junction between the graft and host tissue while the dotted line in (C) is the transection line along which the spinal cord is transected. Scale bars: 80 μm.
Neovascularization
As shown in Figure 6A, B, regenerated blood vessels crossed the junction between the graft and the host tissue in the GS+MSCs and GS groups, suggesting that the scaffold transplanted to the injured spinal cord became vascularized. vWF immunoreactivity in the graft/injured sites revealed that there was a significant increase in angiogenesis in the GS+MSCs group (Fig. 6A) compared with the GS group (Fig. 6B) and the SCI group (Fig. 6C) (0.016 ± 0.004 vs. 0.002 ± 0.001 and 0.009 ± 0.003, p < 0.05, n = 6) (Fig 6D).
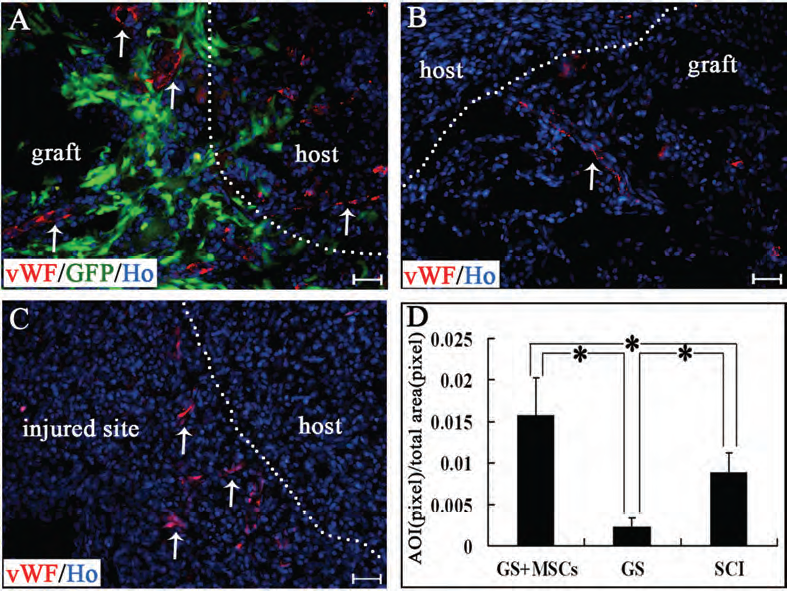
Von Willebrand factor (vWF) immunostaining showing neovascularization of the graft in the GS+MSCs (A) and GS (B) groups, and in the injured site of the SCI group (C). In (A), MSCs within the graft were isolated from green fluorescent protein (GFP) transgenic rats. Blood vessels (vWF immunoreactive, arrows in A, B, and C) within the graft or in the injured site are more abundant in the GS+MSCs group than GS and SCI groups. The bar chart (D) shows the percentage of the area of immunoreactivity (AOI) for vWF in the GS+MSCs, GS and SCI groups. Asterisk indicates statistical significance (p < 0.05, n = 6 for the GS+MSCs, GS, and SCI groups). The dotted lines in (A) and (B) indicate the junction between the graft and the host tissue while the dotted line in (C) is the transection line along which the spinal cord was transected. Scale bars: 40 μm.
MSCs were not observed to differentiate into endothelial cells in this study, although some GFP-positive cells were found adjacent to blood vessels (Fig. 7A). The 3D reconstruction revealed that the cell bodies and cellular processes of GFP-labeled cells were closely related to vWF-positive cells (Fig. 7B), and there were no GFP and vWF double positive cells. Colocalization of FN and CD31 with double immunofluorescence staining showed that FN was expressed outside the endothelial wall of blood vessels and formed a sheath-like structure (Fig. 7C), implicating that FN might have a role to play in angiogenesis. In addition, MSCs might also enhance angiogenesis through expression of VEGF. Only those MSCs surrounding blood vessels expressed VEGF, and the others far away from the vessels did not (Fig. 7D). HIF-1α, which modulates the expression of VEGF, was also expressed in transplanted MSCs. As shown in Figure 7E, a blood vessel, which possessed HIF-1α-immunoreactive endothelial cells (46), was surrounded by many GFP-expressing cells, which were also HIF-1α immunoreactive.

(A) Cross section showing relationship between transplanted MSCs (GFP labeled, green fluorescent) and blood vessels (wWF labeled, red fluorescent). An arrow indicates the location of a blood vessel. The inset shows a confocal image at high magnification of the GFP-positive cells adjacent to a blood vessel in the boxed area. Within the inset, an optical section cut through the whole thickness (30 μm) of the section along the red line is shown in the right rectangular box while another section cut along the green line is shown in the lower rectangular box. All these figures show that the GFP-labeled cells are not vWF immunoreactive. (B) 3D reconstruction by Zen 2008 software showing a GFP cell (arrowhead), which wraps around vWF-positive cells (arrow) with its cell body and processes. (C) Triple labeling of FN, GFP, and CD31 showing FN close to GFP-labeled cells and also forms a sheath-like structure on a blood vessel (arrows indicate the blood vessel). (D) Expression of vascular endothelial growth factor (VEGF; red fluorescent) in transplanted MSCs (green fluorescent). Only the GFP-positive cells closely surrounding to the blood vessels expressed VEGF while others did not. Arrowheads in the inset show expression of VEGF in GFP-labeled cells. (E) Colocalization of GFP with hypoxia inducible factor (HIF-1a) in the graft of the GS+MSCs group. Note that a blood vessel (∗), which is characterized by its ring shape and HIF-1α-immunoreactive endothelial cells with an oblate nucleus, is surrounded by many HIF-1α-immunoreactive and GFP-expressing cells (arrow). Scale bars: 40 μm (A, D), 20 μm (B, C, E), 10 μm (inset of D).
Cavity Formation
The ability of MSCs to reduce cavity formation and enhance tissue regeneration was also evaluated by H&E staining 8 weeks after the injury. In the GS+MSCs (Fig. 8A) and GS (Fig. 8B) groups, only small cavities were observed, and the graft was filled with regenerated tissues (Fig. 8A, B). However, large cavities appeared in the SCI group and the stumps were connected by a small amount of surrounding tissues (Fig. 8C). Quantification assessment of the total cavity area in the GS+MSCs group was 0.99 ± 0.44 mm2 (n = 6), which was significantly smaller than that in the GS (1.87 ± 0.51 mm2, n = 6, p < 0.05) (Fig. 8D) and SCI groups (3.26 ± 0.80 mm2, n = 6, p < 0.05) (Fig. 8D). These data demonstrated a significant reduction of cavity formation in the GS+MSCs group compared with other groups.

Cavity formation 8 weeks after spinal cord injury in the GS+MSCs, GS, and SCI groups (A–D) and infiltration of CD68-immunoreactive macrophages (red fluorescent cells) 1 week after spinal cord injury (E–I). H&E staining shows the cavity formation in the GS+MSCs (A), GS (B), and SCI (C) groups, and comparisons of cavity areas formed in different groups are shown in the bar chart (D). Asterisk indicates statistical significance (p < 0.05) whereas NS means no statistical significance. In the GS+MSCs (E, E″) and GS (F, F″) groups, high magnification of the boxed areas in (E) and (F) shows that the number of activated CD68-immunoreactive macrophages (arrow in E″ and F″, upper right inset of E and F, respectively) in the graft (outlined by two vertical dotted lines) are fewer than those in the surrounding tissue (arrows in E' and F', lower left inset of E and F, respectively). In the SCI group (G), high magnification of the boxed areas in (G) shows more activated CD68-immunoreactive macrophages (arrows in G″, upper right inset of G) in the injured site (two vertical dotted lines outline the injured area where infiltrating tissues are commonly found) compared with those in the graft of the GS+MSCs (E″) and GS (F″) groups. Comparisons of CD68-positive numbers per counting area (0.0875 mm2) in the surrounding tissue and graft/injured site are shown in the bar charts (H and I, respectively). Scale bars: 1 mm (A, B, C, E, F, G); 20μm in insets in (E, F, G).
Inflammation
Transection injury to the spinal cord commonly results in the infiltration of macrophages/microglia, which are characterized by their CD68 immunoreactivity and round morphology. In the present study, 1 week postinjury, CD68-positive cells were found in the injured or graft site and its neighboring gray matter of the spinal cord (Fig. 8E–G). Animals in the GS group showed minor inflammatory response as evidenced by the presence of few CD68-immunoreactive macrophages/microglia within the graft while CD68-positive cells were mainly located in the surrounding tissue (11.67 ± 5.64 vs. 99.00 ± 18.54, p < 0.05, n = 6) (Fig. 8F, F′, F″). Infiltration of macrophages/microglia in the injured site of the SCI groups was, however, most prominent compared with those in the graft of the GS+MSCs and GS groups (61.50 ± 17.21 vs. 16.00 ± 9.63 and 11.67 ± 5.64, p < 0.05, n = 6) (Fig. 8G). The immunohistochemical evaluation indicated that GS scaffolds had a very minor immunogenic property and possessed good biocompatibility with the host spinal cord.
Infiltrating macrophages/microglia in the GS+MSCs group were fewer in number in the graft (16.00 ± 9.63, n = 6) and surrounding tissue (75.00 ± 12.33, n = 6) than in the corresponding areas of the SCI group (61.50 ± 17.21 for the injured area and 116.33 ± 11.98 for the surrounding tissue, n = 6; GS+MSCs group vs. SCI group, p < 0.05) (Fig. 8H, I). Positive cells in the surrounding tissue of the GS+MSCs group were fewer than those in the GS group (75.00 ± 12.33 vs. 99.00 ± 18.55, p < 0.05) (Fig. 8H), although there was no statistically significant difference of CD68-positive cell number in the graft of the GS+MSCs and the GS groups (16.00 ± 9.63 vs. 11.67 ± 5.64, p > 0.05) (Fig. 8I). These results suggested that transplanting MSCs-implanted GS scaffolds is not only able to reduce the inflammatory response within the graft itself compared with the injured area without any graft but also attenuates inflammation in the regions adjacent to the injured site.
The percentage of TNF-α and CD68 double positive cells (Fig. 9) is lower in the GS+MSCs group (Fig. 9A) than that in the GS group (Fig. 9B) or SCI group (Fig. 9C) (34.82 ± 13.35% vs. 88.92 ± 4.51% or 89.93 ± 6.67%, p < 0.05, n = 6) (Fig. 9G). Likewise, the percentage of IL-1β-and CD68-positive cells is also lower in the GS+MSCs group (Fig. 9D) than that in GS group (Fig. 9E) or SCI group (Fig. 9F) (13.00 ± 4.52% vs. 74.80 ± 6.25% or 78.97 ± 14.94%, p < 0.05, n = 6) (Fig. 9H).

Percentages of tumor necrosis factor-α (TNF-α) (A–C, G) or interleukin-1β (IL-1β) (D–F, H) positive cells among CD68-positive cells. The percentage of TNF-α and CD68 double positive cells (arrows) is lower in the GS+MSCs group (A) than that in the GS group (B) or SCI group (C). Comparisons are shown in the bar charts (G). Likewise, the percentage of IL-1β and CD68 double positive cells (arrows) is lower in the GS+MSCs group (D) than that in the GS group (E) or SCI group (F). Comparisons are shown in the bar charts (H). Asterisks indicate cells with single labeling of TNF-α or IL-1β in (A–C) or in (D–F), respectively, while arrowheads in (A, D, F) indicate cells with single labeling of CD68. Asterisks in (G) and (H) indicate statistical significance (p < 0.05) whereas NS means no statistical significance. Scale bars: 20 μm.
Discussion
GS has served as a common scaffold in tissue repair owing to its affinity for cells and histocompatibility. In the present study, we used a PLGA film to ensheath the GS tube to form the 3D GS cylindrical scaffold. These scaffolds can be made to different diameters or lengths by changing the dimensions of the ensheathing PLGA cylindrical film and the amount of GS inside the cylinder. Hence, our scaffolds are flexible and can be tailor made for wounds with different sizes in different animal models with potential clinical applications in humans. In addition, PLGA has much stronger mechanical strength than GS, so the relatively tough PLGA cylindrical film on the outside of the scaffold can protect the inner soft GS from collapsing or deforming and prevent the seeded cells from being squeezed out of GS during the process of transplanting to the injured site. More importantly, the PLGA film restricts the extent of swelling of the inner hydrophilic GS, preventing compression to the surrounding tissues. We found that, without the outer PLGA film, GS swelled up to almost twice as big in volume as the original GS ensheathed by the PLGA cylindrical film after 7 days in PBS. Therefore, although the use of GS in wound healing of the central nervous system has been approved by FDA in the US, the problem of compression to the surrounding tissues caused by the swollen GS cautions against its clinical use. Cases have been reported that swollen GS induced cauda equina syndrome (19), thoracic spinal cord compression (24), and acute quadriplegia (3) after the application of gelfoam to the lumbar, thoracic, and cervical spine. It hence appears that the confinement of GS within the PLGA cylindrical film makes GS more useful in treating spinal cord injuries.
A report has shown that MSCs can survive in a 3D collagen scaffold up to 50 days in culture (37). In order to demonstrate whether a GS scaffold ensheathed by the PLGA film is permissive for cell growth, we employed MSCs as the test cell type for assessing cell growth within the scaffold. Crystal violet staining and MTT assay showed that MSCs could adhere to the scaffold and then expended their cell population by about three times within 9 days in culture. Cell survival in the scaffold was confirmed by calcein-AM and ethidium homodimer staining. Normal morphological characteristics of adherent MSCs were observed with regular histological examination and also scanning and transmission electron microscopy. They were round and attached to the scaffold with their multiple and long tapering cellular processes. They usually formed monolayers or multiple cell layers within the scaffold. Our observations hence showed that the 3D GS scaffold allows MSCs to adhere, survival, and proliferate.
Besides the cell affinity nature of gelatin, porosity of the scaffold also contributes to adhesion and survival of implanted MSCs. It has already been shown that material porosity is essential for cell attachment (45). Under SEM, the GS scaffold showed a porous structure with the pore diameters varying from several to hundreds μm. This wide range of pore sizes allows better cell adhesion and adequate exchange of oxygen and nutrients. Moreover, the intercommunicating porous structure that closely resembles the intrinsic mechanical characteristics of the original biological tissue may provide a better microenvironment for regeneration (13), bridging greater wounds in spinal cord injuries and improving functional recovery following transection (45). The 3D GS scaffold may therefore be a functionally more appropriate biomaterial for transplantation in vivo.
Another important consideration for a biomaterial being used as a supporting scaffold for cell growth during transplantation is the possibility of creating a homogeneous environment for the implanted cells to grow or/and for the host cells to develop. It is also vital for cells residing in the central part of the scaffold to acquire adequate oxygen and nutrition when they are cultured in vitro or implanted in vivo before vascularization is established. Some studies reported better cell viability on the periphery than in the center of the scaffold in vitro (40), while our previous study of neural stem cells seeded in the PLGA multichannel tube showed the percentages of dead cells in the sections taken from the peripheral part of the tube were not significantly different from those in the central part (56). In the present study, we compared the cellular distribution, survival, and proliferation of MSCs in the peripheral and central parts of the 3D GS scaffold. Results indicated that there were no statistical differences between these two locations, suggesting that, at least within the 2-mm-long 3D GS scaffold, cellular locations in general do not affect the normal functions of MSCs.
Through the interactions with their niche, stem cells are able to change the microenvironment where they live, while the niche may also support their self-renewal capability, maintain their multipotency, and facilitate differentiation in response to appropriate signals (36). MSCs have been observed to remodel their substrate by secreting increased amounts of FN and type I collagen to the substrate (31). In the present study, we also observed the deposition of FN to the GS scaffold by MSCs. FN appeared as thread-like fluorescent fibers within the GS scaffold under an epifluorescence microscope. Western blot analysis showed that the amount of FN deposited to the GS scaffold was increased from day 3 to day 7, and the level of FN deposition was also higher than that in the plain MSC group where MSCs were grown in the culture without the scaffold. Interestingly, we also found deposition of serum FN to the cell-free GS scaffold although the fluorescence was weaker than that observed in the GS scaffold seeded with MSCs. Therefore, our results suggested that the GS scaffold can be readily modified by MSCs and serum FN, which may in turn facilitate specific adhesion of MSCs or host cells to the GS scaffold. As a consequence, the enhanced FN deposition by MSCs made the scaffold a more preferable niche for MSCs to adhere to. Since the cellular affinity of FN and gelatin is relatively high (20), we presumed that the scaffold with superfluous deposition of FN would facilitate axonal growth when transplanted to the injured spinal cord.
Progressive tissue necrosis, which follows the initial primary injury to the CNS (61), results in cavity formation. Therefore, it is crucial to regulate cellular responses to injuries at the acute stage in order to control the rapid progression to secondary injury of the CNS in the spinal cord injury (18). Since activated macrophages/microglia are thought to contribute to tissue destruction following spinal cord injury (5), and suppression of activated macrophages/microglia is considered to be a useful therapeutic strategy for enhancing both tissue preservation and functional recovery in the spinal cord injury (21,44), the inertness or the inability to activate macrophages/microglia and the nonimmunogenic property become the primary requirements for therapeutic biomaterials. In the present study, we transplanted the GS scaffold with or without MSCs to the injured site immediately after transection of the spinal cord and investigated the activation of macrophages/microglia at 1 week and the cavities formation at 8 weeks after transplantation. Results showed that the scaffold bridged the 2-mm gap of the transection and integrated completely to the spinal cord. The GS scaffold was shown to be unable to trigger severe infiltration of macrophage/microglia. The GS scaffold with MSCs was also found to possess abilities to suppress inflammation in the spinal cord injury by decreasing the number of CD68-immunoreactive macrophages/microglia 1 week after the spinal cord injury. These observations were in line with the well-documented immunosuppressive effects of MSCs in many other experiments (1,7,12) and in clinical trials of graft versus host diseases (32). A recent study also showed that when cocultured with MSCs in vitro, macrophages became a new population of activated macrophages, called MSC-educated macrophages (MEM), which highly expressed IL-6 and IL-10 but weakly expressed IL-12 and TNF-α. This population of macrophages was believed to have potential anti-inflammatory applications (28). In addition, we also evaluated in the present study whether transplanted MSCs would affect the secretion of TNF-α and IL-1β from macrophages/microglia in vivo. These two molecules are important proinflammatory cytokines and key inflammatory mediators in various kinds of central nervous system (CNS) diseases (46), and may also play an important role in neuronal necrosis and apoptosis, leukocyte infiltration, edema, activation of glial cells, induction of other cytokines, etc. (11,51). We found downregulation of expression of both TNF-α and IL-1β in macrophages/microglia after transplantation of the MSCs-containing GS scaffold to the injured spinal cord. Our observations indicated the transplantation of the GS scaffold with MSCs did not only suppress the cell number of macrophages/microglia, but also downregulated the expression levels of TNF-α and IL-1β in macrophage/microglia in the injured area at the early stage of SCI.
One of the most important events that are secondary to the spinal cord injury is the vascular changes, including loss of autoregulation of microcirculation, vasospasm, thrombosis, hemorrhage and increased permeability of the endothelium followed by hypoperfusion, and ischemia (54). The early blood vessel formation is essential for the repair of tissues after injury in the central nervous system such as SCI (25). Vascularization of the biomaterials is also very important because sufficient blood perfusion allows cells even located in the center of the scaffold to acquire adequate oxygen and nutrition supply. Recent research indicated that expression of blood cytokines/chemokines [IL-13, matrix metalloproteinase-2 (MMP2), macrophage inflammatory protein (MIP)] and growth factors/receptors [VEGF, neuropilin, erythropoietin receptor (EPOR), member of the tumor necrosis factor receptor superfamily (TROY), nerve growth factor receptor (NGFR), receptor for advanced glycation endproducts (RAGE)] were modified following MSC administration, and the authors attributed these factors to angiogenesis and functional recovery after middle cerebral artery occlusion (57). In this study, the possible involvement of the blood vessel formation during the process of recovery following spinal cord injury was also examined. The formation of an outer sheath of FN around blood vessels was found, thus inferring that the neovacularization within the GS scaffold may be partly due to deposition of FN to gelatin from adhering cells or serum. Similar perivascular pattern of FN deposition has also been reported during angiogenesis when the extra domain B (EDB) domain was inserted into the FN molecule by alternative splicing (59). However, it is believed that FN deposition in the GS+MSCs group played only a necessary but not a sufficient role in angiogenesis because FN was also deposited in the injured site in the SCI group, albeit in a much smaller amount. Some reports also suggested that MSCs might express endothelial markers (53,62). In the present study, we did not observe overt endothelial differentiation from MSCs. However, we found that endothelial cells were surrounded by a few MSCs whose cell bodies and cellular protrusions were closely apposed to the endothelial cells. This kind of MSCs are regarded as perivascular cells (10), which are recruited to the newly formed endothelial cell network to direct its maturation through both secreted soluble factors and direct cellular contacts (52). Another possible factor attributing to this robust angiogenesis is possibly the expression of HIF-1α induced by MSCs (33,38). It has been postulated that hypotension of oxygen in the lesion site on the one hand causes dysfunction in energetic metastasis, free radicals formation, lipid peroxidation (6), and loss of intracellular balance of sodium, potassium, calcium and magnesium subsequently leading to an increased intracellular calcium level (9), and on the other hand, promotes HIF-1α accumulation (48), dimerization with HIF-1α, and mediation of profound changes in gene expression including nitric oxide synthase (iNOS) (26), glycolytic enzymes (49), VEGF (29), glucose transporter-1 (GLUT-1) (50), VEGF receptor VEGFR1 (38), etc., thus resulting in angiogenesis (14,27). We therefore also examined the expression of VEGF after the transplantation of the MSCs-containing scaffold. Interestingly, only those GFP-positive cells (MSCs from the graft) surrounding the blood vessels expressed VEGF while others not in close proximity to the blood vessels did not. So we hypothesize that, although most MSCs expressed HIF-α in the injured area, only some of them expressed VEGF, and these VEGF-expressing MSCs may affect the formation of blood vessels. It is also likely that MSCs, by expression of VEGF that is a downstream product of HIF-1α, play important roles in local angiogenesis, and hence, as a result, protect the surrounding spared spinal cord tissue and facilitate repair of the damaged tissue. However, all these await further investigations.
In summary, we have constructed 3D GS scaffolds that allowed MSCs to adhere, survive, and proliferate. Within the scaffold, the peripheral and central locations of the cells did not exert any discernible effects on the cellular functions of MSCs. We also observed FN deposited to the scaffold. When transplanted to the transected site of the rat spinal cord, the scaffold was found to be biocompatible and able to incorporate completely to the spinal cord. The transplanted scaffold with MSCs were also observed to be able to reduce cavity formation in the injured area and attenuate inflammatory responses as evidenced by the reduced number of infiltrating macrophages/microglia and their decreased levels of expression of TNF-α and IL-1β in the injured area at the early stage of SCI. Transplantation of the scaffold with MSCs also promoted angiogenesis by inducing blood vessel formation and expression of HIF-1α and VEGF in the injured area of the spinal cord. Therefore, these 3D GS scaffolds may serve as a potential supporting biomaterial for wound healing after SCI.
Footnotes
Acknowledgments
This research was supported by grants from the Chinese National Natural Science Foundation (No. 30771143) and Natinal 863 project (No. 2011AA020112) to Y.S.Z., the Natural Science Foundation of Guangdong Province (No. 07301418), and Doctor Subject Points Foundation of Chinese Education Ministry (No. 200805581102) to W.Z. The authors declare no conflicts of interest.