
Abstract
The unique self-renewal and multilineage differentiation potential of mesenchymal stem cells (MSCs) make them a promising candidate for cell therapy applications. However, during in vitro expansion of MSCs, replicative senescence may occur and will compromise the quality of the expanded cells. Because calorie restriction has been shown to effectively extend the life span of various organisms, the purpose of this study is to investigate the effect of glucose reduction on MSCs and the coordinated changes in energy utilization. It was found that the frequency of cycling cells was significantly increased, while senescence markers such as β-galactosidase activities and p16INK4a expression level were markedly reduced in MSCs under low-glucose culture condition. Quantitative real-time PCR analysis demonstrated the preserved trilineage differentiation potentials of MSCs after low-glucose treatment. Interestingly, the ability of osteogenic lineage commitment was improved, while the ability of adipogenic lineage commitment was delayed in MSCs after glucose reduction. In addition, we observed decreased lactate production, increased electron transport chain complexes expression, and increased oxygen consumption in MSCs after glucose reduction treatment. Increased antioxidant defensive responses were evidenced by increased antioxidant enzymes expression and decreased superoxide production after glucose reduction. Taken together, our findings suggest that MSCs utilize energy more efficiently under restricted glucose treatment and exhibit greater self-renewal and antisenescence abilities, while their differentiation potentials remain unaffected.
Introduction
Mesenchymal stem cells (MSCs) can be derived from various human tissues such as bone marrow, muscle, umbilical cord blood, and placenta (11,26). The multilineage differentiation capabilities and the immune-suppressive properties of MSCs make them a promising candidate for cell therapy and tissue regeneration (33). The applications of MSCs in bone, cartilage, liver, and cardiac tissue regeneration have been demonstrated in various animal models (22,23,29,42). However, only a limited number of MSCs can be isolated from adult tissues (6,31); as a consequence, culture expansion is indispensable to achieve sufficient cell number for clinical applications. MSCs has been shown to exhibit limited growth ability and encounter replicative senescence after prolonged in vitro culture (4,40), which is accompanied with the increased expression levels of senescence marker genes such as the cyclin-dependent kinase inhibitor, p16INK4a (19,21). Regarding the demand of sufficient amount of high-quality MSCs for clinical applications, it is imperative to develop culture protocols that can prevent MSCs from senescence while maintaining differentiation potentials during in vitro culture expansion.
Calorie restriction (CR) is the most reproducible non-genetic intervention to increase life span and to reduce the rate of senescence in various organisms, including yeasts, worms, fruit flies, rodents, and nonhuman primates (32,38,41). These studies show that CR induces SIR2 family gene expression to regulate the downstream stress resistance reaction and to slow the aging processes (1,20). Therefore, we reason that reducing glucose supply during culture expansion may contribute to reduce cellular senescence of MSCs in vitro.
Glucose serves as the major calorie source of energy utilization and also acts as a remarkably versatile metabolic intermediate to support biosynthesis. Glucose can be oxidized and become pyruvate via glycolysis followed either by fermentation with lactate production or by complete oxidation with mitochondrial respiration (12). It has been reported that during cell proliferation an increase in lactate production will occur when there is excessive amount of glucose, suggesting that mode of energy utilization is dependent on cell cycle status (16). Furthermore, the results of our previous study revealed that glucose utilization in MSCs was more dependent on anaerobic glycolysis than oxidative phosphorylation (7).
Mitochondria play an important role to generate ATP by respiration. During oxidative phosphorylation, electrochemical proton gradient across the mitochondria inner membrane can be established through the electron transport down the electron transport chain (ETC). Electrons from either NADH-ubiquinone oxidoreductase (complex I) or succinate-Q oxidoreductase (complex II) are passed via ubiquinone-cytochrome c oxidoreductase (complex III) to cytochrome oxidase (complex IV), and then contribute to ATP synthesis by ATP synthase (complex V) (24). Nevertheless, ROS production is an inevitable by-product of electron transport during oxidative phosphorylation, and oxidant damage to the mitochondria and other cell components caused by free radicals is crucial to the aging processes (15,28). Therefore, the changes in mitochondria under an insufficient glucose-supplied environment will also be an important question to answer.
It has been proposed that proper modification in glucose concentration during culture expansion can simulate the mildly stressful condition induced by mildly inadequate nutrition supply in vivo (35,39). However, it is unclear how a glucose restriction environment affects the proliferation and differentiation ability of MSCs. Nor is there any information in the literature regarding their adaptation of energy utilization in the low-glucose environment. The purpose of this study is to systematically elucidate the effects of glucose reduction on MSCs and the coordinated changes in energy utilization. We hypothesize that glucose reduction confers resistance to cellular senescence to MSCs during in vitro culture expansion.
Materials and Methods
Isolation and Maintenance of MSCs
MSCs were isolated from human bone marrow as previous described (26). An Institutional Review Board approval was obtained prior to the commencement of the study and bone marrow samples were collected with informed consent. These cells were expanded in culture medium containing high-glucose Dulbecco's modified Eagle's medium (4500 mg glucose/L, Sigma-Aldrich, St. Louis, MO) supplied with 10% fetal bovine serum (Invitrogen, Grand Island, NY), 10 ng/ml basic fibroblast growth factor (R&D Systems, Inc., Minneapolis, MN), and 5 ng/ml epidermal growth factor (R&D Systems, Inc.). To reduce glucose, MSCs were cultured in glucose-free DMEM (Sigma-Aldrich) supplemented with different concentration of D-glucose (Sigma-Aldrich), 10% fetal bovine serum (Invitrogen), 10 ng/ml basic fibroblast growth factor, and 5 ng/ml epidermal growth factor. In this study, we provide 450, 1350, and 4500 mg/L glucose to serve as the 10%, 30%, and 100% glucose groups, respectively. MSCs were first seeded in 4000 cells/cm2, allowed to adhere for 24 h, and then changed to different glucose concentration medium.
In Vitro Differentiation of MSCs
Differentiation induction into mesodermal lineage progenies was carried out according to our previously reported protocols (26). Briefly, MSCs were cultured in different glucose concentration medium for 2 weeks, and then changed to osteogenic, chondrogenic, or adipogenic induction medium. For osteogenic induction, alkaline phosphatase staining was performed after induction for 2 weeks. For adipocyte differentiation, oil red O staining was carried out after induction for 3 weeks. As for the evaluation of chondrogenic differentiation, the pelleted micromass of cells treated with chondrogenic medium for 3 weeks was embedded, sectioned, and stained with alcian blue solution (Sigma-Aldrich).
5-Bromodeoxyuridine (BrdU) Incorporation Assay
MSCs were pulsed with 10 μM/ml BrdU solution (BD Bioscience, San Diego, CA) for 24 h followed by fixation and permeabilization. To expose BrdU epitopes, DNA was denatured in 2 N HCl/0.5% Triton X-100 at 37°C for 30 min. Cells neutralized with 0.1 M Na2B4O7 (pH 8.5) were incubated with 1:3 diluted FITC-conjugated anti-BrdU (BD Bioscience) at room temperature for 1 h. BrdU-positive cells were analyzed by a FACScan flow cytometer (BD FACSCantoII). Cells from the same population without BrdU labeling were used as negative staining control.
β-Galactosidase Activity Staining
β-Galactosidase-positive cells were stained with a commercially available kit (Sigma-Aldrich) per the manufacturer's instruction. Briefly, MSCs cultured in different glucose concentration medium for 35 days were fixed with the fixation buffer and incubated with the staining mixture containing X-gal solution at 37°C without CO2 at pH 6 for 15 h. The blue-stained cells and the total number of cells were counted under light microscopy, and the percent of β-galactosidase-positive cells was calculated.
RNA Extraction and Real-Time PCR Analysis
Total RNA was isolated from cells with RNAspin Mini (GE Healthecare, Buckinghamshire, UK). RNA was treated with TURBO DNA-free (Ambion, Austin, TX) for 30 min at 37°C followed by reverse transcription. Real-time PCR was performed using 150 ng cDNA on LightCycler 480 Real-Time System (Roche Applied Sciences, Mannheim, Germany) with FastStart Universal Probe Master (Rox) (Roche Applied Sciences). In-tron spanning primers specific for each gene were designed by Universal ProbeLibrary Assay Design Center (http://www.roche-applied-science.com), and were coordinated with corresponding probes from Universal ProbeLibrary (Roche Applied Sciences, Mannheim, Germany) (Table 1). PCR conditions consisted of a 10-min activation of the FastStart Universal Probe Master at 95°C, followed by 40 cycles of 30 s at 95°C and 30 s at 60°C. The average threshold cycle (Ct) for each gene was normalized by TATA binding protein.
Primer Sequences and Probes From Universal ProbeLibrary Used in Real-Time PCR Analysis

Protein Extraction and Western Blot Analysis
Total protein was obtained from 1 × 10⁶ cells with cell lysis buffer (Sigma-Aldrich) containing freshly added protease inhibitors (Sigma-Aldrich). Protein concentrations were determined with Bio-Rad Protein Assay (Bio-Rad Laboratories, Inc., Hercules, CA). Electrophoresis was performed using 40 μg total protein by SDS-PAGE and transferred to Immun-Blot PVDF membrane (Bio-Rad Laboratories, Inc.). The membrane was blocked with 5% dry milk and probed with specific antibodies (β-actin, Sigma-Aldrich; SIRT1, p16INK4a, MnSOD, catalase, Oct4, Hsp70, Abcam; Sox2, Cell Signaling; mitochondria complex I–V, Invitrogen). The antibody-protein complexes were incubated with HRP-conjugated secondary antibodies (Sigma-Aldrich) and developed with Immobilon Western (Millipore Corporation, Billerica, MA).
Lactate Production Assay
Cells seeded in six-well plates were replenished with 1 ml fresh 10%, 30%, or 100% glucose concentration medium corresponding to their original culture environment and incubated at 37°C for 5 h. Ten micorliters of the medium and 200 μl of the lactate reagent (Trinity Biotech) were mixed and the absorbance at 540 nm was recorded with an ELISA reader (TECAN infinite M1000). The production of lactate was normalized by the total cell number and the incubation time, which was 5 h in this study.
ATP Content Assay
Intracellular ATP content was detected with the Bio-luminescent Somatic Cell Assay kit (Sigma-Aldrich). Cells seeded in six-well plates were first detached with 0.25% trypsin-EDTA (Sigma-Aldrich), and 50 μl of the cell suspension (1/20 of the total volume) was then mixed with 100 μl of the somatic cell ATP releasing reagent. An aliquot of 100 μl of the ATP releasing mixture was added into 100 μl of the ATP assay mix working solution, and the amount of luminescence emitted was immediately measured with TECAN infinite M1000. The exact ATP content per cell was determined by counting the viable cells under a microscope (Nikon).
Oxygen Consumption Assay
Oxygen consumption rate was detected by 782 Oxygen Meter (Strathkelvin Instruments, Motherwell, UK). Cells seeded in 10-cm2 dishes were first detached with 0.25% trypsin-EDTA (Sigma-Aldrich). Cells (5 × 10⁵) were resuspended in 340 μl of the assay buffer (2 mM MgCl2, 65 mM KCl, 125 mM sucrose, 20 mM phosphate buffer, pH 7.2), and then added to the 37°C incubation chamber. Permeabilization of MSC plasma membrane was achieved by injection of 0.0003% digitonin (Sigma-Aldrich) into the incubation chamber. The oxygen consumption rate was determined by adding 20 mM succinate (Sigma-Aldrich) as the electron donor.
Mitochondrial Mass Assay
MSCs seeded in six-well plates were changed into fresh serum-free basal medium containing 2.5 μM nonyl acridine orange (NAO) (Molecular Probes). Cells were then incubated at 37°C in the dark for 15 min, and analyzed by a FACScan flow cytometer (BD FACSCantoII). For the measurement of mitochondrial mass, the excitation wavelength was 488 nm and the emission wavelength was 580 nm.
ROS Production Assay
To measure the intracellular level of superoxide (O2.-), MSCs were changed into fresh serum-free basal medium containing 5 μg/ml hydroethidine (HE) (Molecular Probes). Cells were then incubated at 37°C in the dark for 15 min, and analyzed by a FACScan flow cytometer (BD FACSCantoII). For the measurement of O2.-, the excitation wavelength was 488 nm and the emission wavelength was 580 nm.
Statistical Analysis
Two-tailed Student's t-tests and one-way ANOVA tests followed by Tukey's post hoc tests were performed. A value of p < 0.05 was considered statistically significant.
Results
Glucose Reduction Reduced Cellular Senescence of MSCs
MSCs were isolated from bone marrow and expanded in expansion culture medium containing 4500 mg/L glucose. To investigate the effects of glucose reduction on MSCs, cells were changed into different glucose concentration medium once their cumulative population doubling level (CPDL) reached 14. Three different glucose concentrations of culture medium were used: 450 and 1350 mg/L glucose representing the 90% and 70% glucose-restricted groups, respectively, while 4500 mg/L glucose served as the control group (Fig. 1).
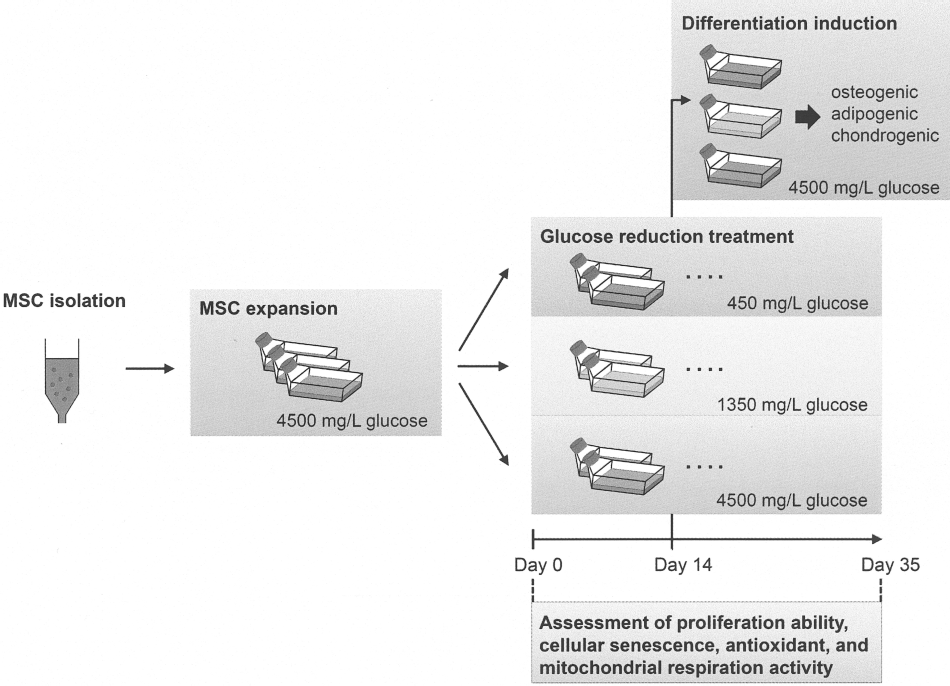
A schematic of the experimental design. MSCs were isolated and expanded to the cumulative number population doubling level 14. MSCs were then changed into medium with different glucose concentrations to study the effects of glucose reduction on MSCs. Cells cultured in different glucose concentrations for 14 days were used to assess the differentiation ability of MSCs, while identical osteogenic, adipogenic, and chondrogenic induction medium (each containing 4500 mg/L glucose in basal medium) were used. Also, cells from each indicated time points described below were used to assess the proliferation ability, cellular senescence, and metabolic and mitochondrial changes of MSCs after different glucose concentration treatments. The blue, green, and red rectangles represent 450, 1350, and 4500 mg/L glucose contained in the basal medium, respectively.
After culture expansion for 35 days, the cell morphology of MSCs in the 450 and 1350 mg/L glucose groups were thin and spindle in shape without elongation, while the cells in the 4500 mg/L glucose group exhibited a more flattened appearance (Fig. 2A). Cell size was also quantified by FACS analysis, and a greater percentage of MSCs was found within the low-FSC/low-SSC population in the 450 and 1350 mg/L glucose groups compared to the 4500 mg/L glucose group (450 mg/L glucose, 58.0%; 1350 mg/L glucose, 52.8%; 4500 mg/L glucose, 47.2%) (Fig. 2B), suggesting a decrease in average cell size after glucose reduction. The percentage of granular MSCs was also decreased after glucose reduction as evident by the high-SSC population (450 mg/L glucose, 21.7%; 1350 mg/L glucose, 27.9%; 4500 mg/L glucose, 35.1%) (Fig. 2B).
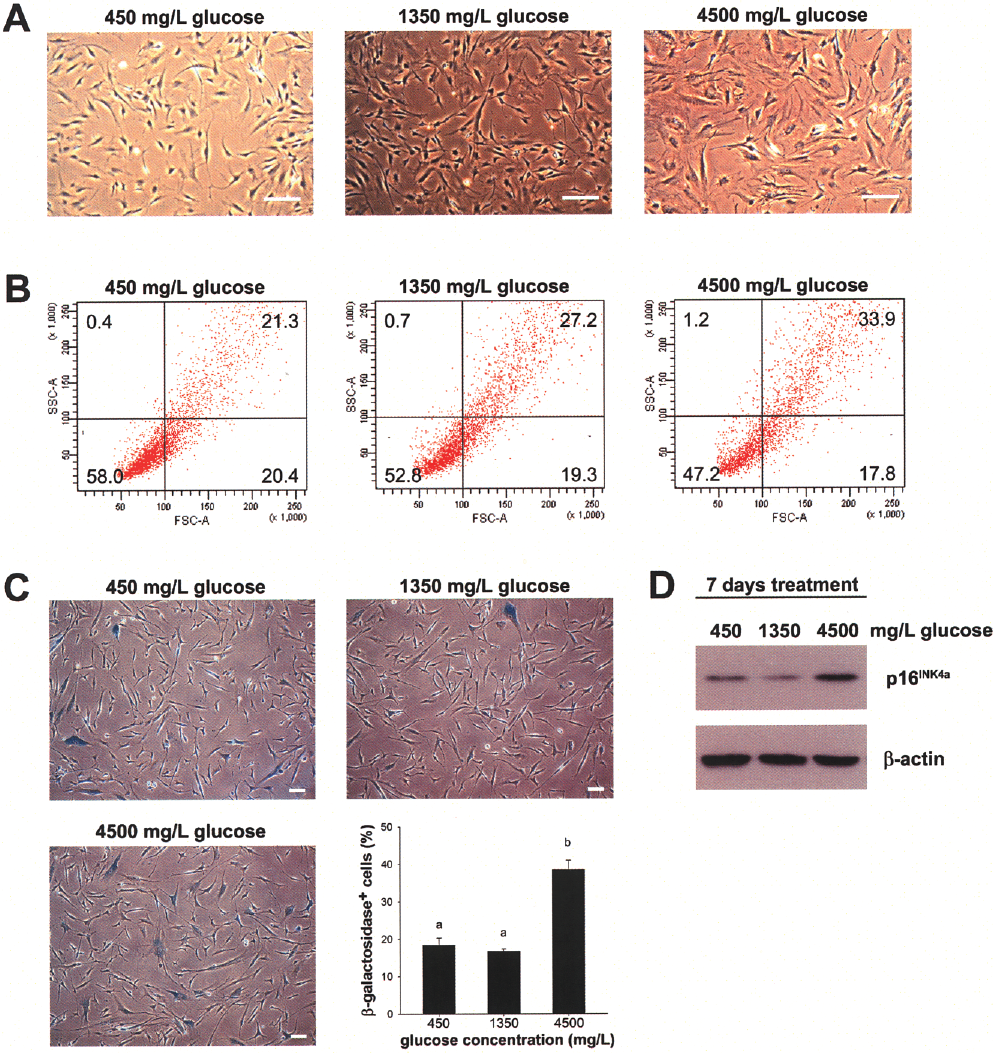
Cellular senescence is prevented in MSCs upon glucose reduction. (A) Morphology of MSCs under 450, 1350, and 4500 mg/L glucose culture condition for 35 days. Scale bars: 100 μm. (B) Cell size of MSCs under 450, 1350, and 4500 mg/L glucose culture condition for 28 days were determined by FACS analysis. (C) X-Gal staining of MSCs was performed after 450, 1350, and 4500 mg/L glucose treatment for 35 days. Scale bars: 100 μm. Percents of senescent cells were determined by direct cell counting of β-galactosidase-positive cells. Data are shown as mean ± SE (n = 3). Different letters represent different groups of significance, p < 0.05. (D) The protein expression levels of p16INK4a in MSCs after 450, 1350, and 4500 mg/L glucose treatment for 2 weeks were determined by Western blot. β-Actin was used as loading control.
We next performed senescence-associated β-galactosidase (SA-βgal) staining to determine the percentage of senescent cells in MSCs after continuous in vitro culture expansion for 35 days. The percentage of β-galactosidase-positive cells was significantly decreased in both 450 and 1350 mg/L glucose groups compared to the 4500 mg/L glucose group (450 mg/L glucose, 18.43 ± 1.88%; 1350 mg/L glucose, 16.78 ± 0.51%; 4500 mg/L glucose, 38.66 ± 2.40%) (Fig. 2C), indicating reduced cellular senescence after glucose restriction. Similarly, the protein expression level of p16INK4a was reduced in both 450 and 1350 mg/L glucose groups after glucose reduction for 14 days (Fig. 2D).
Glucose Reduction Increased Proliferative Abilities of MSCs
To study how glucose reduction affects the proliferation ability of MSCs, growth kinetics analysis on MSCs after low glucose treatment, which started at CPDL 14, was performed. It was found that glucose reduction resulted in a significant increase of CPDL in both the 450 and 1350 mg/L glucose groups compared to the 4500 mg/L glucose group (Fig. 3A), indicating the proliferation promotion effect of glucose reduction on MSCs. We further determined the frequency of cycling population of MSCs in the 450, 1350, and 4500 mg/L glucose groups using BrdU incorporation assay. The numbers of BrdU-positive cells were significantly increased in both the 450 and 1350 mg/L glucose groups compared to the 4500 mg/L glucose group (450 mg/L glucose, 56.0 ± 1.5; 1350 mg/L glucose, 60.0 ± 1.1; 4500 mg/L glucose, 44.9 ± 2.3 on day 14) (Fig. 3B), suggesting the increased proliferation rate of MSCs after glucose reduction.

Proliferation ability is elevated in MSCs upon glucose reduction. (A) Growth kinetics of MSCs were determined by the levels of cumulative population doubling after 450, 1350, and 4500 mg/L glucose treatment. The glucose reduction treatment started from CPDL 14. (B) The percentage of BrdU-positive cells in MSCs after 450, 1350, and 4500 mg/L glucose treatment was determined by BrdU treatment for 24 h and standardized by cells without BrdU treatment. Data are shown as mean ± SE (n = 3). *p < 0.05; **p < 0.01.
Differentiation Abilities of MSCs Were Maintained After Glucose Reduction
To determine how glucose reduction affects the multilineage differentiation potentials of MSCs, differentiation of MSCs into osteoblasts, adipocytes, and chondrocytes were carried out after glucose reduction treatment for 14 days. After osteogenic induction, MSCs from 450, 1350, and 4500 mg/L glucose groups all exhibited osteoblast-like flattened morphology. The formation of osteoblasts and the increase in alkaline phosphatase activity was noted in all three groups evidenced by positive alkaline phosphatase staining after 2 weeks of induction (Fig. 4A). Expression of osteogenic lineage marker genes, Runt-related transcription factor 2 (RUNX2) and type I collagen, was higher after osteogenic induction in the 450 and 1350 mg/L glucose groups compared to the 4500 mg/L glucose group. Periostin expression was significantly higher at the first 2 weeks and significantly lower at the third week of induction in the low-glucose-treated groups, suggesting an accelerated osteogenic commitment after glucose reduction (Fig. 4B).

Differentiation ability is preserved in MSCs after glucose reduction treatment. (A) Alkaline phosphatase staining and (B) osteogenic lineage marker genes of MSCs from the 450, 1350, and 4500 mg/L glucose groups followed by osteogenic induction for 2 weeks. Scale bars: 100 μm. (C) Fat droplets formation and (D) adipogenic lineage marker genes of MSCs from the 450, 1350, and 4500 mg/L glucose groups followed by adipogenic induction for 3 weeks. Scale bars: 100 μm. (E) Alcian blue staining and (F) chondrogenic lineage marker genes of MSCs from the 450, 1350, and 4500 mg/L glucose groups followed by chondrogenic induction for 4 weeks. Scale bars: 50 μm. Data are shown as mean ± SE (n ≥ 3). *p < 0.05; **p < 0.01.
As for adipogenic differentiation ability, MSCs from the 450, 1350, and 4500 mg/L glucose groups all exhibited lipid vacuoles under adipogenic medium upon induction. Fat droplet deposition was found under oil red O stains after 3 weeks of induction (Fig. 4C). Expression of adipogenic lineage marker genes, peroxisome proliferator-activated receptor γ (PPARγ), fatty acid binding protein, and fatty acid synthase, was lower at the first week of induction in the 450 and 1350 mg/L glucose groups, but was significantly higher at the second and third weeks of induction, suggesting a delayed adipogenic commitment after glucose reduction (Fig. 4D).
To assess their chondrogenic potential, MSCs from the 450, 1350, and 4500 mg/L glucose groups were cultured under chondrogenic medium in the pellet micromass system. Formation of the glycosaminoglycan of chondrocytes was confirmed by alcian blue staining after 4 weeks of induction (Fig. 4E). Expression of chondrogenic lineage marker genes, aggrecan, type II collagen, and cartilage oligomeric matrix protein, was measured by quantitative real-time PCR analysis. Aggrecan expression was significantly higher at the second and third weeks of induction in low-glucose-treated groups. Expression of type II collagen exhibited the same pattern as aggrecan, while the expression of cartilage oligomeric matrix protein was lower at the second week and higher at the third week of induction in the 450 mg/L glucose-treated group (Fig. 4F).
Glucose Reduction Enhanced Mitochondrial Respiration of MSCs
To elucidate the adaption of glucose utilization in MSCs to the low-glucose environment, metabolic changes of MSCs after glucose reduction were determined. Results showed that intracellular ATP content in the 450 and 1350 mg/L glucose groups exhibited no significant difference compared to the 4500 mg/L glucose group (Fig. 5A). However, lactate production rates in both the 450 and 1350 mg/L glucose groups were significantly decreased compared to the 4500 mg/L glucose group within the first 9 days (Fig. 5B), indicating the reduction in anaerobic glycolytic activities and the possibility of switched ATP production mode from glycolysis to mitochondrial oxidative phosphorylation following glucose reduction.
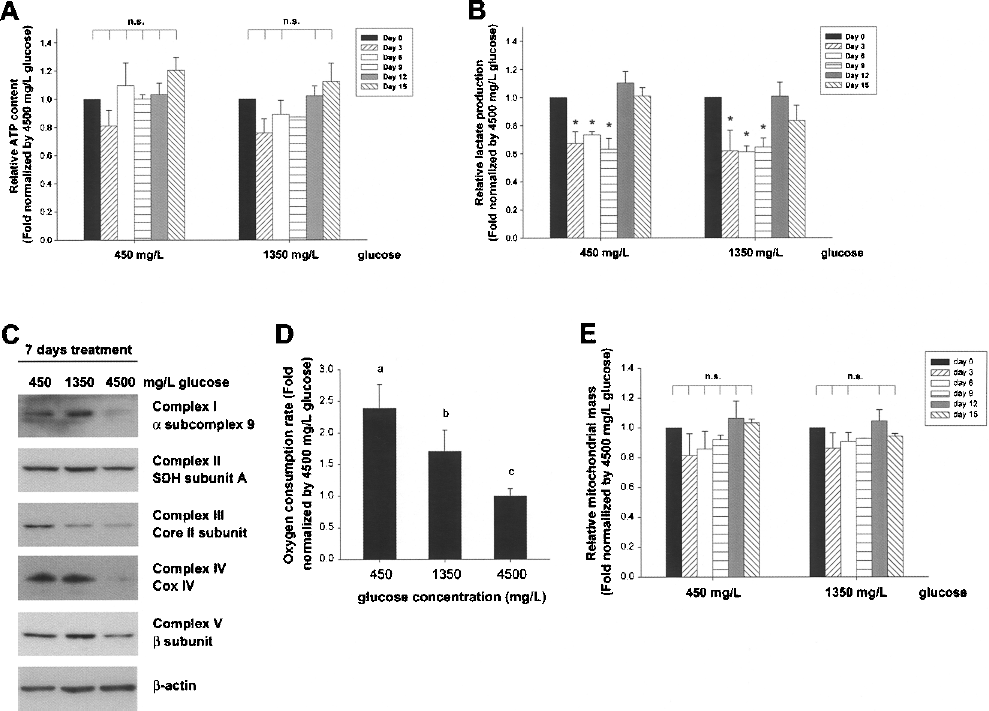
Mitochondrial respiration is augmented in MSCs upon glucose reduction. (A) The intracellular ATP content and (B) the lactate production rate in MSCs after 450, 1350, and 4500 mg/L glucose treatment were determined and standardized by 4500 mg/L glucose group at each time point, respectively. (C) The protein expression levels of respiratory enzyme complexes after 450, 1350, and 4500 mg/L glucose treatment for 1 week were determined by Western blot. β-Actin was used as loading control. (D) The oxygen consumption rate in MSCs after 450, 1350, and 4500 mg/L glucose treatment for 1 week was determined and standardized by the 4500 mg/L glucose group. Different letters represent different groups of significance, p < 0.05. (E) The mitochondrial mass in MSCs after 450, 1350, and 4500 mg/L glucose treatment were determined and standardized by the 4500 mg/L glucose group at each time points. Data are shown as mean ± SE (n = 3). n.s., no significance; *p < 0.05.
To confirm the switch of ATP production, the expression of ETC complexes was detected. Results showed that the expression of α subcomplex 9 of complex I, succinate dehydrogenase subunit A of complex II, core II subunit of complex III, COX IV of complex IV, and β subunit of complex V were increased after glucose reduction for 7 days (Fig. 5C). Oxygen consumption rates in both the 450 and 1350 mg/L glucose groups were significantly increased after glucose reduction for 7 days (Fig. 5D). Nevertheless, no significant changes in mitochondrial mass were measured after low-glucose treatment (Fig. 5E).
Glucose Reduction Increased Expression of Antioxidant Enzyme in MSCs
Given the increasing ETC complexes activities during glucose reduction, we subsequently investigated the production of reactive oxygen species (ROS) in MSCs. Intriguingly, in spite of the increased mitochondrial oxidative phosphorylation after low-glucose treatment, the intracellular level of ROS was significantly decreased within the first 9 days in both the 450 and 1350 mg/L glucose groups compared to the 4500 mg/L glucose group (Fig. 6A). Moreover, Western blot analyses also demonstrated increased expression of antioxidant enzymes such as MnSOD and catalase after glucose reduction for 7 days (Fig. 6B). The above findings suggested that after glucose reduction, coordinated upregulation of antioxidant enzymes may help MSCs overcome the undesirable ROS production as a consequence of the increased aerobic respiration.
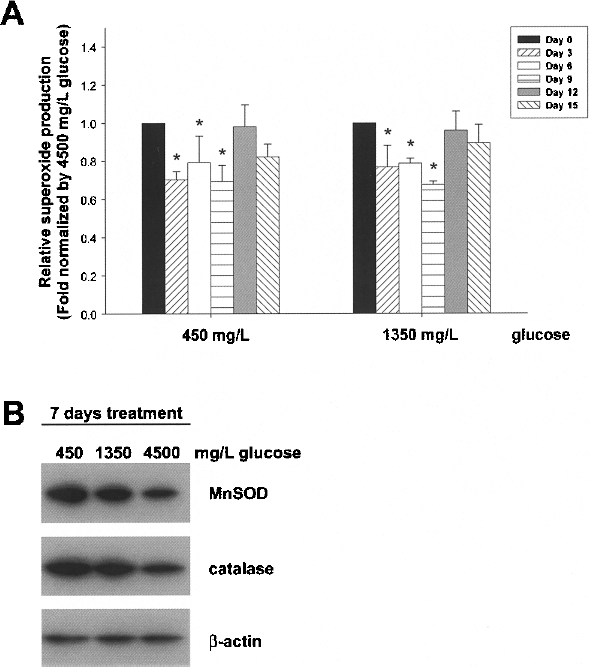
Antioxidant ability is increased in MSCs upon glucose reduction. (A) The superoxide production in MSCs after 450, 1350, and 4500 mg/L glucose treatment was determined and standardized by the 4500 mg/L glucose group at each time point, respectively. (B) The protein expression levels of MnSOD and catalase after 450, 1350, and 4500 mg/L glucose treatment for 1 week were determined by Western blot. β-Actin was used as loading control. Data are shown as mean ± SE (n = 3). *p < 0.05.
Discussion
We demonstrate in this study that a 70–90% reduction of the glucose concentration in the culture system confers favorable effects. MSCs exhibit better proliferation ability and reduced replicative senescence after glucose reduction. Importantly, MSCs maintain their trilineage differentiation potentials into osteoblasts, adipocytes, and chondrocytes, despite the fact that osteogenic commitment was accelerated while adipogenic commitment was delayed after glucose reduction. In addition, we elucidate the metabolic changes in MSCs after low-glucose treatment. We found that MSCs metabolize the limited glucose through mitochondrial oxidative phosphorylation, which is accompanied by elevated antioxidant enzyme expression to counteract the production of ROS.
Mitochondrial changes after CR treatment have been studied in rat tissues, human cell lines, and human primary cells, but never in stem cells (8,25,27). Several lines of evidence indicate that CR can increase the expression of mitochondrial ETC complexes in yeast and rat muscle (14,36); Dani et al. suggested the decreased abundance of ETC complex I, IV, and V in rat liver (10). The inconsistencies may be due to the differences in experimental setup as well as cell types and tissues of origin. However, in our study, we observed significant increases in ETC complex I, III, IV, and V expression in MSCs after low-glucose treatment, while only a slight increase in ETC complex II expression was found (Fig. 5C). The increase in mitochondrial ETC complexes may compensate the progressive mitochondrial damage during aging (9). In addition, because complex I and II serve as the alternative entry points of the ETC, our findings suggested that glucose reduction can increase the entry points of ETC in MSCs primary via complex I. Moreover, we found the mitochondrial mass remained unchanged after low-glucose treatment (Fig. 5E), suggesting the effects of glucose reduction on mitochondrial activities in MSCs are mediated by mitochondrial function rather than mitochondrial content.
Although oxidative phosphorylation was increased (Fig. 5C, D), ROS production decreased (Fig. 6A). This can be explained by the elevation of respiratory enzyme complex expression (Fig. 5C), which increases the entry points of electrons into the ETC (15) and facilitates the reduction of ROS production, because most of the ROS production is due to the halt of electrons at mitochondria complexes I and III (2,3,30). Moreover, the elevated antioxidant enzyme expression after glucose restriction treatment (Fig. 6B) also counteracts the increased production of ROS during oxidative phosphorylation. These findings suggest the orchestrated network between mitochondrial respiratory activities and antioxidant defensive responses. St-Pierre et al. reported PGC-1α as an important mediator of both mitochondrial biogenesis and several antioxidant enzyme expression (37). We also observed an increased PGC-1α expression in MSCs after low glucose treatment (data not shown). Recently, glutaminase 2 has also been shown to increase mitochondrial respiration and ATP production, while decreasing ROS production by enhancing antioxidant defense function (18). Therefore, further study is necessary to identify the key regulator that coordinates the changes among mitochondrial respiratory function, ROS generation, and antioxidative capacity after glucose reduction.
In this study, we observed increased expression of the ETC complexes in MSCs after low-glucose treatment (Fig. 5C), suggesting a more active state of mitochondrial function. Together with the increased oxygen consumption rate and the reduction of lactate production after glucose reduction (Fig. 5B, D), our results demonstrated that aerobic metabolism became predominant upon glucose restriction. These findings point out that MSCs adapt to the low-glucose environment by utilizing glucose in a more efficient fashion. Notably, the increase in mitochondrial oxidative phosphrylation may also facilitate the differentiation of MSCs into osteoblasts (Fig. 4B), evidenced by our previous study that demonstrated the preference of aerobic metabolism during osteogenic differentiation (7).
Upon glucose reduction, MSCs rapidly adapt to the low-glucose environment and switch the energy utilization mode within 3 days. However, we observed a recovery in lactate production after 12 days of glucose reduction treatment (Fig. 5B), and the level of superoxide also returned to the normal level in MSCs (Fig. 6B). It has been reported that endogenous ROS and MnSOD expression levels may affect the rate of glucose intake in mouse muscle (34). Therefore, we measured the expression of glucose transporter 1 (GLUT1) by real-time PCR analysis, and detected an increased GLUT1 expression in MSCs after low-glucose treatment for 9–12 days (data not shown). This finding implies the possibility of increased glucose intake in MSCs leading to the adaptive response. However, further studies should be done to elucidate the mechanisms regulating energy metabolism and glucose transport in MSCs.
The increased antioxidant enzyme expression after glucose reduction treatment (Fig. 6B) suggests the hormesis effects on MSCs after glucose restriction. The term hormesis describes a mild stress that induces protective stress-resistant mechanisms and offers protection against stress (5,17). The principle of hormesis is perfectly defined by the German philosopher Friedrich Nietzsche as “That which does not kill us makes us stronger” (13). In our glucose restriction model, we observed increased proliferation ability, increased antioxidant defensive ability, and increased aerobic metabolism in MSCs. All these findings perfectly demonstrate the effects of mild stress on MSCs.
In summary, our results elucidate the beneficial effects of glucose reduction-induced stress response hormesis on MSCs during culture expansion. The simple glucose reduction method can effectively fulfill the demand of achieving sufficient quantity and quality of MSCs for clinical applications. We systematically address the effects of glucose reduction on MSCs by demonstrating their improved osteogenic and delayed adipogenic lineage commitment. In addition, hopefully, it may provide the first insight of the interplay of glucose utilization, mitochondrial activities, and antioxidant response in stem cells.
Footnotes
Acknowledgments
This work was supported by grants from Taipei Veterans General Hospital (VGH100VN-05, VGH100D-003-2); grants from National Science Council of Taiwan (NSC98-2627-B-010-004, NSC98-2314-B-010-001-MY3, and NSC99-3111-B-010-002); and a project of the Aim for Top University Plan sponsored by the Ministry of Education. We also thank members of Dr. Yau Huei Wei's lab for their kind help and generous inputs into this study. Author contribution: T.L.: collection and assembly of data, data analysis, and data interpretation, manuscript writing; J.H.H: collection and assembly of data; M.-H.Y.: conception and design; O.K.L: conception and design, collection and assembly of data, data analysis and data interpretation, manuscript writing.