
Abstract
Multipotent mesenchymal stromal cells (MSCs) are a promising cell type for cell transplantation; however, their utilization remains limited until the availability of adequate alternative sources of MSCs and the thorough understanding of the biology of MSCs isolated from various sources are realized. Fetal lung has been identified as a rich source of MSCs. To explore the therapeutic potential of passaged fetal lung MSCs (FLMSCs), the present study evaluated their growth kinetics, telomere length, karyotype, immunophenotype, and the differentiation potential during in vitro expansion. FLMSCs could be easily amplified in vitro with no significant shorting of telomere length and had a normal karyotype. No significant differences between passage 5 or passage 25 were observed in the immunophenotype analysis using flow cytometry. Moreover, flow cytometry results provided the first demonstration, to our knowledge, that FLMSCs stably expressed pluripotent markers including Oct4, Nanog, Sox2, TRA-1-60, c-Myc, and SSEA-4 through 25 passages. In vitro differentiation studies as identified by confocal microscopy, flow cytometry, RT-PCR, and immunohistochemistry showed that FLMSCs had extended capacity of differentiating into mesodermal, ectodermal, and endodermal lineages, and that their potential for adipogenic, osteogenic, and chondrogenic differentiation may be maintained over 25 passages. Furthermore, osteogenic and chondrogenic differentiation was used as an indicator of their differentiation capability in vivo, as evidenced by ectopic bone and cartilage formation. In summary, these results suggest that FLMSCs are a primitive population and that their extensive in vitro expansion does not involve significant functional modification of the cells, including morphology, growth, karyotype, immunophenotype, and mesodermal differentiation potential. Hence, FLMSCs might constitute an attractive cell resource for cell transplantation to induce regeneration of damaged tissues/organs.
Introduction
Stem cell therapy is currently in use for a wide array of diseases, including leukemia, autoimmune disorders, cardiovascular disease, and certain bone disorders (26). Great expectations were placed on embryonic stem cells (ESCs) for their broad differentiation potential. However, their usage for cellular therapeutics has been excluded for ethical concerns, imprinting-related developmental abnormalities, and the uncontrollable development of teratoma in a syngeneic transplantation model (29). Increasing attention has been drawn to multipotent mesenchymal stromal cells (MSCs) because of their ease of isolation and expansion, multipotency, trophic effects, immunomodulatory properties, and high homing ability to damaged tissues (39,44,45). To date, MSCs have been the focus for treating many pathological conditions in the field of gene therapy, cell transplantation, and regenerative medicine (17,34).
MSCs, as recently proposed by the International Society for Cytotherapy, can be defined by three minimal criteria: (i) the plastic adherence of the isolated cells in culture; (ii) the expression of CD105, CD73, and CD90 in greater than 95% of the culture, and their lack expression of markers such as CD45, CD34, CD14, CD11b, and HLA class II in less than 2% of the culture; and (iii) the differentiation of the MSCs into osteoblasts, adipocytes, and chondroblasts in vitro (14). These criteria are recommended to define the MSCs from adult bone marrow (ABM) (14). In addition to BM, MSCs are also present in other tissues such as cartilage, adipose tissue, dental pulp, placenta, amnion, amniotic fluid, umbilical cord blood, tendon, periodontal ligament, periosteum, synovium, synovial fluid, and in a variety of fetal tissues (3,8,10,16,21,31,37,38,43,48). Although these various MSC populations share common properties mentioned above, when compared side-by-side they exhibit differences in their gene expression profiles, immunophenotype, and the potential for proliferation and differentiation (29,46).
Considering the developmental stage of the fetus, fetal stem cells appear to represent an intermediate cell type between embryonic and adult stem cells. It is well documented that fetal MSCs are considered to be immunosuppressive, making them ideal for allogeneic transplantation (30). In addition, fetal MSCs have more amount, faster growth rate, longer telomeres, and greater longevity than ABM MSCs (22). Very recent investigations on fetal MSCs from blood, liver, BM, and aorta-gonad-mesonephros (AGM) reported that fetal MSCs were able to express pluripotent markers including Oct4, Nanog, Sox2, and SSEA-4, and differentiate directionally in vitro into multiple cell lineages (19,22,47). In light of the above reports, we speculated that fetal lung MSCs (FLMSCs) might have similar properties to MSCs from other fetal tissues. In the present study, we focused on the biological properties of FLMSCs, including growth kinetics, the expression of MSCs and pluripotent markers as well as the differentiation potential. Our data showed that FLMSCs were easily expandable for clinical relevance and capable of proliferating for 25 passages without significant telomere shortening. In addition, we demonstrated for the first time that FLMSCs were able to express pluripotent markers and differentiate in vitro into cell types of all three germ layers, and that FLMSCs showed stable marker expression and steady trilineage mesenchymal differentiation potential through 25 passages. Therefore, this study improved our understanding of the biology of FLMSCs and suggested that FLMSCs are a primitive population. FLMSCs might serve as an attractive alternative resource for cell transplantation with potential therapeutic advantages over ABM MSCs.
Materials and Methods
Ethics
Fetal tissues (n = 4) were obtained from women undergoing elective termination of second-trimester (14–16 weeks) pregnancies in Tianjin Central Hospital of Maternity, under conditions where it was clear that tissues would otherwise be discarded. This study was approved by the Medical Ethics Review Board of the Chinese Academy of Medical Science and the Peking Union Medical College in compliance with the academic guidelines regarding the use of fetal tissue for research. Pregnant women gave written informed consent for the use of tissues for research purposes. Fetal gestational age was determined by crown–rump length measurement on ultrasound.
Isolation and Expansion
Using aseptic procedures, the lung was cut into 1–2-mm3 small fragments and digested with 1 mg/ml collagenase type II (Gibco) for 40 min and with 0.25% trypsin (Invitrogen) for 30 min at 37°C with gentle agitation. After terminating the trypsin activity with serum and extensive washing of the fragments with phosphate buffered saline (PBS), all the cell suspensions were used to isolate mononuclear cells by Ficoll gradient centrifugation (Hao Yang Biological Manufacture Co. Ltd, Tianjin, China). Cell pellets were then resuspended in growth medium at a density of 5 × 10⁴ cells/ml and cultured on fibronectin (Sigma)-coated culture flasks. Growth medium was basically the same as that used by Reyes et al. (40) with some modifications and consisted of 60% Dulbecco's modified Eagle medium/Ham's F12 medium, 50 U/ml penicillin/streptomycin, 1x insulin transferrin selenium (ITS), 2 mM L-glutamine (Gibco), 40% MCDB-201, 10−8 M dexamethasone (Sigma), 2% fetal bovine serum (FBS; Hyclone), 50 ng/ml human epidermal growth factor (hEGF), and 10 ng/ml basic fibroblast growth factor (bFGF; Peprotech). The cells were maintained at 37°C and a humidified 5% CO2 with growth medium changed every 3–4 days, detached when 60–80% confluency using 0.125% trypsin-EDTA (Invitrogen) and replated at a 1:3 ratio onto noncoated plastic flasks under the same culture conditions to preserve their stem cell characteristics. If necessary two passages were performed in order to obtain a pure population of FLMSCs. Morphologically, a purity of 95% of the FLMSCs population in the culture flask was considered a pure population, a number also confirmed by fluorescence-activated cell scanning (FACS) assay.
ABM samples were obtained from volunteer donors following informed consent according to a protocol approved by the Medical Ethics Review Board of the Chinese Academy of Medical Science and the Peking Union Medical College. BM mononuclear cells were obtained by Ficoll-Paque density gradient centrifugation (Hao Yang, Tianjin, China). Cells were plated at 2 × 10⁶ cells/ cm2 in growth medium cultured on fibronectin-coated plastic flasks. After 72–96 h of culture, suspended cells were removed and replaced with fresh medium. Medium was changed every 3 days thereafter. MSCs grew as colonies that were detached with 0.1% trypsin-EDTA and subcultured at a density of 4–8 × 10³ cells/cm2.
Fibroblasts from fetal skin (FSFs) were purchased from Cell Culture Center of the Peking Union Medical College. FSFs were cultured according to the recommended protocol. Briefly, FSFs grew in expansion medium (high glucose) DMEM supplemented with 10% FBS and 50 U/ml penicillin/streptomycin and were generally split at a 1:3 ratio.
The human ES cell line (kindly provided by HUES Cell Facility/Melton Laboratory, Harvard University/ HHMI, Cambridge, USA) was maintained in ESC media consisting of KO-DMEM (Invitrogen), 50 U/ml penicillin/streptomycin, 1% Gluta-MAX™ (Invitrogen), 1% nonessential amino acids (NEAA, Invitrogen), 0.1% 2-mercaptoethanol (Gibco), 10% KO Serum Replacement (Invitrogen), 10% Plasmanate (Bayer), 10 ng/ml bFGF (with a protein carrier, Peprotech), and 12 ng/ml hLIF (option, Chemicon). The media should be changed every day. It was important to split subconfluent ESCs before they differentiated. Mouse embryonic fibroblasts (MEFs) were prepared following the proposed protocol and MEFs media comprised DMEM (Invitrogen), 50U/ml penicillin/streptomycin, and 10% FBS. MEFs were used as a feeder layer and should be plated 1–2 days before thawing/passaging ESCs.
Karyotyping
FLMSCs at the 5th and 25th passages in logarithm growth were treated with colchicine (1 μg/ml) for mitotic arrest and harvested by standard hypotonic treatment and methanol/acetic acid (3:1) fixation. Slides were prepared by standard air drying method and stained with 10% Giemsa (Sigma). The karyotypes were analyzed by a microscope. Twenty to 30 metaphase cells per culture were analyzed. The karyotype of each culture is representative of >95% metaphase cells.
Colony Forming Unit-Fibroblast (CFU-F) Assay
The CFU-F assay was performed according to previously described methods (22). Briefly, mononuclear cells isolated from fetal lung were seeded in a 60-cm2 dish at the density of 0.1–1 × 10³ cells/cm2. After 10 days, the cells were stained with 0.5% crystal violet (Sigma) and positively stained colonies (>50 cells) were counted as CFUs. Cumulative population doubling was calculated by the following formula: PD = [log10(NH) –log10(NI)]/log10(2), where PD is population doubling, N1 represents inoculum number and NH is cell harvest number (7).
Cell Proliferation Assay
Cell proliferation was evaluated by a cell proliferation enzyme-linked immunosorbent assay (ELISA) kit with 5-bromo-2′-deoxyuridine (BrdU; Roche) according to the manufacturer's protocol. FLMSCs at the 5th and 25th passages were plated at a density of 1 × 10² on 96-well culture plates for 1, 2, 3, 4, 5, 6, 7, 8, and 9 days. The growth kinetics were determined by quantifying the incorporation of BrdU during DNA synthesis as well as the relative values of different concentration, expressed as mean ± SD, and were recorded on the growth curve to reflect the growth characteristics of the cells.
Cell Cycle Analysis
After being replated, FLMSCs of passages 5 and 25 at the log phase of logarithm growth (days 4 to 7) were trypsinized and permeabilized with 70% ethanol at −20°C for at least 24 h, followed by incubation with 50 μg/ml RNase A (Sigma) for 20 min at 37°C and in 50 μg/ml propidium iodide (Sigma) for 5 min at room temperature. DNA content was analyzed in a FACScalibur flow cytometer (BD) using MODFIT software (Verity).
Telomere Length Measurement by Real-Time PCR
Telomere length was measured on K562 cell line, the 5th and 25th passage FLMSCs genomic DNA (Qiagen) using an ABI 7500 Sequence Detection System (Applied Biosystems). H-globin was used as a control for amplification. Telomere and h-globin primer sequences were as follows: telomere (forward) 5′-CGGTTTGTTTGGGTT TGGGTTTGGGTTTGGGTTTGGGTT-3′, (reverse) 5′-GGCTTGCCTTACCCTTACCCTTACCCTTACCCT TACCCT-3′; h-globin (forward) 5′-GCTTCTGACAC AACTGTGTTCACTAGC-3′, (reverse) 5′-CACCAAC TTCATCCACGTTCACC-3′. Each 20 μl reaction included 20 ng DNA, 1x SYBR Green master mix (Qiagen), and 100 nM primers. Amplification conditions were 40 cycles of a two-step PCR (95°C for 15 s, 64°C for 60 s) after initial denaturation (95°C for 10 min). A melting curve analysis was performed in order to control the specificity of the amplification products. Telomere/ single copy gene (T/S) values were calculated by 2−ΔΔCt and relative T/S values were generated by dividing sample T/S values with the T/S value of a reference cell line DNA (K562).
Flow Cytometry Analysis
FACS experiments were performed to investigate the marker profile of FLMSCs (passages 5 and 25) and ABM MSCs, enduring cryopreservation and thawing well. Cells were trypsinized and resuspended in 0.1% NaN3 PBS. Cells (1 × 10⁵) were labeled with fluorescein iso-thiocyanate (FITC) or phycoerythrin (PE)-labeled anti-human antibodies, including CD11b, CD31, HLA class II, CD45, CD34, CD14, CD117, CD29, CD13, CD90, CD44, CD166, CD73, CD49e, CD54, HLA class I, CD106, CD271 (all from BD PharMingen), CD105 (Ancell), SSEA-4 (R&D), CD133 (Miltenyi), GD2 (BD), CD146 (Chemicon), and STRO-1 (R&D). To detect intracellular antigens, 2 × 10⁵ cells (FLMSCs, ABM MSCs, FSFs, and ESCs) were fixed with ice-cold acetone for 10 min at room temperature, permeabilized with 0.1% Triton X-100 (Sigma) for 15 min at room temperature, and then labeled with the following antibodies: Oct4, Sox2 (R&D), Nanog (eBioscience), c-Myc, TRA-1-60 (Chemicon). To eliminate any nonspecific binding, the cells were washed twice with PBS and 2% normal serum for 5 min, then the cells were incubated at the same ratio of fluorochrome/protein for the isotype control and specific antibody for 30 min at 4°C. Negative controls were stained with isotype-matched FITC or PE-conjugated IgG or IgM. A total of 105 events were acquired and analyzed using FACS Calibur™ flow cytometer utilizing CELLQuest acquisition data analysis software (BD).
In Vitro Multipotent Differentiation Assays
FLMSCs were trypsinized, replated, and cultured on a coverslip in six-well plates 1 day prior to differentiation except pellet cultures for chondrogenesis. FLMSCs under growth conditions were used as negative control.
Adipogenic, Osteogenic, and Chondrogenic Differentiation
FLMSCs at the 5th and 25th passages were cultured in adipogenic, osteogenic, and chondrogenic media for 3 weeks. The differentiation media were as follows: (a) adipogenic medium consisting of 1 μM dexamethasone, 0.5 mM isobutyl-methylxanthine, 100 μM indomethacin, and 10 μg/ml insulin (all from Sigma); (b) osteogenic medium comprising 0.1 μM dexamethasone, 10 mM β-glycerophosphate, and 50 μM ascorbic acid (all from Sigma); (c) chondrogenic medium including 1x ITS, 1x linoleic acid-bovine serum albumin (Sigma), 100 nM dexamethasone, 50 μg/ml ascorbate 2-phosphate (Sigma), and 10 ng/ml transforming growth factor-β1 (TGF-β1; R&D). The differentiation media were replaced every 3–4 days. Induced cells were stained with Oil Red O, Alizarin Red S, and Alcian Blue for lipid droplets, calcium deposition, and proteoglycan deposition, respectively. Confocal microscopy assessed the expression of adipocyte-specific marker peroxisome proliferator activated receptor-γ2 (PPAR-γ2) and osteocyte-specific marker osteocalcin, while immunohistochemistry assayed the expression of chondrocyte-specific marker collagen II. For immunohistochemical study, human-specific collagen II antibody (dilution 1:50; Santa Cruz) was used as the primary antibody. The sections of cell pellets were then stained with secondary antibodies coupled with horseradish peroxidase and reactions were visualized by adding 3,3-diaminobenzidine (DAB, Sigma). Counter-staining was performed with hematoxylin (Sigma). In addition, the expression of PPAR-γ2, osteocalcin, and collagen II was detected by FACS and RT-PCR assays. Other related genes such as lipoprotein lipase (LPL), RUNX2, and aggrecan were also examined by RT-PCR.
Neural Differentiation
To induce neuroectoderm differentiation, cells were treated as previously described (30) with modifications. Briefly, cells were plated at a density of 20,000 cells/ cm2 onto fibronectin-coated glass slides in neural induction media, which consisting of DMEM/F12, 1% penicillin/streptomycin, N2 and B27 supplements (Invitrogen, which are two multicomponent cell culture supplements), plus the following conditions: (a) 20 ng/ml EGF, 10 ng/ml bFGF, and 10 ng/ml platelet-derived growth factor (PDGF; Peprotech) for 7 days; (b) 10 ng/ml bFGF, 10 ng/ml PDGF, and 50 ng/ml nerve growth factor (R&D) for 7 days. After 14 days, neural marker nestin (R&D), microtubule-associated protein 2 (MAP2), NG2, glial fibrillary acidic protein (GFAP) (all from Chemicon), and oligodendroglial marker O4 (DAKO) were assayed by FACS, confocal microscopy, and RT-PCR.
Hepatogenic Differentiation
The induction procedure was as follows: (a) 10 ng/ ml bFGF + 20 ng/ml recombinant human hepatocyte growth factor (Peprotech) + 1x ITS for 14 days; (b) 10 ng/ml bFGF + 30 ng/ml Oncostatin M (R&D) + 1x ITS for 14 days. We evaluated the mRNA and protein expression of hepatic-specific markers albumin and cytokeratin 18 (CK18) by FACS, confocal microscopy, and RT-PCR. The mRNA expression of αFP was also detected by RT-PCR analysis. Hepatocyte function was assessed by dosing albumin in culture supernatants and detecting glycogen by periodic acid schiff (PAS) staining.
In Vivo Bone-Forming Assay
Approximately 1 × 10⁷ FLMSCs (passage 5) was mixed with 40 mg of hydroxyapatite/tricalcium phosphate (HA/TCP) powder (60% HA and 40% TCP; 200–300 μm pore size; Sichuan University, China) at 37°C rotated for 90 min. A secondary matrix was formed by mixing 15 μl of mouse fibrinogen (3.2 mg/ml) and 15 μl of mouse thrombin (25 U/ml; Sigma) to form a solid fibrin gel of about 25 mm in diameter. The mixtures were immediately transplanted SC into the dorsal and orofacial surface of 8-week-old female immunocompromised beige nude mice (NIH-bg-nu/ν-xid; Institute of Experimental Animal, Beijing, China) as previously described (1). For controls, the same amount of HA/TCP powder without cells was transplanted SC in an identical fashion. Surgical procedures were performed in accordance with specifications of an approved institutional small animal protocol. The animals were randomly divided into experimental and control groups (n = 6 for each group) and each mouse received three implants. The implants were harvested at 8 weeks posttransplantation, fixed in 4% buffered paraformaldehyde for 2 days, followed by 1 day in 20% sucrose, decalcified, and then frozen in liquid nitrogen. The implants were cut to into 5-μm sections and stained by hematoxylin and eosin (H&E) as well as in von Kossa (3% AgNO3) for bone formation. Expression of osteocalcin was analyzed with a specific goat anti-human osteocalcin antibody (Santa Cruz) at 4°C overnight and rabbit anti-goat IgG (Southern Biotechnology Associates) was used as a secondary antibody.
In Vivo Cartilage-Forming Assay
The cultured FLMSCs were resuspended at a density of 1 × 10⁷/ml in 2% low-viscosity alginate (Sigma) in 0.9% NaCl. The alginate/cell suspension was dripped slowly to a 100 mM CaCl2 solution at room temperature for 30 min of polymerization, then the alginate was gelled. One milliliter of alginate gel mixed with or without FLMSCs was immediately implanted into subcutaneous pockets on the dorsum surface of 8-week-old nude mice (n = 6 for each group). After 8 weeks, the mice were anesthetized, and then the constructs were carefully separated from the surrounding fibrous capsule and immediately stored in liquid nitrogen. Besides H&E, sections (5 μm) were stained with Alcian Blue to visualize proteoglycans. The expression of collagen II in the sections was detected by goat anti-human specific antibody.
In Vivo Teratoma Formation Assay
According to recent studies by Kishi (28), approximately 1 × 10⁷ FLMSCs (passage 5) were injected intramuscularly into the dorsal flank of 8-week-old nonobese diabetic-severe combined immunodeficiency (NOD-SCID) mice under anesthesia. The same volume of PBS was injected in the control group (n = 6 for each group). At 8 weeks postinjection, no tumor was found in either experimental and control groups.
Confocal Microscopy
Adherent to glass coverslips, cells were fixed with ice-cold acetone and permeabilizated in 0.1% Triton X-100. Cells were incubated overnight at 4°C with primary human-specific antibodies such as PPAR-γ2 (dilution 1: 300), osteocalcin (dilution 1:300), collagen II (dilution 1:80; Santa Cruz), nestin (dilution 1:700; R&D), O4 (dilution 1:700; DAKO), MAP2 (dilution 1:750), GFAP (dilution 1:800), NG2 (dilution 1:300; Chemicon), albumin (dilution 1:250), CK18 (dilution 1:150; Santa Cruz), Oct4 (dilution 1:200; R&D), Sox2 (dilution 1:200; R&D), Nanog (dilution 1:350; eBioscience), c-Myc (dilution 1:350; Chemicon), TRA-1-60 (dilution 1:350; Chemicon). Primary antibodies were developed with corresponding secondary FITC or PE antibodies at a concentration of 1:500 for 1 h at room temperature. Cells were incubated for 1–2 h at 37°C with human-specific SSEA-4 (dilution 1:200; R&D). 4,6-Diamidino-2-phenylindole (DAPI; Vector Laboratories) was used to counterstain the nucleus. Coverslips were transferred to glass coverslides and examined on a TCS-SP2 confocal laser-scanning microscopy (Leica). A dual-band fluorescence filter set at FITC (or PE)/DAPI was used for acquisition of images in both fluorescence channels.
RT-PCR
Primer Information and PCR Conditions
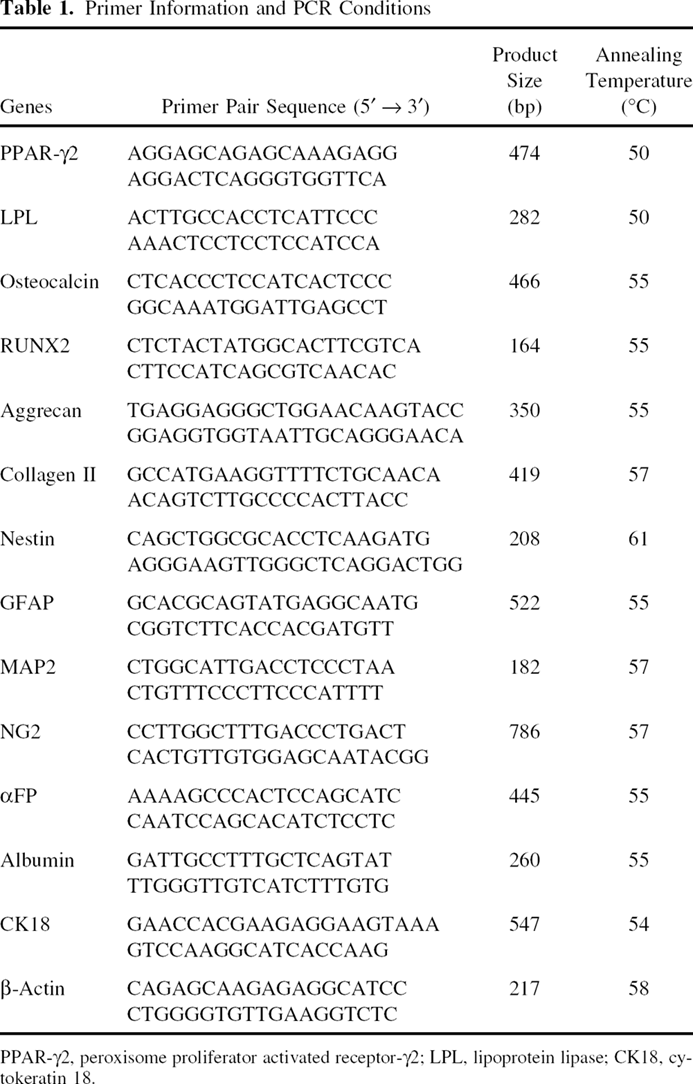
PPAR-γ2, peroxisome proliferator activated receptor-γ2; LPL, lipoprotein lipase; CK18, cytokeratin 18.
Statistical Analysis
Results were calculated for our data and presented as mean ± SD where indicated. Statistical significance was defined as p < 0.05 using Student's t-test or analysis of variance (ANOVA). The t-test was used after ANOVA to determine where the significance difference lies, and then Bonferroni correction was used for the adjustment for multiple comparisons.
Results
Biological Properties of FLMSCs
FLMSCs were isolated from fetal lungs and expanded in vitro. After enzymatic digestion and growth in the plastic flask for 48 h, adherent cells exhibited heterogeneity: one having fibroblastoid morphology and the other with a more round appearance. Round cells rapidly disappeared with passaging and adherent cells showed similar spindle-shaped morphology after the second passage. After 2 weeks, spindle-shaped cells reached confluence with a whirlpool-like appearance at the low-power magnification (Fig. 1A). FLMSCs were passaged at a dilution of 1:3 and reached confluence within 2–3 days. Then the passage procedures were repeated and some cells had been cryopreserved in liquid nitrogen before they were thawed and cultured. At passage 25, FLMSCs maintained their spindle morphology (Fig. 1B) and a normal karyotype of 46, XX (Fig. 1C). No euploidy was found in per culture and no aneuploidy in P5. Aneuploidy in P25 was less than two percent. The growth kinetics of FLMSCs was reflected by CFU-F, BrdU incorporation, and cell cycle assays. For calculating the starting number of MSCs in the mononuclear cell fraction, CFU assays were performed and the colonies were 29.4 + 5.26/1000 cells (Fig. 1D). FLMSCs presented an average population doubling time of 31.01 ± 1.95 h and the growth rate remained stable through 25 passages (about 60 population doublings). We observed that FLMSCs in the present study could withstand about 25, 28, 30, and 33 passages without obvious decline in proliferation ability and significant changes in morphology. FLMSCs proliferated much more rapidly than ABM MSCs (data not shown). The results of the BrdU incorporation assays were recorded on the growth curve that displayed ‘S“ type (Fig. 1E). After being replated, FLMSCs had an adaptive phase, then began to expand rapidly and move into a log phase of logarithm growth. At the eighth day, the cell number reached the highest level and cell growth was in a plateau phase. To confirm proliferation-related observations, an analysis of cell cycle status was performed by measuring DNA content using flow cytometry. Flow cytometric analysis of cell cycle phase revealed that more than 90% of the cells were at G0/G1 and only a small proportion of cells actively proliferated (Fig. 1F). The growth pattern of FLMSCs was consistent with the results demonstrated by Guo and colleagues (23). Real-time PCR demonstrated that there was no significant difference between passage 5 (relative value: 10.41 ± 3.33) and passage 25 (relative value: 6.67 ± 0.74) in the length of telomere, in spite of a trend for a decrease after 25 passages (Fig. 1G). In short, FLMSCs were plastic-adherent cells with spindle-shaped morphology, great proliferation potential, and a normal karyotype. Moreover, these properties could be maintained up to 25 passages.
Biological properties of FLMSCs. (A) The whirlpool-like appearance of FLMSCs at the 5th passage. (B) The spindle-shaped morphology of FLMSCs at the 25th passage. (C) A normal karyotype of FLMSCs at the 25th passage. (D–F) Proliferation kinetics of FLMSCs are demonstrated by CFU-F assay (D), the BrdU incorporation assay (E), and the cell cycle analysis (F). (G) The telomere length among FLMSCs of the 5th and 25th passages is shown by relative T/S values (n = 4). P5: 5th passage; P25: 25th passage. Error bars represent SD. The p-values were calculated with Student's t-test. NS: not significant. Scale bars: 200 μm (A), 50 μm (B).
Stability of the Marker Profile of FLMSCs During Long-Term Expansion
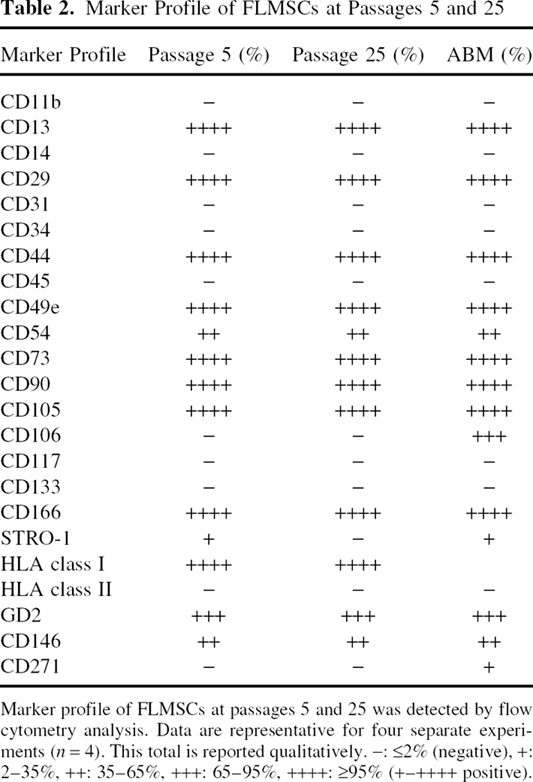
Flow cytometry was used to monitor the marker profile of morphologically homogenous FLMSCs (P5 and P25) as well as ABM MSCs. Between the two passages of FLMSCs, the expression levels of the examined markers were stable during the long expansion period. More than 95% of the MSC population expressed CD44, CD29, CD73, CD90, CD13, CD49e, CD105, CD166, and HLA class I, whereas FLMSCs moderately expressed CD54, CD146, and GD2. By contrast, these cells lacked expression (≤2% positive) of CD45, CD34, CD14, CD117, CD11b, CD31, CD106, CD133, CD271, STRO-1, and HLA class II (Table 2). The examined markers were similar to the phenotype of MSCs suggested by the International Society for Cytotherapy (14), except that the expression of STRO-1, CD271, and CD106 was lower than ABM MSCs. The expression of GD2, a recently suggested marker for MSCs, was in conformity with the previous study (32). The rate of positivity for CD146 was similar to other fetal organs and lower than ABM MSCs as well as pericytes (11,22). This might be relevant to their negative expression of STRO-1 and the different MSCs source (3,22). Moreover, flow cytometry analysis was used to determine the expression of pluripotent markers in FLMSCs (passages 5 and 25), FSFs, and ESCs (positive control), though no consistent data indicated that MSCs expressed pluripotency markers. FLMSCs were found to express high level of Oct4, Nanog, Sox2, c-Myc, and TRA-1-60, and moderate level of SSEA-4 (Fig. 2A). Confocal microscopy confirmed their subcellular localization in the nuclei (Oct4, Nanog, Sox2, c-Myc, and TRA-1-60) or cytomembrane (SSEA-4) of FLMSCs (Fig. 2B). Specifically, out data indicated that there was no significant difference in ESCs marker expression between the two passages of FLMSCs. Altogether, FLMSCs showed stable expression level of MSCs and pluripotent markers even after ex vivo long-term expansion and enduring cryopreservation and thawing. FSFs negatively expressed these pluripotency markers, while ESCs were strongly positive for the detected pluripotency markers (Fig. 2A).
The protein expression of pluripotent markers. (A) The percentage of positive cells in FSFs, ABM MSCs, FLMSCs (P5 and P25), and ESCs as evaluated by flow cytometry. There is similar expression level between passages 5 and 25 of FLMSCs. (B) The subcellular localization of pluripotent markers in FLMSCs as demonstrated by confocal microscopy. FSFs: fetal skin fibroblasts; ABM MSCs: adult bone marrow MSCs; P5: 5th passage; P25: 25th passage; ESCs: embryonic stem cells. Scale bars: 50 μm (B). Marker Profile of FLMSCs at Passages 5 and 25 Marker profile of FLMSCs at passages 5 and 25 was detected by flow cytometry analysis. Data are representative for four separate experiments (n = 4). This total is reported qualitatively. —: ≤2% (negative), +: 2–35%, ++: 35–65%, +++: 65–95%, ++++: ≥95% (+-++++ positive).
Extended Differentiation Potential for Mesodermal, Ectodermal, and Endodermal Lineages
A well-established hallmark of MSCs is their trilineage mesenchymal differentiation, but MSCs from other tissues have been reported to possibly differentiate, though controversial, into nonmesodermal cells (2). The observation that FLMSCs expressed pluripotent markers prompted us to study whether FLMSCs had greater differentiation potential to give rise to diverse cell types of all three germ layers. In order to verify the possibility, we investigated their differentiation into mesodermal, ectodermal, and endodermal lineages by culturing them in specific induction media as described above.
Mesodermal Differentiation: Adipogenesis, Osteogenesis, and Chondrogenesis
To evaluate the adipogenic differentiation, FLMSCs at passages 5 and 25 were subjected to induction in adipogenic medium and resulted in cell growth arrest. Positive Oil Red O staining showed lipid vacuole formation in both experimental passages of cells (Fig. 3Ai). In complement to the results by histochemical analysis, induced FLMSCs exhibited marker expression of PPAR-γ2 by FACS (Fig. 3B) and confocal microscopy (Fig. 3Ci) and mRNA expression of the adipocyte-specific marker genes LPL and PPAR-γ2 (Fig. 3D) compared to noninduced FLMSCs (Fig. 3B–D). However, the expression of PPAR-γ2 was not strongly correlated with the degree of Oil Red O staining. The reason for the discrepancy between the results might be related to the different detection sensitivity between FACS and staining. FACS could detect the low expression of PPAR-γ2 in the induced cells, while staining was positive unless intracytoplasmic lipid droplets in fat cells were large enough.
Trilineage mesodermal differentiation of FLMSCs (passages 5 and 25). (A) Adipogenic, osteogenic, and chondrogenic differentiation in induced cells of passages 5 and 25 is visualized by Oil Red O (Ai), Alizarin Red S (Aii), and Alcian Blue (Aiii) staining, respectively. (B) Flow cytometry analysis demonstrates the expression of lineage-specific markers including PPAR-γ2, osteocalcin, and collagen II at the 5th and 25th passage induced cells as well as control cells (n = 4). Error bars represent SD. The p-values were calculated with analysis of variance (ANOVA). After ANOVA to determine where the significance difference lies, the t-test was used and Bonferroni correction was used for the adjustment for multiple comparisons. NS: not significant. *p < 0.05. (C) Confocal microscopy results show that the 5th and 25th passage induced cells are positively stained for PPAR-γ2 (Ci) and osteocalcin (Cii) by comparison with control cells markers. All nuclei are counterstained with DAPI (in blue). (Ciii) Immunohistochemical staining for collagen II in the induced and control cells. (D) RT-PCR analysis indicates the mRNA expression level of lineage-specific gene in the 5th and 25th passage differentiated cells as well as control cells. β-Actin was used as an internal control. P5I: 5th passage induced cells; P25I: 25th passage induced cells; C: control cells. Scale bars: 100 μm (Ai, Aii, Aiii, Ciii); 50 μm (Ci, Cii).
To assess the osteogenic differentiation, FLMSCs of passages 5 and 25 were exposed to osteogenic medium and became positive to Alizarin Red S staining for calcium deposition (Fig. 3Aii), strong alkaline phosphatase (AP) activity (data not shown), and von Kossa staining for mineralized deposits (data not shown). To further prove the osteoblast phenotype, the upregulation of osteoblast-specific marker osteocalcin was evaluated by flow cytometry (Fig. 3B) and confocal microscopy (Fig. 3Cii). RT-PCR analysis showed increasing amounts of the lineage-specific genes osteocalcin and RUNX2 (Fig. 3D). In contrast, osteogenic phenotype was not observed in negative controls (Fig. 3B–D).
To determine chondrogenic differentiation, FLMSCs (passages 5 and 25) were pelleted and incubated in chondrogenic medium. Cell pellets increased in size due to production of extracellular matrix. Thin sections of the pellets were positively stained with Alcian Blue (Fig. 3Aiii) for sulfated proteoglycan in extracellular matrix. Compared with control cells (Fig. 3B–D), more than 90% of cells were positive for collagen II as assessed by flow cytometry (Fig. 3B) and the increasing expression of chondrocyte-specific genes such as aggrecan and collagen II was revealed by RT-PCR analysis (Fig. 3D). Immunohistochemical analysis also confirmed the expression of collagen II in the induced cell pellets, whereas in control pellets, only a high-density cell layer was observed (Fig. 3Ciii). Together, these results confirmed the trilineage mesenchymal differentiation of FLMSCs, which could be maintained over 25 passages.
Neuroectodermic Differentiation
To induce neural differentiation, FLMSCs were cultured in classical serum-free medium (DMEM/F12 supplemented with N2 and B27), which was suitable for neural stem cells. At the end of the induction period, the majority of the cells reduced proliferation, acquired a neuronal morphology of the long cell process, and were strongly stained with the neuronal lineage marker MAP2, the neural progenitor marker nestin, and the neural marker NG2 (Fig. 4A). Likewise, FACS analysis of MAP2, nestin, and NG2 expression showed that the positive cells were increased from 0.19 ± 0.26%, 21.92 ± 0.45%, and 0.16 ± 0.77% in control cells to 99.47 ± 1.23%, 99.52 ± 0.91%, and 93.52 ± 0.59% in induced cells, respectively (Fig. 4B), although control cells expressed nestin. The mRNA expression of these markers was observed by RT-PCR (Fig. 4E). In addition, a considerable portion of cells differentiated into glial cells. They maintained a flattened morphology and were positive staining for the classical glial fibrillary acidic marker GFAP as well as oligodendroglial marker O4 (Fig. 4C). Flow cytometry experiments revealed that differentiated cells expressed increasing amounts of markers compared with FLMSCs (Fig. 4D). PCR analysis further confirmed the elevated expression level of GFAP (Fig. 4E). Our flow cytometry data suggested that a fraction of differentiating cells might coexpress the neuronal and glial markers, which was consistent with Beltrami et al.'s results (6). Thus, these data demonstrated that FLMSCs were successfully induced to neuronal and glial cells, which verified their ectodermal differentiation capacity.
Introduction of neuroectoderm-like cells. (A) Neural markers (e.g., MAP2, nestin, and NG2) are positively stained as visualized by confocal microscopy. Longer processes are formed in the induced cells. (B) Flow cytometry data show the higher expression of MAP2, nestin, and NG2 in induced cells than in control cells (n = 4). Error bars represent SD. The p-values were calculated with Student's t-test. *p < 0.05. (C) Confocal microscopy confirmed the positive staining of glial-specific protein (e.g., GFAP and O4) compared with negative control. Glial cells maintain a flattened morphology. (D) FACS data show the upregulation of GFAP and O4 in comparison with negative control (n = 4). Error bars represent SD. The p-values were calculated with Student's t-test. *p < 0.05. (E) Transcriptional expression of neuron glial-specific genes is shown by RT-PCR analysis. I: the induced cells; C: control cells. Scale bars: 50 μm (A, C).
Endodermal Hepatocyte Differentiation
To verify the ability of FLMSCs to generate endodermal derivatives, we assayed these cells for hepatic differentiation. After induction, FLMSCs exhibited a larger cytoplasmic volume with an elliptical shape. For the purpose of further confirming efficient hepatic induction, we assessed the expression of hepatocyte-specific markers within these cells on the protein or mRNA level. Mature hepatocyte markers such as albumin and CK18 were positively stained as visualized by confocal microscopy (Fig. 5A). FLMSCs cultured in growth medium did not stain with albumin and CK18 antibodies (Fig. 5A). The positive percentages for albumin and CK18 in the induced cells were 91.75+1.15% and 63.94 ± 0.39%, respectively, while the positive percentages in control cells were very low for albumin (0.57 ± 0.19%) and CK18 (0.43 ± 0.25%) (Fig. 5B). In addition to albumin and CK18, RT-PCR analysis also confirmed the mRNA expression of the early endoderm differentiation marker αFP (Fig. 5C). Afterwards, we examined whether hepatocytes derived from FLMSCs were functionally competent. These cells displayed the ability to store glycogen as demonstrated by PAS staining, while no staining was noticed in negative control (Fig. 5D). Moreover, we evaluated their abilities to produce albumin as tested by dosing the concentration in culture supernatants. Our data demonstrated that the level in the supernatant of induced cells (0.702 ± 0.103 g/L) was significantly higher compared with control (0.083 ± 0.117 g/L) (Fig. 5E). Therefore, these findings confirmed that FLMSCs-derived hepatocyte- like cells had similar expression pattern of hepatocyte-specific markers and exhibited liver-specific functions similar to human hepatocytes. In summary, we demonstrated that FLMSCs directly differentiated in vitro cell type of all three germ lineages.
Endodermal hepatocyte differentiation of FLMSCs. (A) Confocal microscopy analysis demonstrates the protein expression of hepatocyte-specific markers such as albumin and CK18. The induced cells exhibit a larger cytoplasmic volume with an elliptical shape. (B) FACS data show the higher expression of albumin and CK18 in the induced cells than in control cells (n = 4). Error bars represent SD. The p-values are calculated with Student's t-test. *p <0.05. (C) Hepatocyte-specific gene expression of αFP, albumin, and CK18 is confirmed by RT-PCR. (D) The induced cells are positive (purple) in periodic acid schiff (PAS) staining compared with control cells. (E) The concentration of albumin in the supernatant of the induced cells is significantly different from that in the supernatant of control cells (n = 4). Error bars represent SD. The p-values are calculated with Student's t-test. *p < 0.05. I: the induced cells; C: control cells; CK18: cytokeratin 18; αFP: α-fetoprotein. Scale bars: 50 μm (A, D).
Assessment of Bone and Cartilage Formation as Well as Tumor Formation Following In Vivo Implantation
To demonstrate functional role of FLMSC-mediated new bone formation, expanded FLMSCs with HA/TCP powder as their carrier were transplanted subcutaneously into the dorsal and orofacial regions of the immunocompromised mice, resulting in a considerable alteration of the dorsal and orofacial outline (Fig. 6A). Histologic analyses 8 weeks after transplantation revealed the existence of newly formed bone tissue in the vicinity of the scaffold that was the source of calcium and phosphorus for mineralization, consistent with a recent report (35). Bone tissue characterization was displayed by H&E staining (Fig. 6Bi) as well positive von Kossa staining (Fig. 6Bii) for mineral deposition. Analysis of human-specific osteocalcin by confocal microscopy confirmed the presence of human cells undergoing bone differentiation. Osteocalcin-positive cells were always seen in the vicinity of the scaffold, as expected for physiologic bone formation (Fig. 6Biii). Conversely, bone formation was not observed in HA/TCP particle transplants that received scaffold only (no cells), with only some sporadic cell infiltration (Fig. 6Bi–iii). Hence, these data indicated that FLMSCs had a capability of forming new bone in vivo transplantation and suggested a practical potentiality for cell therapy for disorders of bone.
Ectopic bone and cartilage formation. (A) The gross appearance of HA/TCP particles beneath the dorsal and orofacial surface of nude mice. Black arrows indicate the transplants (n = 6 for each group). (Bi, Bii) The formation of neo-bone exists in the vicinity of HA/TCP as revealed by H&E (Bi) and von Kossa (Bii) staining. Arrowheads indicate new bone formation; arrows indicate fibrous tissue. (Biii) The expression of human osteocalcin is observed by confocal microscopy. Arrowheads indicate new bone formation; arrows indicate fibrous tissue. (C) Two subcutaneous injections of alginate gel in nude mice. Black arrows indicate the implants (n = 6 for each group). (Di, Dii) The formation of neo-cartilage is detected by H&E (Di) and Alcian Blue (Dii) staining. Arrowheads indicate new cartilage formation; arrows indicate fibrous tissue. (Diii) The expression of human collagen II in the section of alginate gel is confirmed by confocal microscopy. Arrowheads indicate new cartilage formation; arrows indicate fibrous tissue. E: the experimental group; C: the control group; HA/TCP: hydroxyapatite/tricalcium phosphate; OC: osteocalcin. Scale bars: 100 μm (Bi, Bii, Biii, Di, Dii, Diii).
To examine the potential of FLMSCs for cartilage formation, FLMSCs were seeded into three-dimensional alginate constructs and implanted subcutaneously into the dorsal regions of nude mice (Fig. 6C). After 8 weeks posttransplantation, the volume of the implants was about 50–60% of the initial size due to being capsuled by connective tissues and not tightly attached to the surrounding tissues. Histochemical analysis of the implants showed H&E staining (Fig. 6Di; the upper row) as well as positive Alcian Blue (Fig. 6Dii; the upper row) staining for neo-cartilage. There were substantial amounts of alginate-containing cells encased in cartilage lacuna, which was looser than a genuine cartilage matrix (Fig. 6Di, ii). Moreover, samples were fixed and immunostained positively for the cartilage-specific marker of collagen II with human-specific antibody as confirmed by confocal microscopy (Fig. 6Diii), which was consistent with the results of Cai and coworkers (9). As a result, we verified the differentiation potential of FLMSCs to form cartilage in vivo.
To test the ability of FLMSCs to form tumor, cells were injected into NOD-SCID. After 8 weeks, injected FLMSCs were absorbed and no evidence of tumor formation was found. The finding revealed that the transplantation of FLMSCs for cell-based therapies involved little risk of tumor formation. Taken together, we demonstrated that FLMSCs were capable of mediating bone and cartilage formation and had little risk for tumor formation.
Discussion
MSCs are presently the most promising cell source for therapeutic applications. To date, most of what we know about MSCs has been derived from work on ABM MSCs. The expression of pluripotent markers in ABM MSCs and their differentiation towards extramesodermal lineages are still a highly controversial issue, but a decrease in differentiation capacity as well as stem cell number with increasing donor age has greatly limited their utilization (49). This prompts researchers to look for alternative sources of MSCs. Many studies have revealed that there is an optimal amount of MSCs in the second-trimester fetus (25,36). Our previous studies have shown that MSCs from fetal lung meet the putative definition of MSCs and possess the neural differentiation potential (15). Recently, it has been demonstrated that MSCs from many fetal tissues express pluripotent markers such as Oct4, Nanog, Sox2, and SSEA-4 (19,22,47). Moreover, the expression of pluripotent markers Oct4, Nanog, and Sox2 may be retained to 17 passages (19). In line with these results, our results confirmed that FLMSCs could express pluripotent markers Oct4, Nanog, Sox2, TRA-1-60, c-Myc, and SSEA-4, and have the extended differentiation potential to give rise to cell types of all three germ layers. More importantly, FLMSCs showed stable expression of MSCs and pluripotent markers and maintained in vitro potential for trilineage mesenchymal differentiation to at least 25 passages, which suggested the additional advantages of FLMSCs over ABM MSCs for cell transplantation.
Therefore, these studies might support and extend previous findings demonstrating the therapeutic potential of fetal MSCs for human use. Ontogeny (fetal vs. adult) might be one reason for these differences between fetal and adult MSCs. Since 2002, numerous papers in the literature have described MSC-like cell cultures, or even cell lines, in adult and fetal tissues and named mesodermal progenitor cells (MPCs) (40), multipotent adult progenitor cells (MAPCs) (27), AFS (12), marrow-isolated adult multilineage inducible cells (MIAMI cells) (13), etc. Many of them reported to express Oct4 have the ability to generate cells of multiple germinal layers, including mesenchymal cells as well as neuroectoderm-like cells (41). It remains unclear whether these cell populations exist in vivo, or are a cell phenotype induced by culture. In the culture conditions, FBS has been used in most studies, whose concentrations usually vary between 2% and 20% (24). Because of the highly variable culture conditions among different laboratories and a marked impact of specific culture media on MSC cultures (24), standardized MSC preparations will be essential. Consequently, whether the differences between fetal and adult MSCs could be attributed to the specific culture conditions used need further studies.
FLMSCs in the present study were plastic-adherent and spindle-shaped cells that rapidly proliferated in culture, though they exhibited a finite lifetime (over 60 population doublings) and did not display properties of immortalized cells. MSCs were reported to be passaged in vitro for a limited period, usually about 8–15 passages, equivalent to 25–40 population doublings, before they stopped proliferation and began to degenerate (24). Notwithstanding, our data indicated that FLMSCs were able to be cultured for at least 25 passages without significant telomere shortening and maintain morphology as well as a normal karyotype after ex vivo long-term expansion, which was associated with the ability to self-renew, which proved them preferable for cell transplantation and tissue regeneration (33). Cell cycle status revealed the existence of a large percentage (>90%) of quiescent cells (G0/G1) along with a smaller population (<10%) of proliferating cells, which was consistent with their stem cell characteristics and suggested the active proliferation of the small subset so as to maintain the great growth rate of the whole population (15).
FACS analysis indicated that the marker panel of FLMSCs were comparable to the phenotype of MSCs on the basis of the studied markers (CD44+, CD29+, CD73+, CD90+, CD13+, CD49e+, CD105+, CD166+, CD54+, HLA-class I+, and CD45−, CD34−, CD14−, CD117−, CD11b−, CD31−, CD133−, HLA-class II−) (14). However, some antigens that expressed on ABM MSCs appeared not to be expressed on cultured fetal lung cells (i.e., STRO-1, CD271, and CD106). Although STRO-1 was a marker used to isolate MSCs from BM, some ABM MSCs did not express STRO-1 (18). The negative expression of CD271 might be relevant to culture because CD271 was lost during culture (32). As for CD106, ABM MSCs were positive, while MSCs from fetal BM and lung negatively expressing CD106, so its expression might be ontogeny related (25). Additionally, FLMSCs expressed elevated level of novel surface markers GD2 and CD146 in line with recent findings (11,22,32). Special attention should be paid to the expression of HLA class II in FLMSCs, because HLA class II is related to the immune rejection during allogeneic transplantation. Their lack of expression of HLA class II indicated the minimal risk of alloreactivity in cell transplantation, and implied the potential for allogenic delivery in immuo-competent patients. Surprisingly, expanded FLMSCs continued to express MSCs markers at similar levels through 25 culture passages. Under controlled conditions, FLMSCs were able to differentiate in vitro into osteogenic, adipogenic, and chondrogenic lineages as demonstrated by histochemical staining and by the RNA and protein expression of lineage-specific markers. Expanded ABM MSCs often encountered with a decline in differentiation potential with extended passaging as demonstrated by Banfi and coworkers (4). However, the present study showed that FLMSCs retained their trilineage mesenchymal differentiation potential over 25 passages. Taken together, FLMSCs met the currently recommended criteria to define MSCs and successfully maintained their undifferentiated phenotype in long-term culture. In the future, it would be necessary to determine whether the long-lived MSCs population were due to differences in source of origin (lung vs. BM) or resulted from the culture conditions.
Pluripotency markers have been considered as a hallmark of ESCs. However, flow cytometry analysis confirmed that FLMSCs also expressed pluripotent markers, which consequently set them apart from ABM MSCs. A few recent reports suggested that early human MSCs expressed some pluripotency markers. Fetal AGM expressed Oct4 and Nanog, while first-trimester fetal MSCs were reported to express Oct4, Nanog, Rex-1, SSEA-3, SSEA-4, TRA-1-60, and TRA-1-81 (22,47). Fetal MSCs from second-trimester BM expressed Oct4, Nanog, SSEA-4, and Sox2 (19). In addition to Oct4-expressing MSCs from amniotic fluid, placenta-derived MSCs could be induced to express Oct4, Nanog, and SSEA-4 (5,38). Therefore, the expression of pluripotent markers in fetal lung might also be possible in view of the earlier developmental origin. In this study, we confirmed that the protein expression of Oct4, Nanog, Sox2, c-Myc, and TRA-1-60 was present in more than 90% of FLMSCs as evaluated by FACS. It was reported that key to the ESCs-like nature was the expression of Oct4, Sox2, Nanog, c-Myc, and K1f4 (42). Therefore, we proposed that the nature of FLMSCs might be somewhat similar, though not identical, to that of ESCs. The expression of Oct4, Nanog, and Sox2, as Gonzalez and coworkers proposed (19), might be one explanation for the high proliferative potential of FLMSCs for 25 passages. Although surface expression of SSEA-4 was not as strong as the other markers, the expression of SSEA-4 and TRA-1-60 might allude to the naive and undifferentiated state of FLMSCs (42).
Interestingly, our further studies revealed that the positive percentages of studied pluripotent markers in FLMSCs at the 25th passage were not significantly different from those in FLMSCs at the 5th passage (p > 0.05), which demonstrated the stable expression of pluripotent markers in the 5th and 25th passage FLMSCs and raised the possibility of long-term maintenance of the primitive cells. ESCs highly expressed pluripotent markers, while ABM MSCs in the same culture conditions and FSFs negatively expressed pluripotent markers. As a result, we speculated that the culture conditions to cultivate FLMSCs might not be one reason for the expression of pluripotent markers in FLMSCs. It is worthwhile to find the explanation for this phenomenon. The expression of pluripotent markers were indicative that FLMSCs might possess the potential to differentiate into cell types derived from all three germ layers. Then differentiation studies were carried out to confirm the extended differentiation capability of FLMSCs.
Although our group had previously showed the neuronal differentiation of MSCs from fetal lung (15), this study was the first evidence that FLMSCs could differentiate in vitro into glial cells and hepatocytes. In consequence, our data suggested that the differentiation potential of FLMSCs far exceeded that of ABM MSCs. The multipotency of MSCs has understandably aroused great interest in the ability of MSCs to differentiate into tissue cells in vivo for the therapeutic treatment of various pathologies. It has recently been suggested that stemness of MSCs should also be defined as the ability to form ectopic bone in vivo (20). In the present study, FLMSCs were found to form ectopic bone and cartilage using currently available HA/TCP and alginate, respectively, which might be a great promise on the potential use of FLMSCs in bone regeneration and cartilage repair.
In conclusion, the present study improved understanding the biology of FLMSCs by demonstrating their self-renewal properties, stable MSCs, and pluripotent marker profile as well as extended differentiation capability. Therefore, our data showed that FLMSCs were a primitive cell population. In addition, FLMSCs were capable of forming ectopic bone and cartilage in vivo, which might facilitate the further research and application in the clinical restoration of simultaneously damaged bone and cartilage. Taken together, these properties of FLMSCs made them as attractive candidates for studying and comparing self-renewal and differentiation mechanisms in MSCs from different origins, for cell transplantation, or for in vitro drug screening. However, future efforts are necessary to explore their biology in vivo.
Footnotes
Acknowledgments
The authors would like to thank HUES Cell Facility/Melton Laboratory (Harvard University/ HHMI, Cambridge, MA, USA) for kindly providing Human ES cell line. The authors would like to thank Dr. Shihong Lu, Qian ren, and Qinjun Zhao for their discussion and help with the writing of the manuscript. This study was supported by 863 projects from Ministry Science & Technology of China (2006AA02A110), National Natural Science Foundation of China (30600238), and Tianjin Municipal Science and Technology Commission (07JCYBJC11200 and 08ZCKFSF03200).