
Abstract
BACKGROUND:
Periodontal disease affects over 50% of the global population and is characterized by gingivitis as the initial sign. One dental health issue that may contribute to the development of periodontal disease is foreign body gingivitis (FBG), which can result from exposure to some kinds of foreign metal particles from dental products or food.
OBJECTIVE:
We design a novel, portable, affordable, multispectral X-ray and fluorescence optical microscopic imaging system dedicated to detecting and differentiating metal oxide particles in dental pathological tissues. A novel denoising algorithm is applied. We verify the feasibility and optimize the performance of the imaging system with numerical simulations.
METHODS:
The designed imaging system has a focused X-ray tube with tunable energy spectra and thin scintillator coupled with an optical microscope as detector. A simulated soft tissue phantom is embedded with 2-micron thick metal oxide discs as the imaged object. GATE software is used to optimize the systematic parameters such as energy bandwidth and X-ray photon number. We have also applied a novel denoising method, Noise2Sim with a two-layer UNet structure, to improve the simulated image quality.
RESULTS:
The use of an X-ray source operating with an energy bandwidth of 5 keV, X-ray photon number of 108, and an X-ray detector with a 0.5 micrometer pixel size in a 100 by 100-pixel array allowed for the detection of particles as small as 0.5 micrometer. With the Noise2Sim algorithm, the CNR has improved substantially. A typical example is that the Aluminum (Al) target’s CNR is improved from 6.78 to 9.72 for the case of 108 X-ray photons with the Chromium (Cr) source of 5 keV bandwidth.
CONCLUSIONS:
Different metal oxide particles were differentiated using Contrast-to-Noise ratio (CNR) by utilizing four different X-ray spectra.
Introduction
Periodontal disease affects over 50% of the global population and is characterized by gingivitis as the initial sign. One dental health issue that may contribute to the development of periodontal disease is foreign body gingivitis (FBG), which can result from exposure to different kinds of foreign metal particles present in dental products or food. When affected by FBG, gingival tissue becomes inflamed due to the immune response to foreign material such as silica which is a known carcinogen [1–9]. However, there is no established method for clinicians to quickly diagnose whether this specific form of gingivitis is caused by an infection or a foreign material due to the difficulty of identifying lesions used to diagnose such infections. Furthermore, the lesions from gingivitis have several phases, with the final one being a transition from gingivitis to the more severe periodontitis which leads to a loss of bone attachment and even bone destruction [6]. The review by Ivanovski covers the effects of bone loss due to dental implants, known as peri-implantitis, with a detailed description of the body’s immune response to these implants as well as other foreign materials [9].
These foreign metal particles are difficult to observe using conventional pathological optical microscopy. In the past, different research groups have sought to detect metal particles in gingival tissues from dental implants made of metals or alloys such as titanium (Ti) with other approaches. In 2003, Olmedo et. al. investigated how the presence of Ti in macrophages near implant sites in the soft tissue reflected the immune response of the body to the presence of a foreign material [5]. They and other scholars have also investigated how the wear of these implants was causing the immune system of patients to react to foreign debris in different parts of the body [5–7, 10]. The foreign debris was characterized through methods such as Energy Dispersive X-ray (EDX) which requires the samples to be coated by a metal such as gold [5]. In 2010, Flatebø et. al. utilized laser ablation inductively coupled plasma mass spectroscopy (LA-ICP-MS) to identify the elemental composition of samples in a way that the metal particles inside samples could be differentiated. They also employed high-resolution optical darkfield microscope (HR-ODM) to image samples as well as Scanning Electron Microscopy (SEM) to measure the particle sizes [10]. In 2016, Fretwurst et. al. studied the effects of peri-implantitis, a condition caused by implants in a patient, by analyzing the metal elements in patient bone and mucosal tissues near the implant. They performed their analysis with Synchrotron radiation X-ray fluorescence microscopy (SRXRF) and Polarized Light Microscopy (PLM). Samples for their study were obtained during surgery as all the patients included were already confirmed to have severe peri-implant diseases [6]. In the above studies, the equipment used was very specialized, expensive, time-consuming, and not available for many scholars and clinics. Some methods such as LA-ICP-MS require special treatment of the samples, preventing analysis with other methods due to the destruction of the sample.
In this paper, we have designed a portable, affordable dual modality imaging system dedicated to metal particle differentiation in gingival tissues. Then, using Monte Carlo (MC) simulations, we have demonstrated its feasibility and optimized each component of the proposed benchtop multiple energy X-ray microscopic imaging system. The X-ray imaging in the proposed system will share the same field of view of a fluorescence optical microscope so that we can study the immune responses and their correlations with the foreign metal particles inside samples. Our system is simulated with Monte Carlo using an open-source software that is well known to simulate the interactions between high energy photons (such as X-rays) and objects. The GEANT4 Application for Tomographic Emission (GATE) software package has been used by others to optimize their own proposed X-ray imaging setups before constructing them [11–14]. Lastly, we propose a novel denoising method to improve the contrast to noise ratio of our reconstructed simulation results.
Methods
Design multiple energy X-ray microscopic imaging system
The proposed imaging system will have a novel, tunable X-ray source from Sigray, Inc (Sigray, Concord, CA, U.S.A.) and a lab-made detector. The pathological sample will be placed on a polystyrene substrate and positioned close to the X-ray detector. The components of this imaging system are described in detail below.
Tunable X-ray source
The tunable X-ray source spectra data was provided by Sigray, Inc and imported into the MC simulation software. The source could then be defined in the simulation with the parameters needed for this study starting with a very small half-cone angle of 0.11 degrees. The focal spot size of the source is approximately 4 micrometers. The X-ray tube has four types of anode metals inside the X-ray tube which allow it to generate four different X-ray spectra by switching the anode using a motor in the source. In the simulation this is done by selecting one of four spectra the X-ray source uses when the simulation begins to generate X-rays. These four anode metals are Chromium (Cr), Copper (Cu), Gold (Au), and Molybdenum (Mo). Sigray provided the quasi-monochromatic spectra data for each anode metal which was recorded in Fig. 1. The horizontal axis indicates the X-ray photon energy in units of keV. The vertical axis indicates the normalized photon number per energy bin.
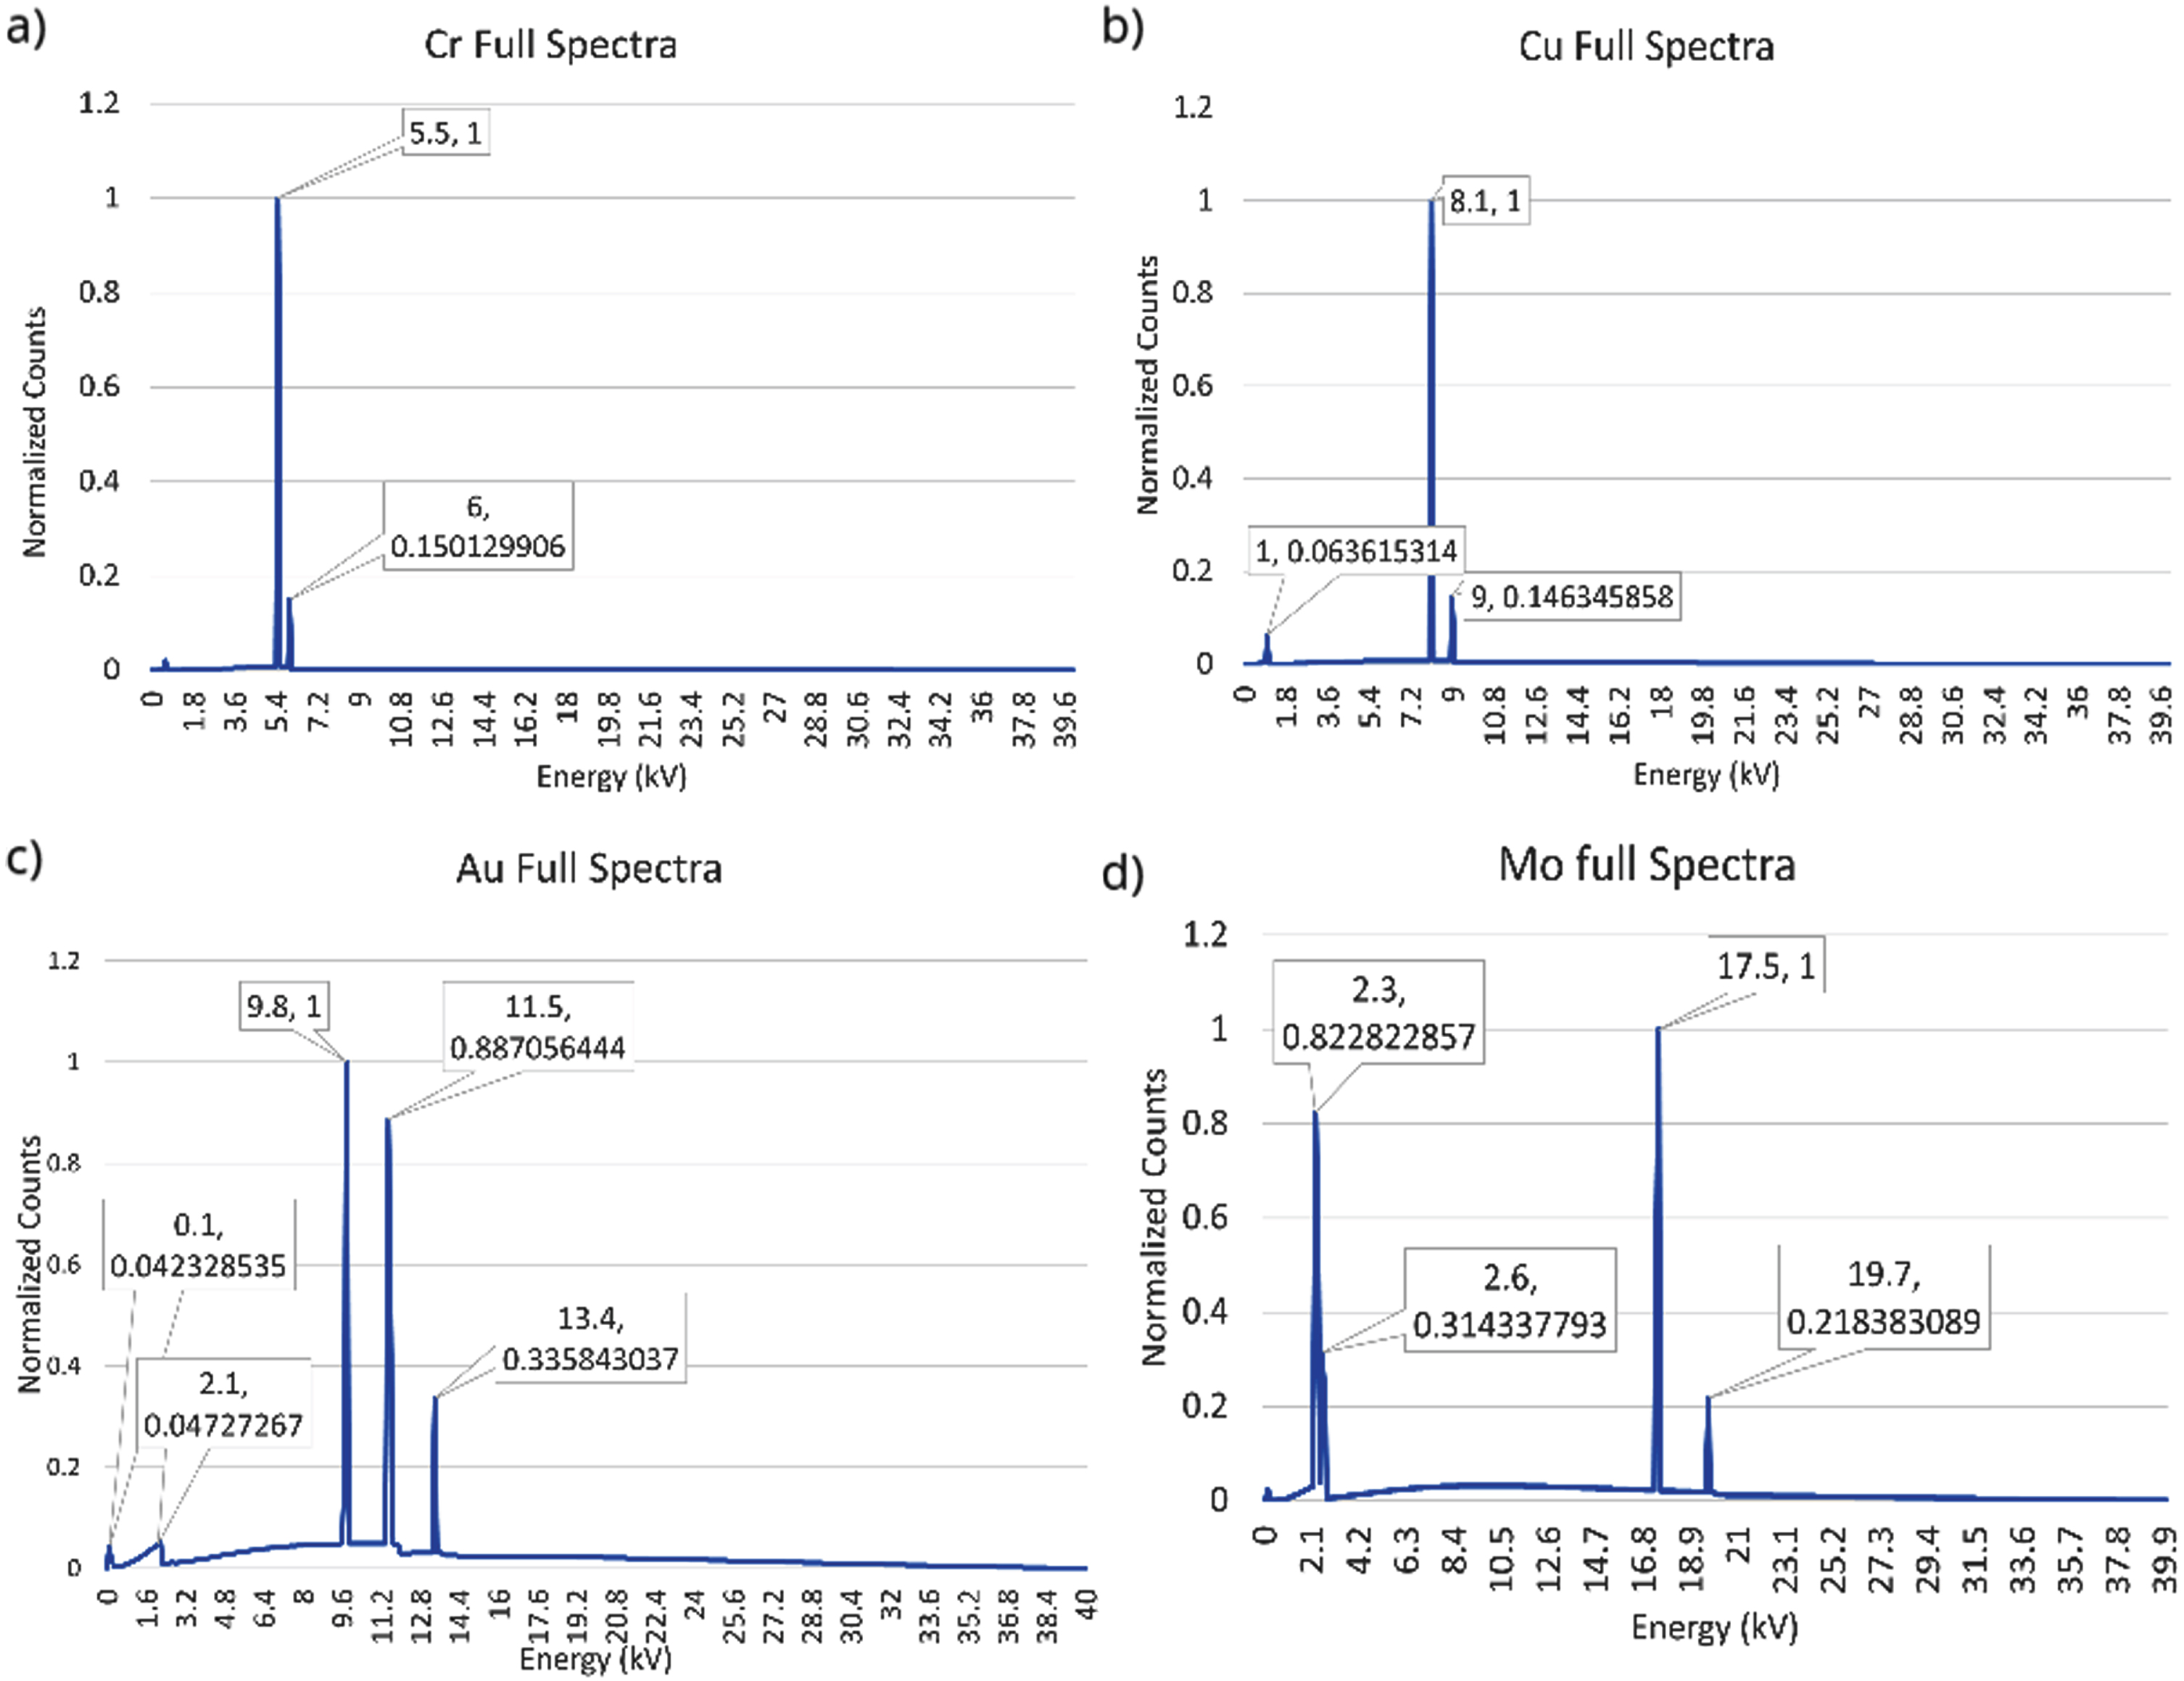
X-ray spectra for each of 4 target metals: Cr (top left), Cu (top right), Au (bottom left), and Mo (bottom right).
We will build a cesium iodide (CsI) scintillator that will be coupled with an optical microscope as the X-ray detector. The scintillator will be excited by the X-ray photons after the focused X-ray beam passes through the imaged object. The emitted optical photons from the scintillator will be collected by the optical microscope. The same optical microscope can be used as a typical fluorescence optical microscope after we switch the X-ray source and scintillator by a laser source and transparent stage. Fig. 2 shows the CAD design when the X-ray source is used, with the scintillator in front of the optical path so that the emitted photon from the scintillator will be collected by the optical microscope which is equipped with a 10x magnification object lens and a 1x magnification tube lens. The lens system is mounted on a charge coupled device (CCD) camera. The achievable spatial resolution depends on the thickness of the scintillator. With the thinner scintillator, we have better spatial resolution but with less X-ray photon stopping power and measurement sensitivity. Thus, the expected spatial resolution of this microscope-based detector is 1 micrometer.
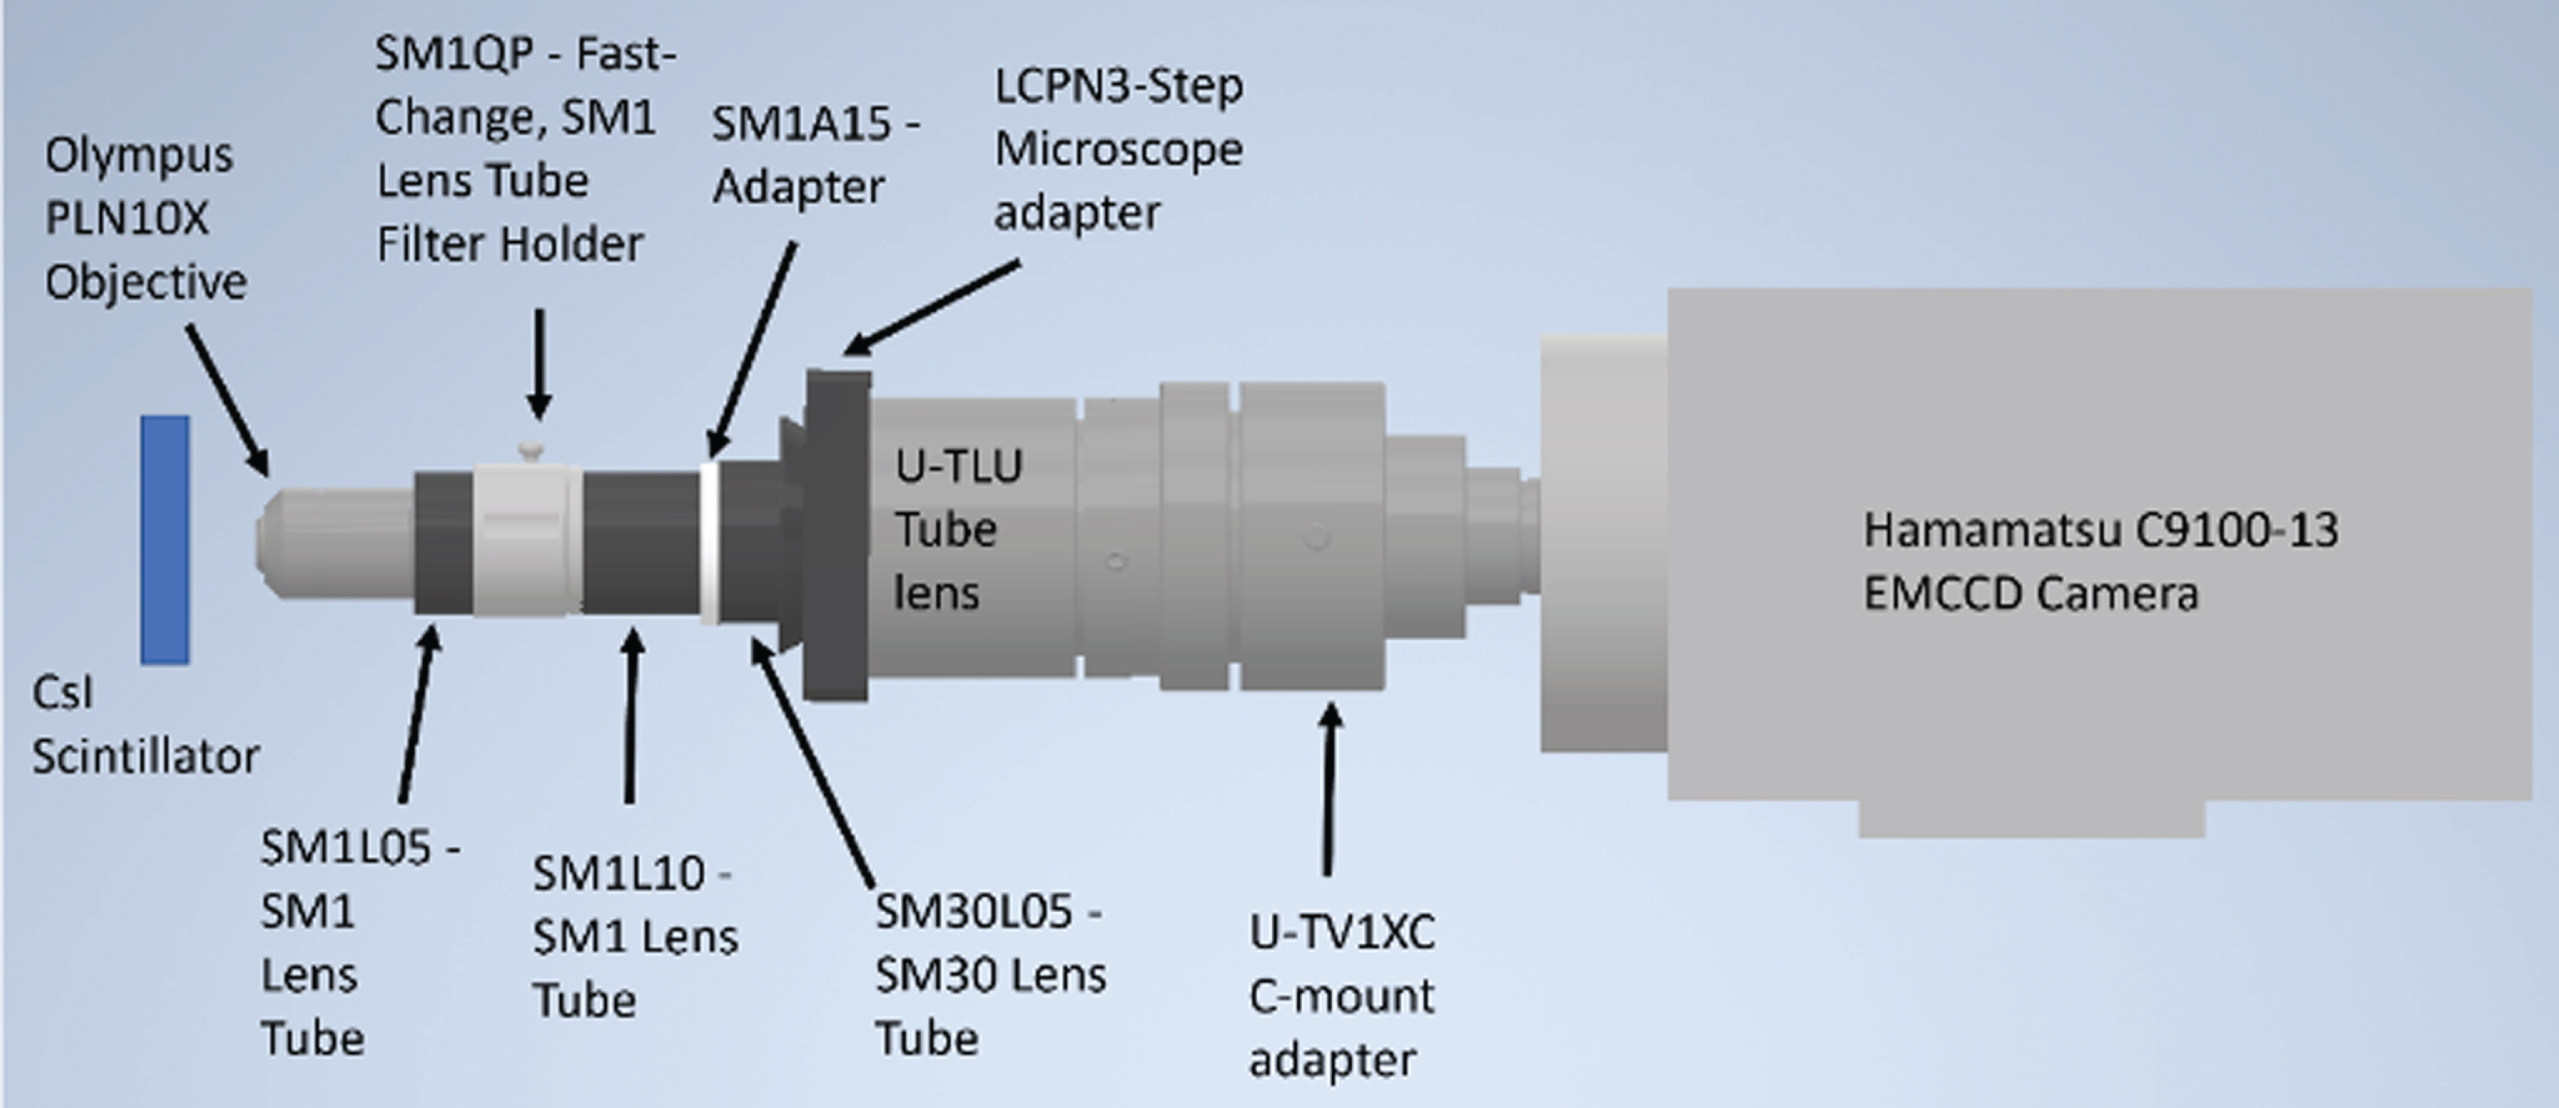
CAD design of the CsI scintillator and microscope-based X-ray detector.
During low X-ray attenuation, a polystyrene sheet was the selected substrate to place the sample on during X-ray imaging. The sheet is 10 mm by 10 mm in length and width with a thickness of 0.17 mm in the simulation. The tissue sample was defined as water in GATE as 2 mm by 2 mm with a thickness of 5 micrometer because water has an attenuation like that of soft tissues in X-ray imaging. Each of the metal oxides are discs with a diameter of 2 microns and a thickness of 2 micrometers. We have selected five metal oxides (called metal oxides for simplification, although silicon dioxide is not a metal oxide), embedded inside the water sample: silicon dioxide, aluminum oxide, titanium dioxide, zinc oxide, and iron oxide. These five metal oxides were found in many dental products. Their positions in the sample are indicated in Fig. 3 (left). A GATE simulation is then performed to determine whether these materials can be detected in an attenuation-based X-ray projection.
GATE can define a detector of any size using the Phase Space Actor function which tracks the position of any photon which strikes it. This allows the detector’s pixel sizes to be defined when reconstruction of the projection occurs. So, to test the smallest single particle the X-ray projection imaging can detect, we created a sample of particle targets with different sizes from 0.25 to 2 micrometers in diameter as shown in Fig. 3(right) and compared them using a simulated detector with a pixel size of 0.5 micrometers. The standard simulation places the object 1 mm from the detector and the source 10 mm from the object creating a 10x magnification in the simulation. The leftmost column particles have a diameter of 2 micrometers. The 2nd leftmost column targets have a diameter of 1 micrometer. The 3rd leftmost column targets have a diameter of 0.5 micrometer. And the rightmost column targets have a diameter of 0.25 micrometers. The same metal oxide particles are placed in one row with five total metal oxide particles from top row to bottom row. The distances between rows and columns of these metal oxide particle targets are 5 micrometers.
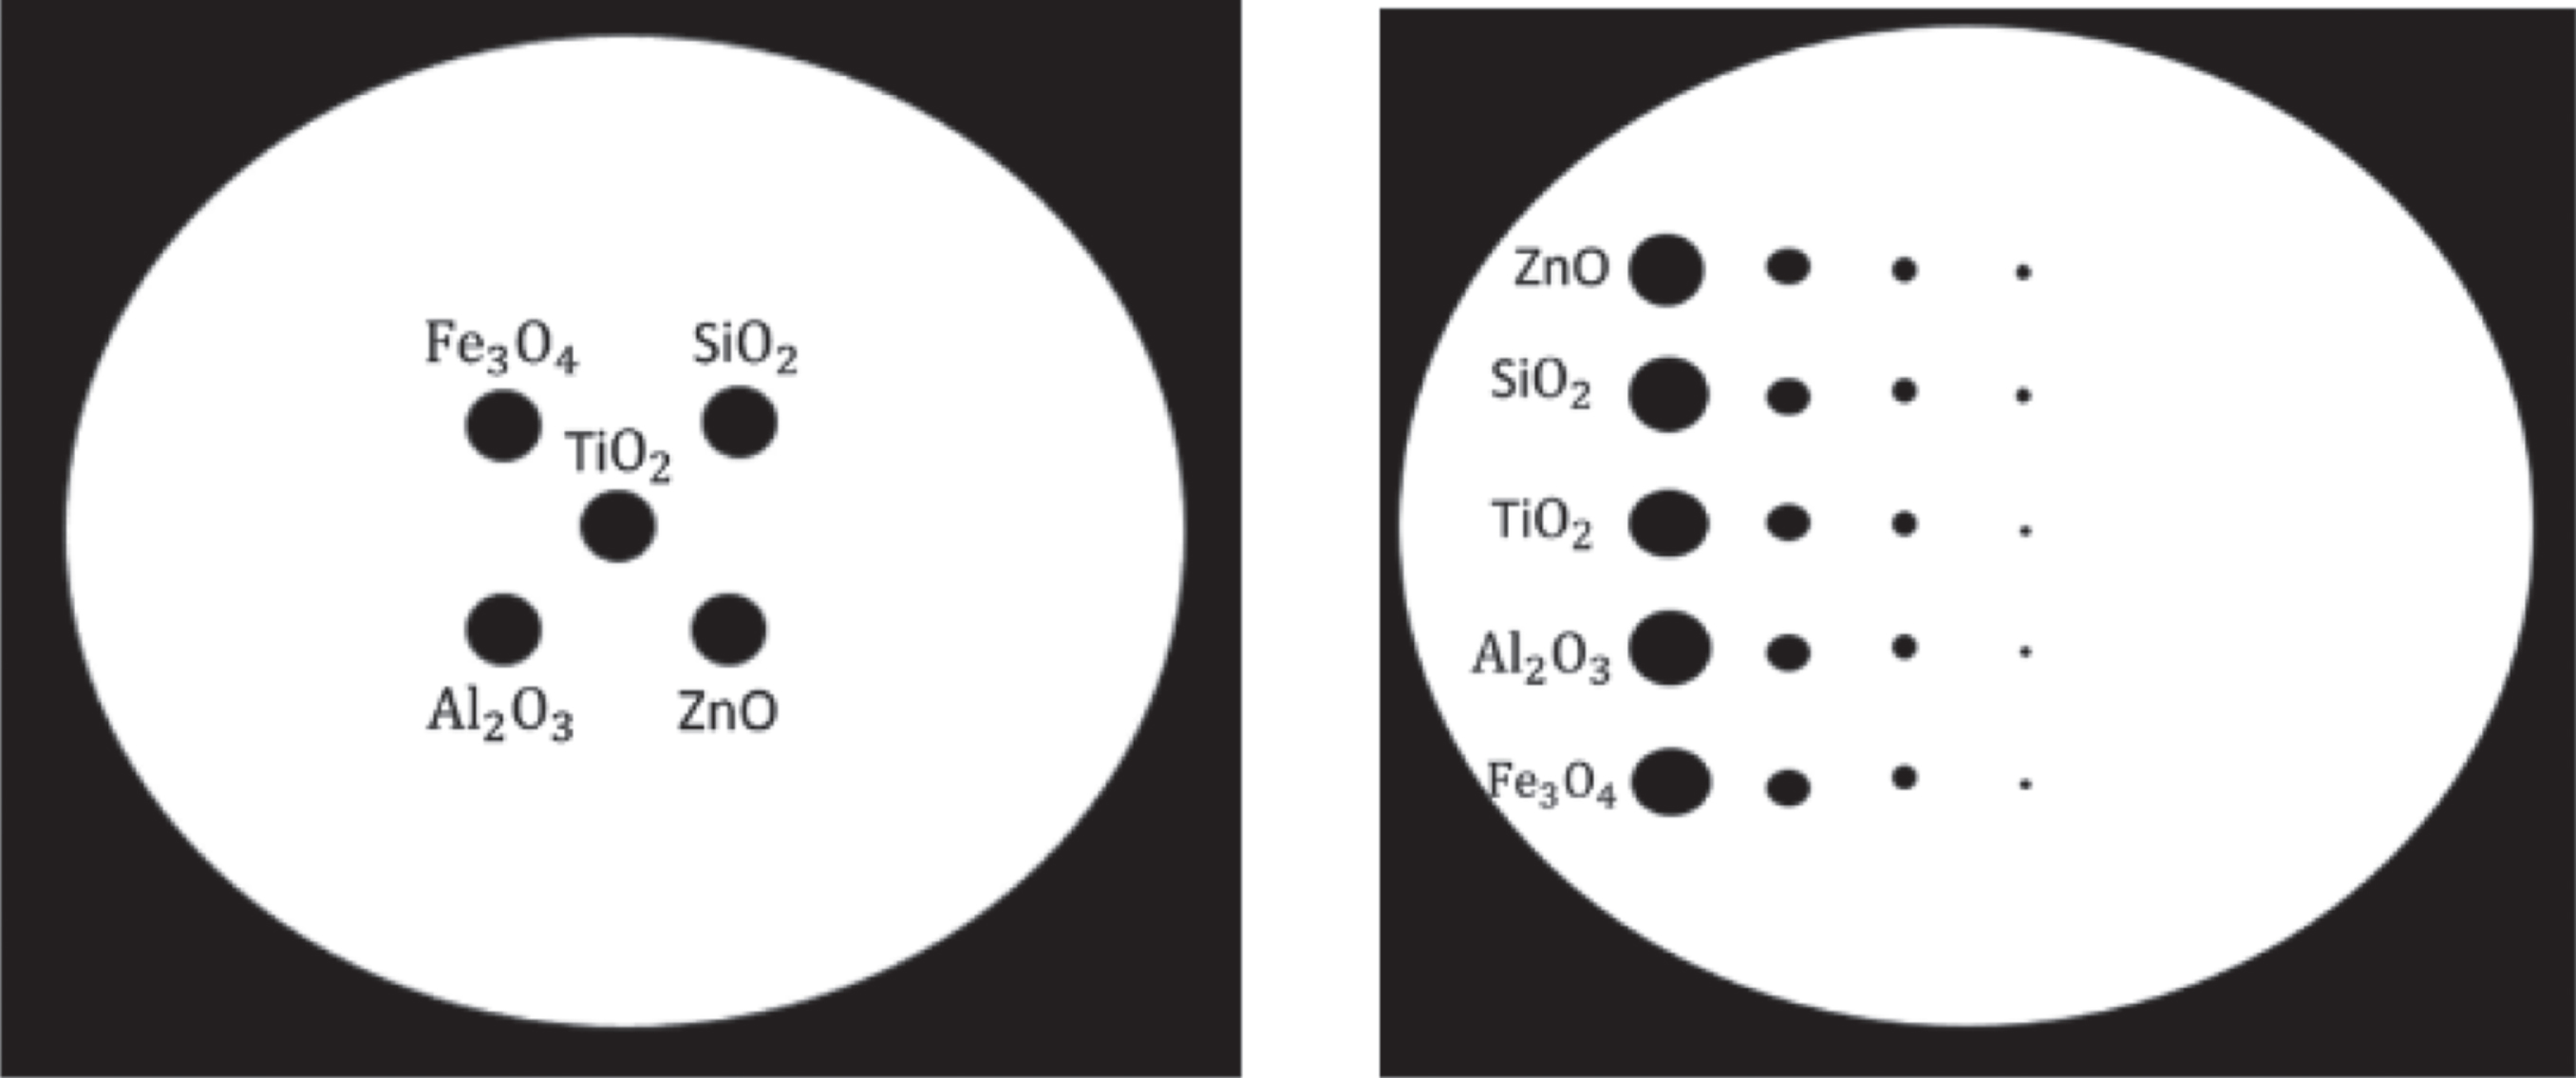
(Left) The sample of five metal oxide particles with a diamter of 2 micron diameter; (Right) The sample of particles with different sizes from 0.25 micrometer to 2 micrometers.
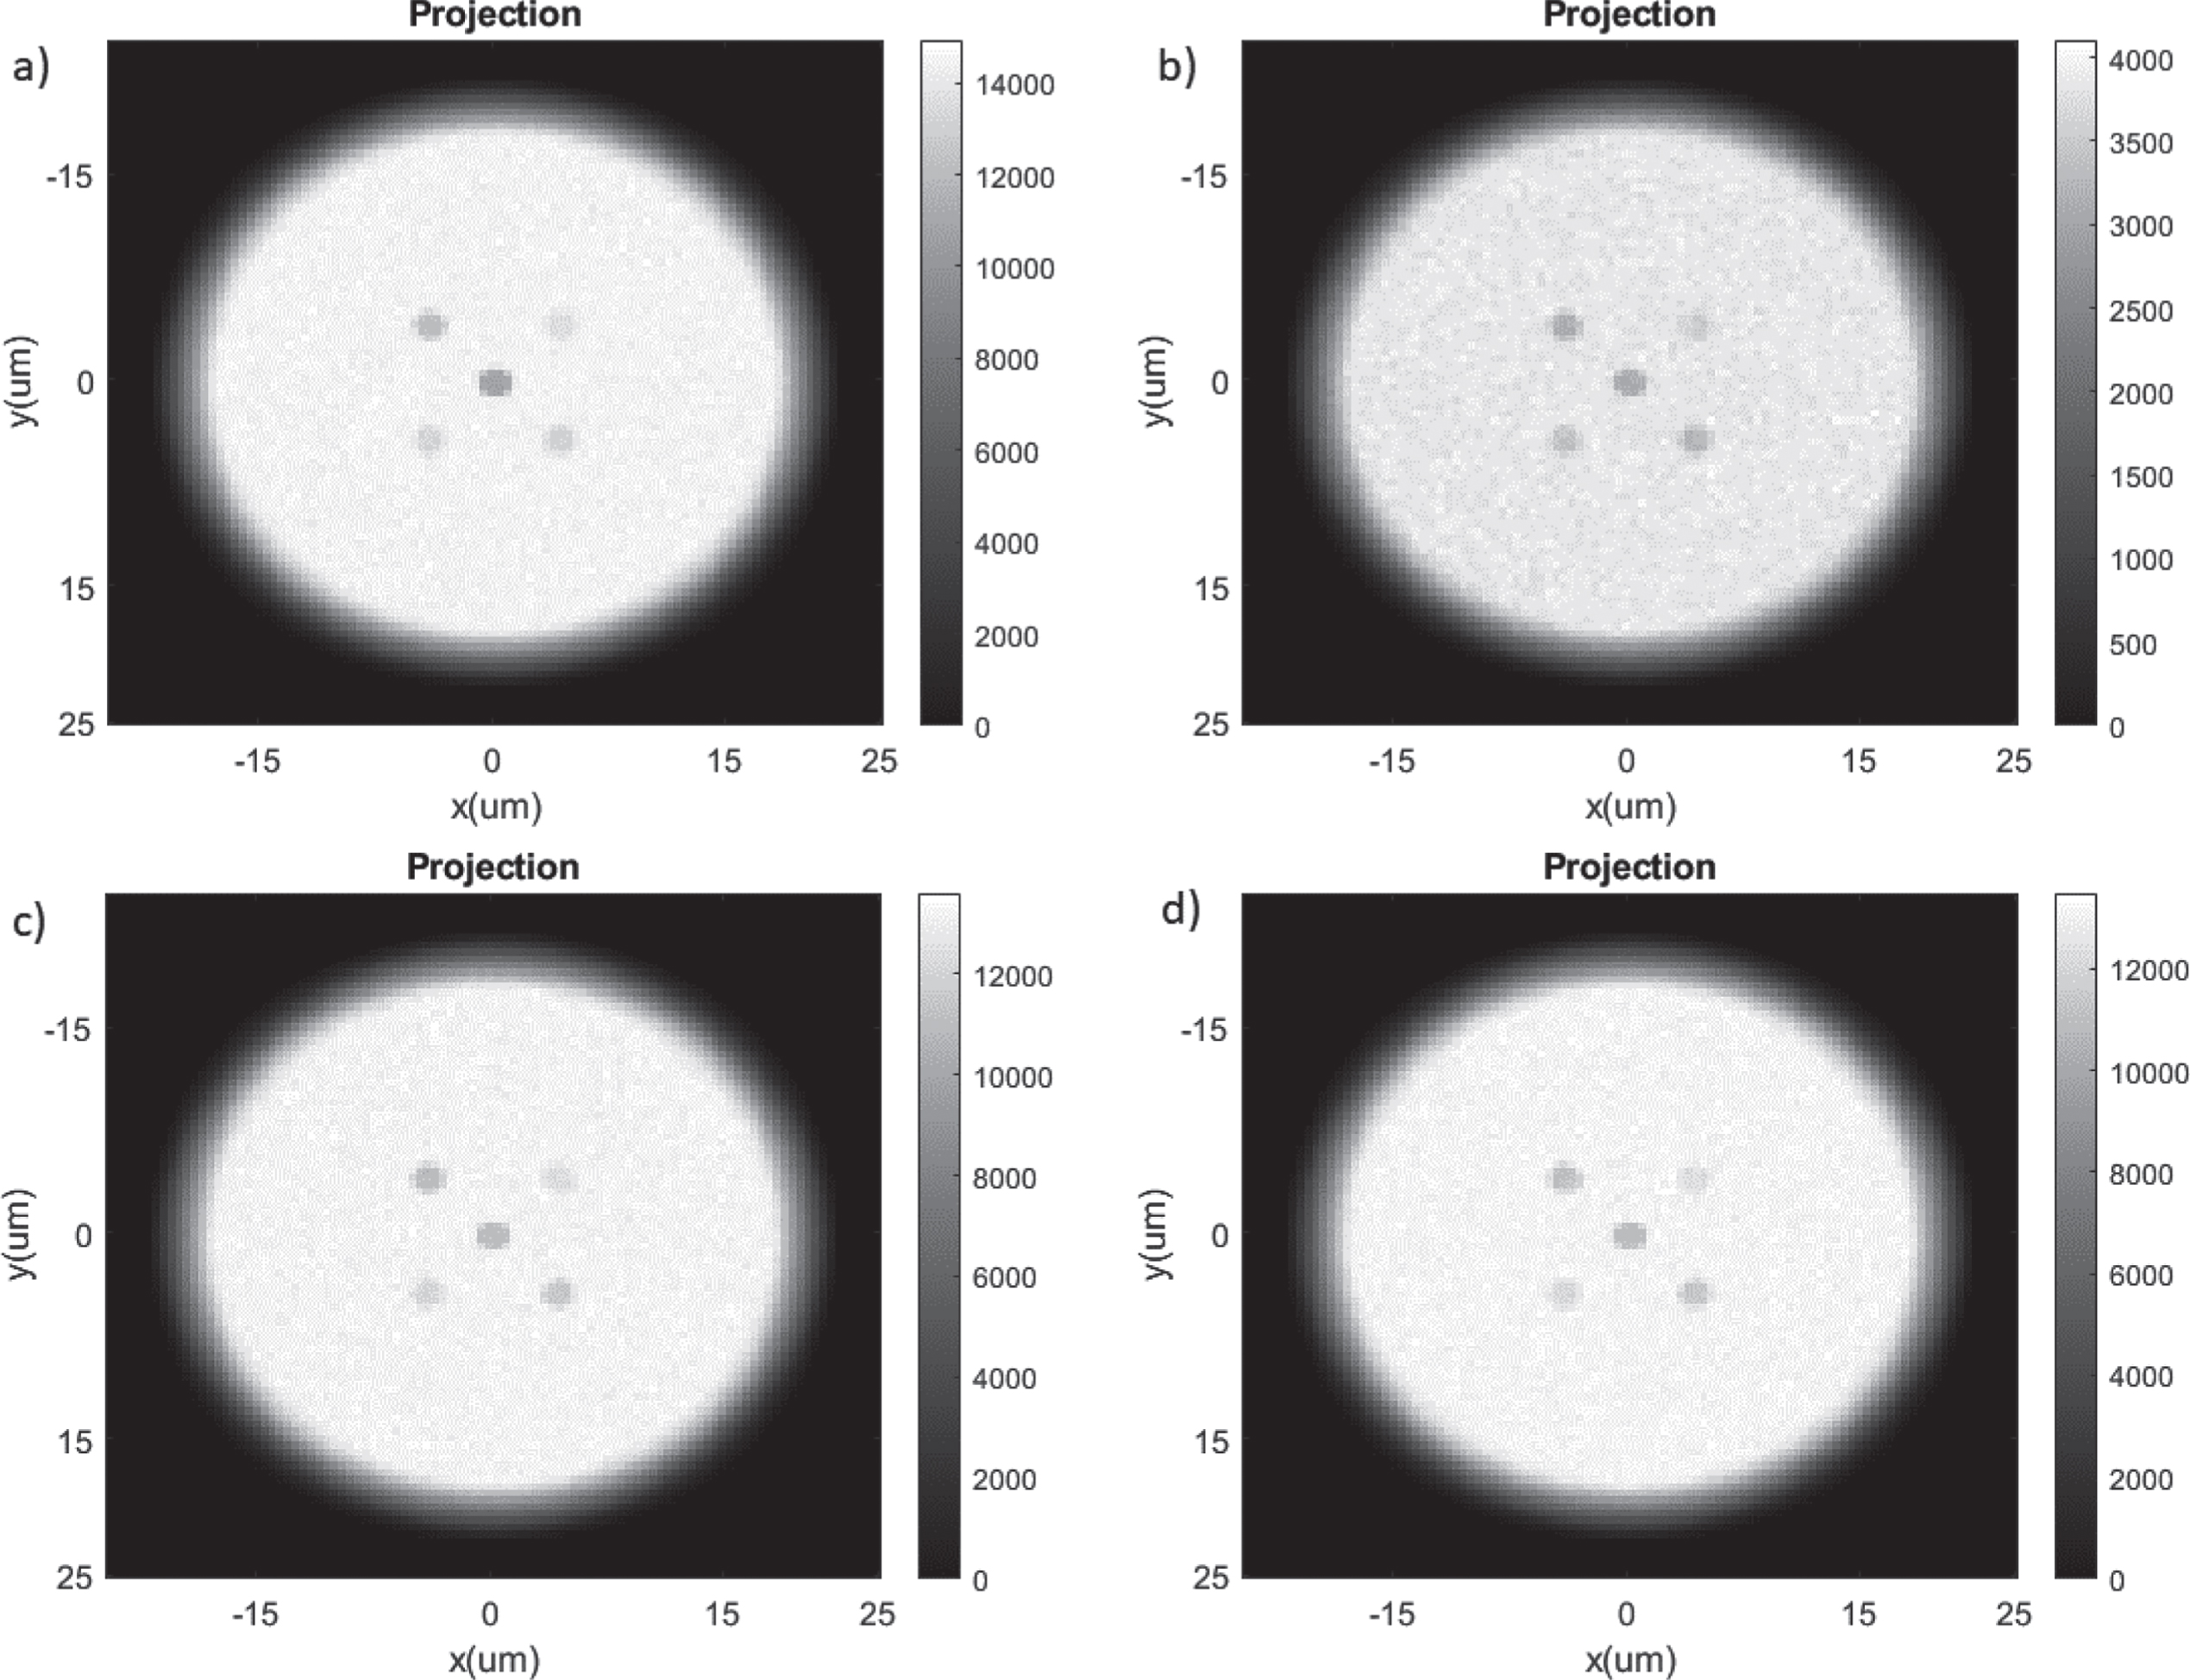
Simulated X-ray images of the samples using 5 kV energy band spectra produced by the (a). Chromium, Cr, target anode, (b). Molybdenum, Mo, target anode, (c). Copper, Cu, target anode, and the (d). Gold, Au, target anode from the Sigray Source using 108 X-rays. Targets kept in the same arrangement as Fig. 3(left).
GATE was used in this study to simulate the attenuation-based X-ray projection imaging [11]. The GATE package was downloaded from opengatecollaboration.org and was run in our cluster with 20 cores and 64 GB memory. We used macro files to program the systematic parameters like X-ray energy, photon number, and positions. In our simulations, we have assumed an ideal detector which stopped all arriving X-ray photons as well as recorded their energy and positions for future processing. The simulation follows the standard components needed for a CT simulation, the imaging object, X-ray source, detector, tissue sample including the metal oxides and the polystyrene substrate sheet. Each simple geometry can be created in GATE and then the material of any given geometry can be assigned if the elemental composition is known. This allows users to determine the effects of several diagnostic systems ranging from CT, such as our system, to PET. The information captured in GATE can be used for attenuation-based X-ray imaging measurements based on the X-ray counts for a given setup as well as the dose a sample receives from the system. More details about GATE simulation setup and objects are described below.
GATE was designed by medical physicists for the purpose of recording the interactions between X-rays and an imaging object with several studies having tested the robustness of the software which is why it was used for the X-ray component of our proposed system [12–14]. To optimize the system parameters and as guidance for our future experimental system design, we simulated the following system parameters by studying how these parameters affect the image quality: the target anode used to produce X-rays, the X-ray tube focal spot size, the spectra for each of these targets, the number of X-rays initialized, and the size of the pixels for the detector. For example, we have simulated three different X-ray focal spot sizes such as 1, 2, and 4 micrometers in diameter. For each case, the X-ray photon number was changed from 106 to 109 with a step size of 10 times.
The pathological samples are mimicked with a water phantom and the metal oxide particles are embedded inside this phantom. The sample patch which contains the metal oxides is set at the origin of the instance. The polystyrene sheet is centered 87.5 microns behind the sample sheet just to prevent the geometries from overlapping since the sheet is 170 micrometers thick. The detector is then 1 mm behind the sample. The X-ray interaction position in detector of each photon is recorded. We record the positions with the Phase Space Actor in GATE which allows us to use MATLAB script to adjust the number of pixels in the X-ray projection imaging because the detector does not have a predetermined number of pixels.
We have also simulated narrowed X-ray spectra cases with energy bandwidths of 5 keV and 10 keV, respectively, for all four target metals. For Cr and Cu, the narrowed energy band is centralized at the highest energy peak. For Au, the narrowed energy band is centralized at the peak of 11.5 keV. For Mo, the narrowed energy band starts from 0 keV to include the peak of 2.3 keV.
Denoise algorithms
Using denoising algorithms, the noise in the image can be differentiated from the oxides we wish to identify. This requires training the algorithms with data previously acquired during the simulations so that key traits can be classified by the algorithm. The result is an image with a higher contrast-to-noise ratio (CNR) as the oxides are separated from the noise producing a higher quality image.
Here, our goal for denoising is not only to increase CNR for the metal oxides but also for them to have enough distinction to be recognized separately. For this reason, we apply four different denoising techniques, specifically: 2D wavelet denoising (biorthogonal wavelet), Denoising Convolutional Neural Network (DnCNN) by Zhang et al (MATLAB implementation) [15], Block-matching and 3D filtering (BM3D) by Dabov et al [16] and Noise2Sim by Niu et al [17].
However, for this paper, only the best results are shown. Both DnCNN and BM3D tend to create a more “visually appealing” denoised image, but they often fail to retain the quantitative properties within the projection images that are necessary for classifying different metal oxides. In this regard, Noise2Sim provides not only an increase in the mean CNR but also a relative reduction in their variances for all photon numbers, which allows the most separation in their values. Thus, Noise2Sim is the most suitable denoising algorithm for our purpose. Noise2Sim was trained separately for the different photon numbers with a learning rate of 10-4 for photon numbers 106, 107, and 108; and 10-5 for photon number 109. Adam optimizer was used to train the network with MAE as the loss function.
The base architecture of Noise2Sim is a two-layer UNet structure with a residual connection. An illustration of the network architecture is shown in Fig. 8. It has been designed to work on datasets that have images with similar feature distributions with similar noise characteristics, such as CT scans, where the neighboring slices have ample mutual information or repeated imaging experiments with similar image patterns and noise profiles, which is precisely what we have.
Since the Noise2Sim architecture does not require any reference noiseless ground truth scan and works if there is a similar image, it is considered self-supervised. Even without an extensive database, Noise2Sim works if we have only two images from the same distribution. Unlike deep supervised models, for Noise2Sim, we need to retrain the model parameters if we switch to images with different distributions. Hence, we obtain a more domain-specific iterative non-linear noise-removing algorithm rather than a deep generalized and universal noise remover.
To understand how it is applied in our work, let us consider an image database X, which has images x i ∈ X. In our case, we have two databases—one with sample-included projections (i = 1, 2, 3, 4) and another with only sample-free background projections (i = 1, 2, 3). For either database, Noise2Sim requires an image pair from that database x i and x j (j ≠ i) that have similar image and noise characteristics to perform denoising.
At first, the model takes one of the two images as an input x
i
and provides an image f (x
i
, θ) of the same size as an output. Here, θ denotes the network parameters. Then, we generate a distance matrix d
ij
by measuring the Cartesian distance of the images over small local patches of 7 × 7 with a stride of 1 × 1, as stated in the original paper. After that, we obtain the dissimilarity mask m
ij
which is a binary map by setting a threshold value. For our work, we heuristically selected the threshold value to be the standard deviation calculated from a background region patch, which differs for different photon numbers. If the distances exceed the threshold, we select a pixel value of 1, and if it does not, we select a pixel value of 0. Hence, we get a binary mask of the locations with dissimilarity higher than the predefined threshold. Mathematically,
Finally, we optimize the Noise2Sim model parameters by reducing the L1 norm between both x i and x j only for the pixels where the dissimilarity is higher, by multiplying both scans with the dissimilarity mask.
The loss function is as follows:
Since we have two different datasets, we apply Noise2Sim separately on both datasets to denoise them effectively, and then calculate the CNR. From the results, it is evident that Noise2Sim outperforms a deeply supervised noise-removing network such as DnCNN.
To evaluate the image quality, we calculate the CNR ratio for both attenuation X-ray images and phase-contrast X-ray images. Following our paper in 2016 [18], we used the following equation:
We report our simulation results on how the different systematic parameters affect the CNR of five different metal oxides. Then, we described how the denoising algorithms improve simulated images.
Effects of different X-ray spectra
Figure 4 depicts the X-ray projection images of the samples using 108 X-ray photons and 4 micrometers focal spot size and 5 keV energy bandwidth for the X-ray anode metal of Chromium (a), Molybdenum (b), Copper (c), and Gold (d), respectively. The X-ray detector for this study has a pixel size of 0.5 micrometers and 100 by 100 pixels. As expected, we see the differences among CNRs for different particles due to the different energy peaks and different energy ranges for four different X-ray anode metals, which is very helpful for differentiation between the different particles. The calculated CNRs are listed in Table 1, from which we see that particles with light atomic number have larger attenuations/CNR in the low energy band and particles with heavy atomic number have higher attenuation/CNR in higher energy band. However, since the CNR range is close for the lighter materials, it is necessary to be able to differentiate particles from one another by employing the use of several source anodes as described below.
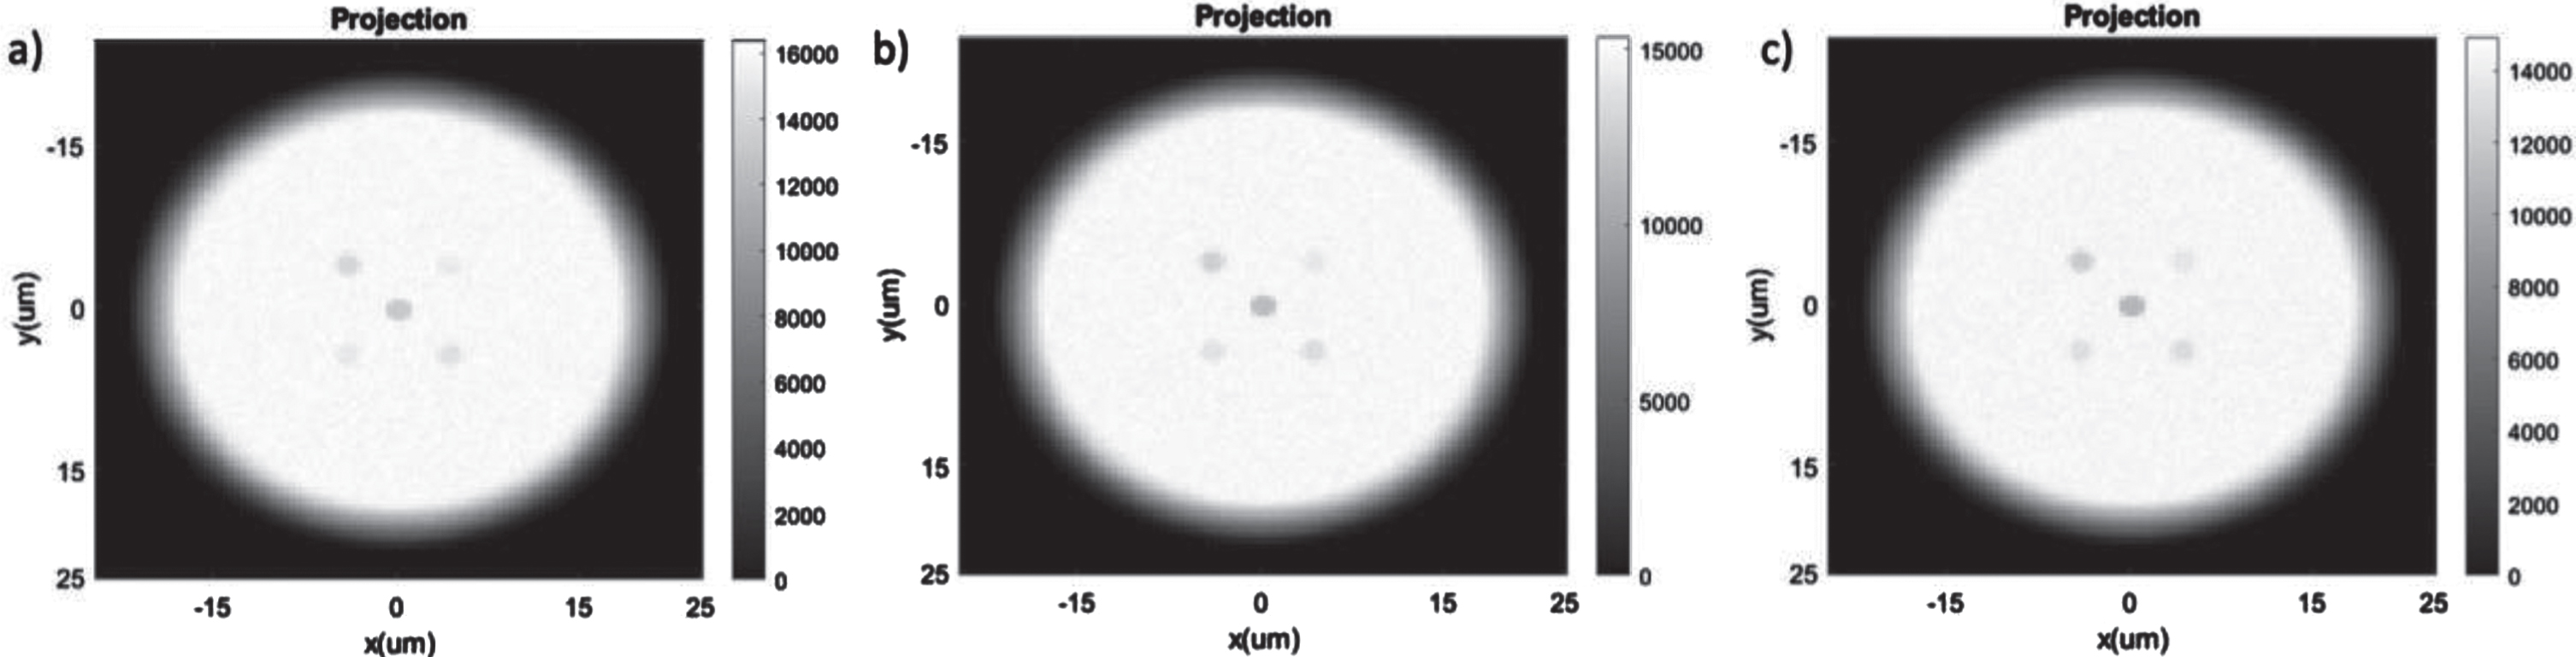
Attenuation based Projection of the metal oxide sample using (a) the full 40 kV spectra, (b) the 10 kV energy band spectra produced, and (c) the 5 kV energy band for the Cr target anode with 108 X-rays, 4-micron focal spot size.
The CNR values for each metal oxide examined in a 100 by 100 detector pixel reconstruction. 108 X-ray photons, 4 micrometers focal spot size, and 5 keV energy bandwidth. The source anode is indicated by the first column and each column after is the CNR of that oxide when each source was used.
The effects of the different bandwidth of X-ray spectra on contrast are shown in Fig. 5 where different energies of the same X-ray source were used to investigate whether this affected the CNR of the metal oxide particles. For the Chromium X-ray source, the low attenuation targets such as Aluminum and Silicon do not have good contrast when the full polychromatic spectra (40 keV) are used. When the energy spectra are truncated from 0 to 10 keV, these two low contrast targets appear more clearly. We have also observed that the contrast becomes best when a 5 keV spectra from 2.5 keV to 7.5 keV is used. We have calculated all the CNR for 4 types of X-ray tubes presented in Table 1. Furthermore, the CNR for the three types of energy spectra for Chromium, our most consistent spectra, are listed in Table 2. Meanwhile, in Table 1 the CNR for each target is not the same value among most of the source anodes which will allow for target differentiation if the target lies within the CNR range of an expected metal oxide for the given source anode used. These results indicate that all three cases can detect particles although narrower bandwidth of spectra resulted in better CNR as we expected.
The CNR values of the five metal oxides when the energy of the Cr source spectra
It was found that each spectrum led to different projections with some particles showing more distinctly in the projection images with one target anode versus another. To verify that these metal oxide particles can be differentiated from each other with the four different X-ray spectra, in Fig. 6, we plot the CNRs of the 5 metal oxide particles of interest with 5 kV truncated spectra for each target anode with a detector pixel size of 0.25 micrometers and an X-ray photon number of 108. From the CNR plots, we see that these CNR trends are different, and it is possible to differentiate each metal oxide particle based on the CNR trends. We will work on machine learning based automatic detection algorithms in the future for this task.
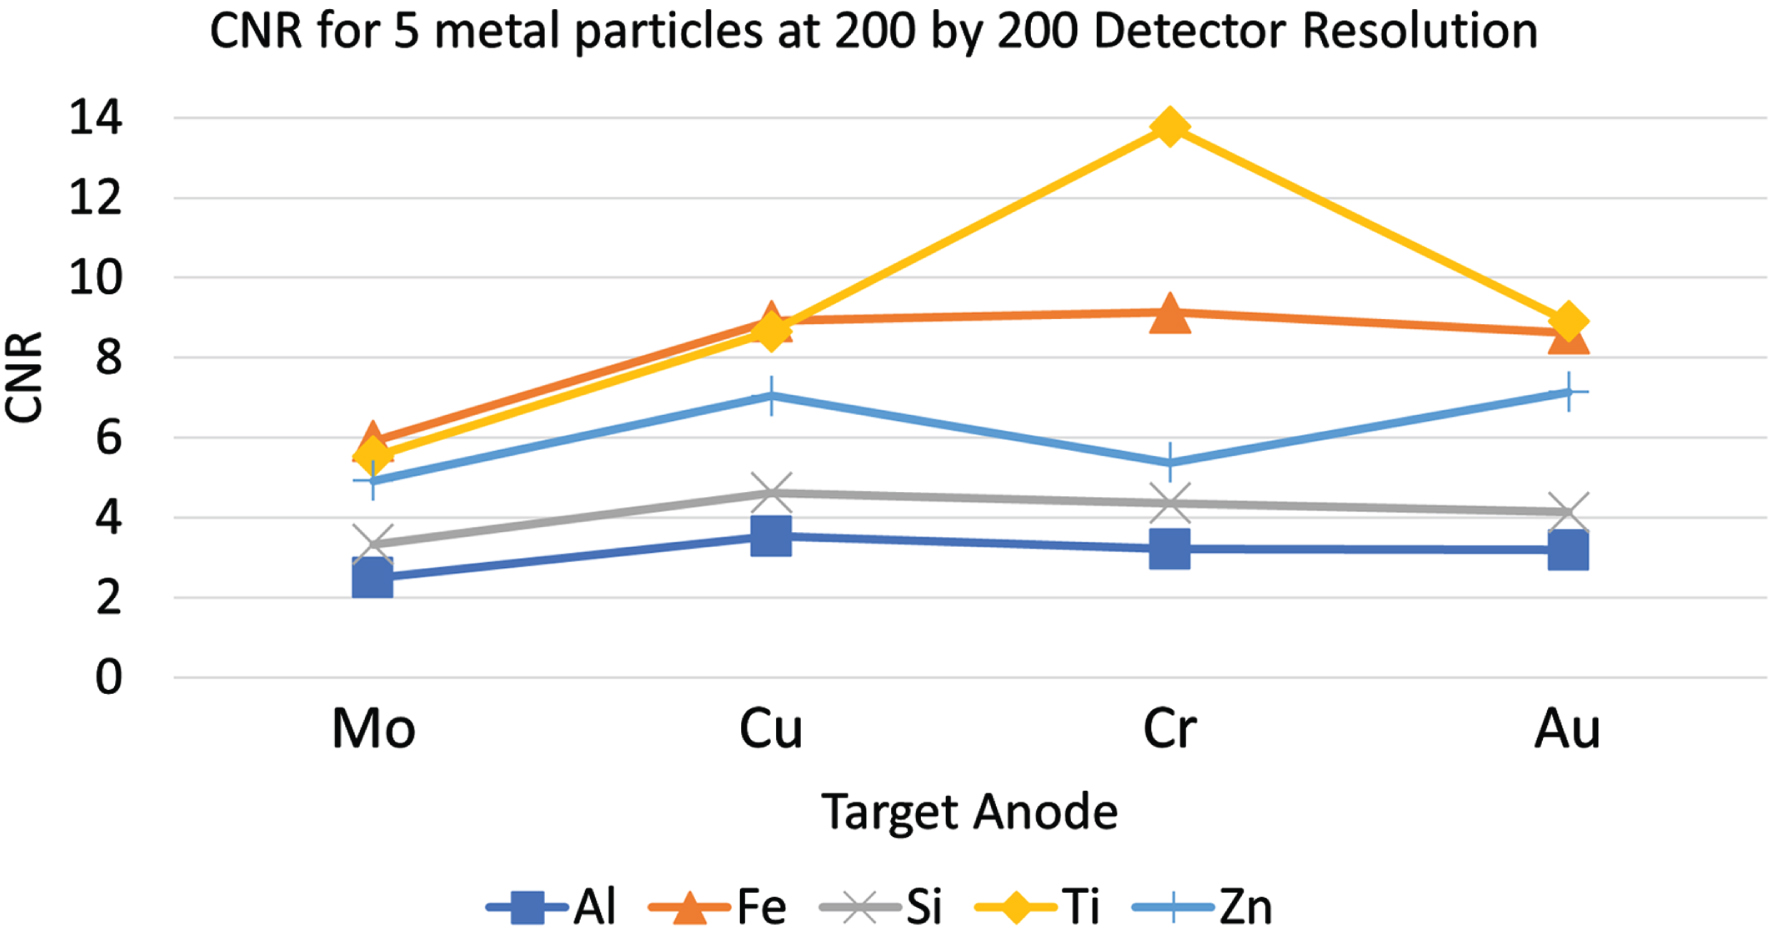
CNR trendlines of five metal dioxide particles with four different anode metal/spectra.
In this study, we examine the detection limits of particle size for the proposed X-ray imaging system by simulating the imaging of a sample as plotted in Fig. 3(left). The imaging system parameters are the 5 keV energy spectra for the Cr X-ray anode, the focal spot size of 4μm, the detector pixel number of 100 by 100, and the detector pixel size of 0.5μm. The simulation results are depicted in Fig. 7 for four different X-ray photon numbers: 109 (7a), 108 (7b), 107 (7c) and 106 (7d), which are independent of the x-ray energy when simulated with GATE. The photon number can be modified in GATE and corresponds to a change in the flux of the X-rays, but this does not require a change in the X-ray energy before the simulation can begin. We observed that the smaller samples would only appear if more X-ray photons were utilized as expected. Furthermore, the 0.5 micrometer diameter targets are detectable when using 109 and 108 X-rays as shown in Fig. 7a and 7b.
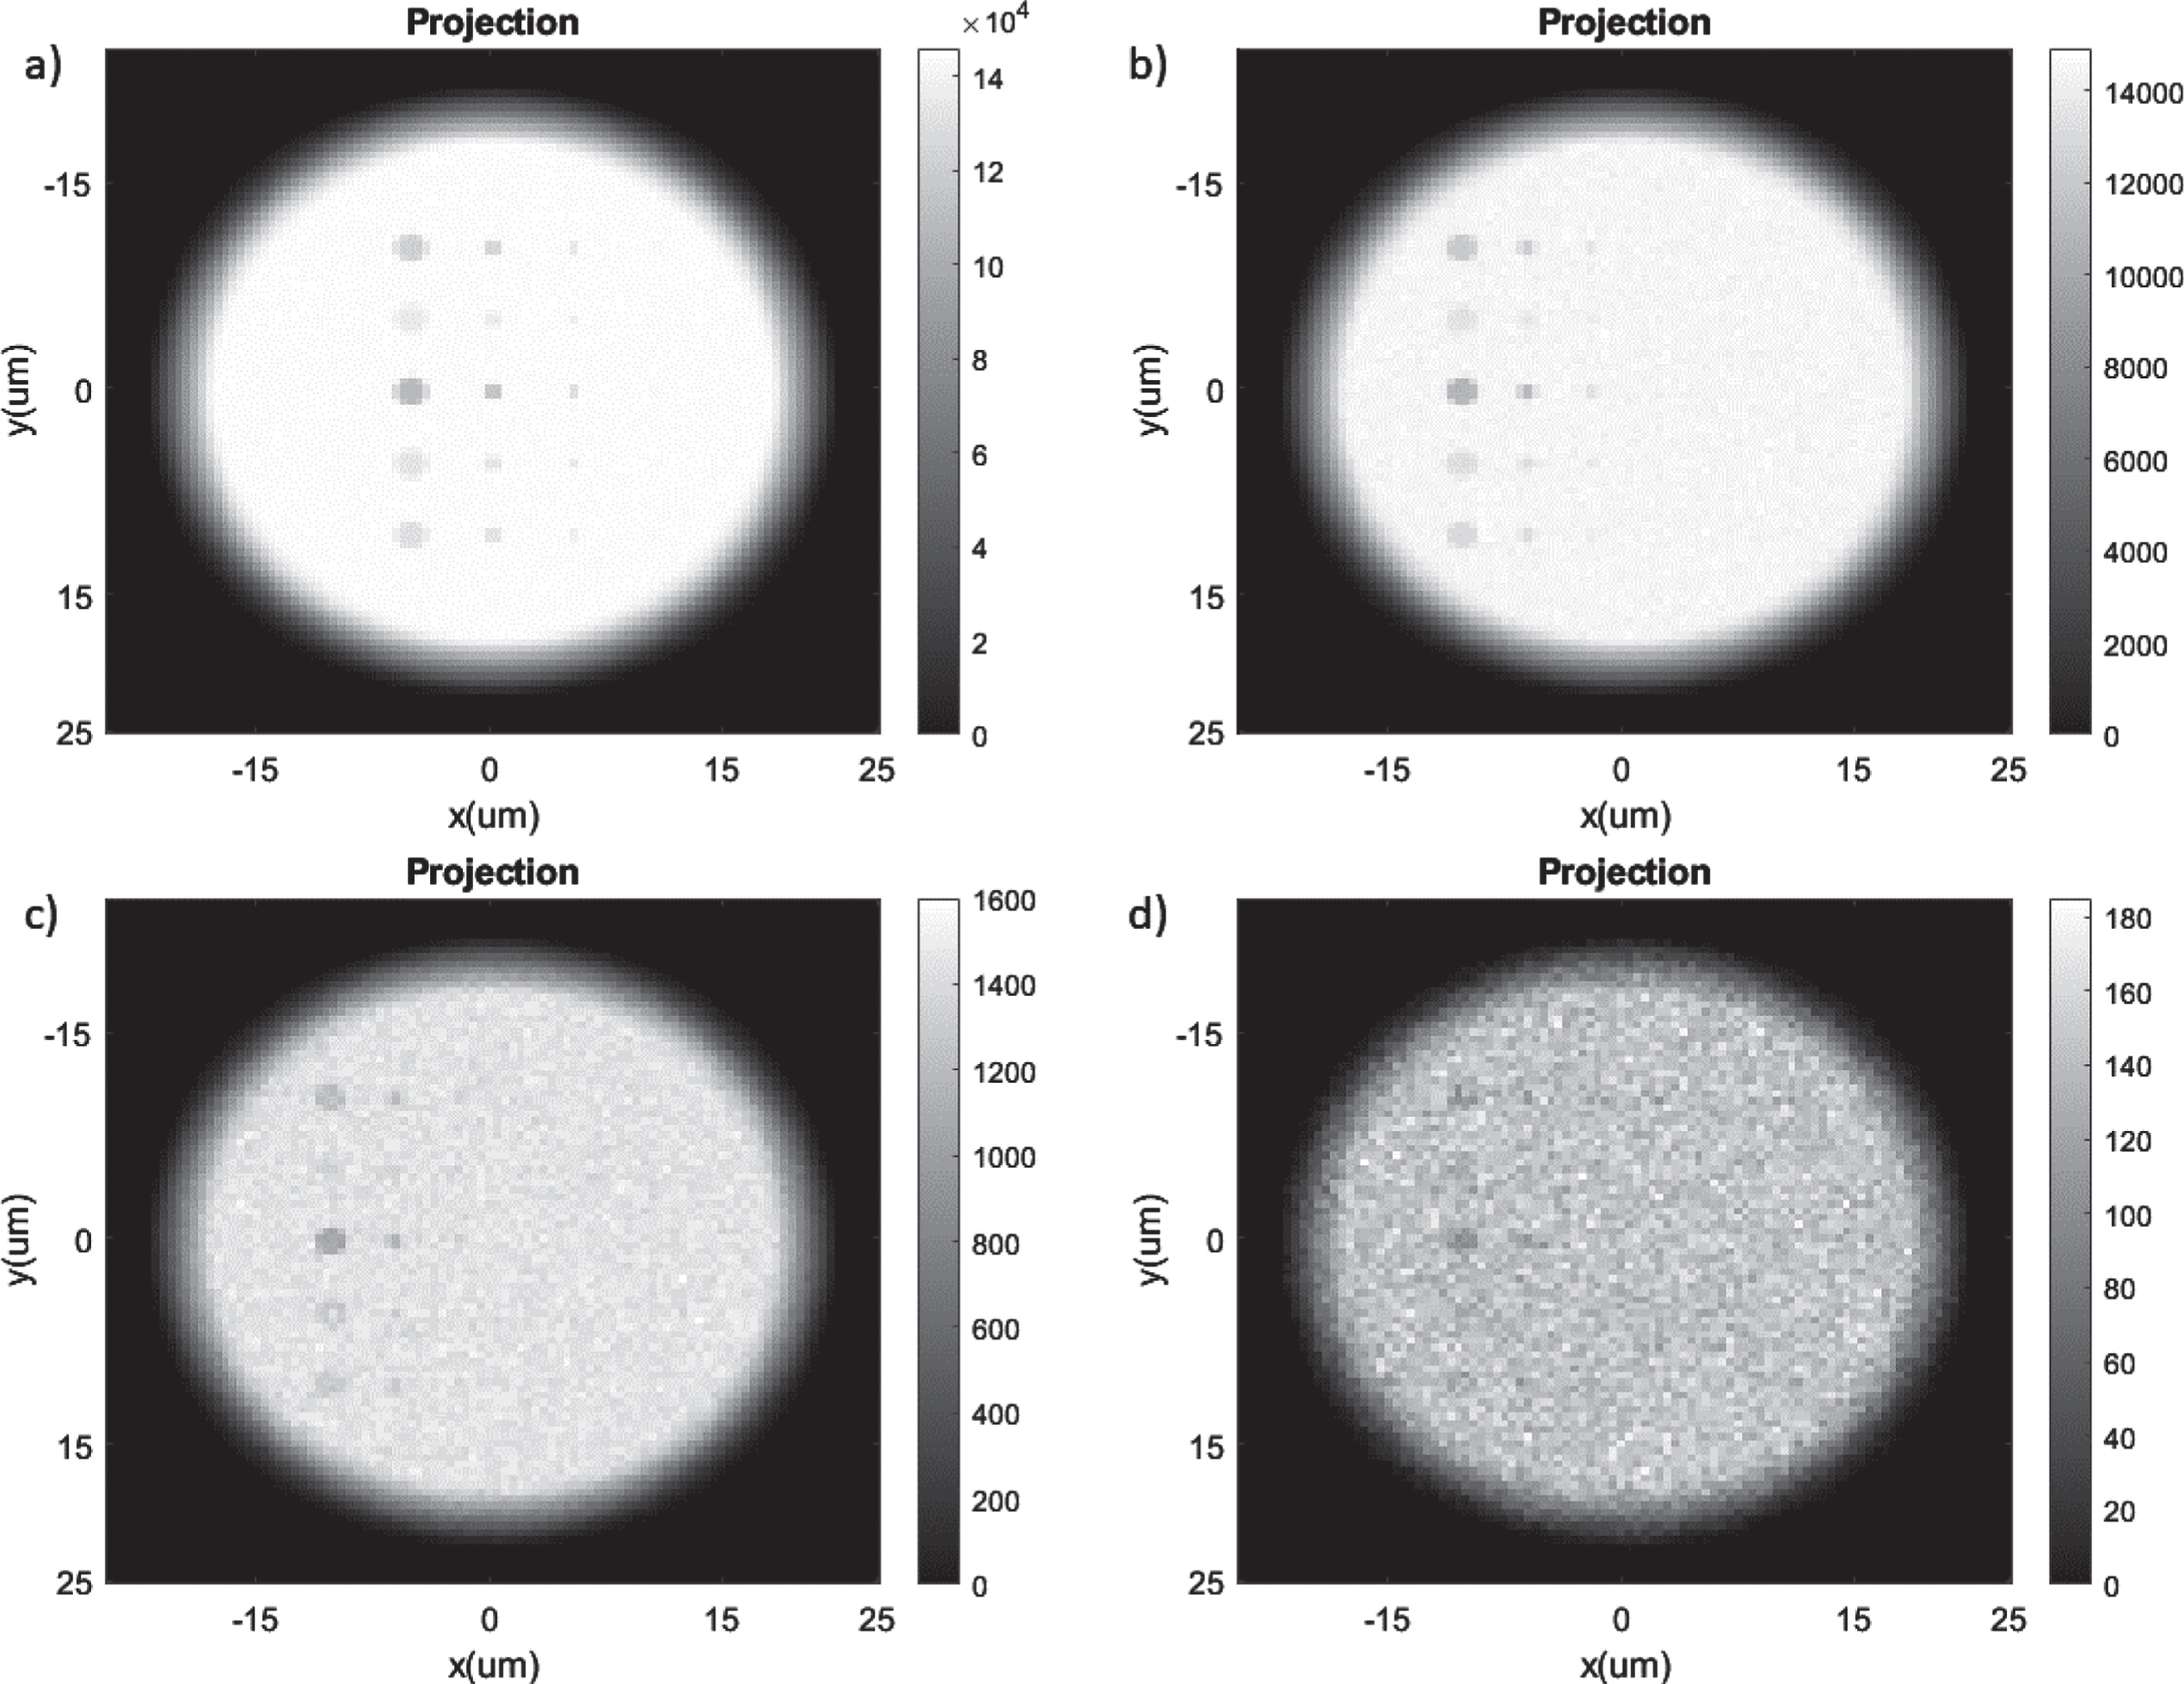
Simulated images of the sample of different particle sizes with different X-ray photon number: (a) 109; (b) 108; (c) 107; and (d) 106.
The performance of the various denoising algorithms can be easily seen in Figure 9, which shows the boxplots obtained from the CNR values calculated from the images obtained after performing various denoising algorithms. From the boxplots, it can be clearly seen that BM3D provides the highest increase in the CNR values compared to the original noisy images. However, its CNR values also have the highest variance, and there are significant overlaps in the boxplots of Ti, Fe, Al, Si, and Zn for all doses. For 108 and 109 photon numbers, even the original noisy images have significant CNR separation, while BM3D denoised images do not provide that separation even if it increases the CNR values greatly. Thus, BM3D is practically infeasible for material identification using quantitative analysis. Noise2Sim, on the other hand, does not provide a significant increase in the CNR values, but it can provide the CNR separation by decreasing the variance, which is essential for material identification—even for a low dose of 107 photons. Thus, Noise2Sim is the most suitable algorithm for our purpose.
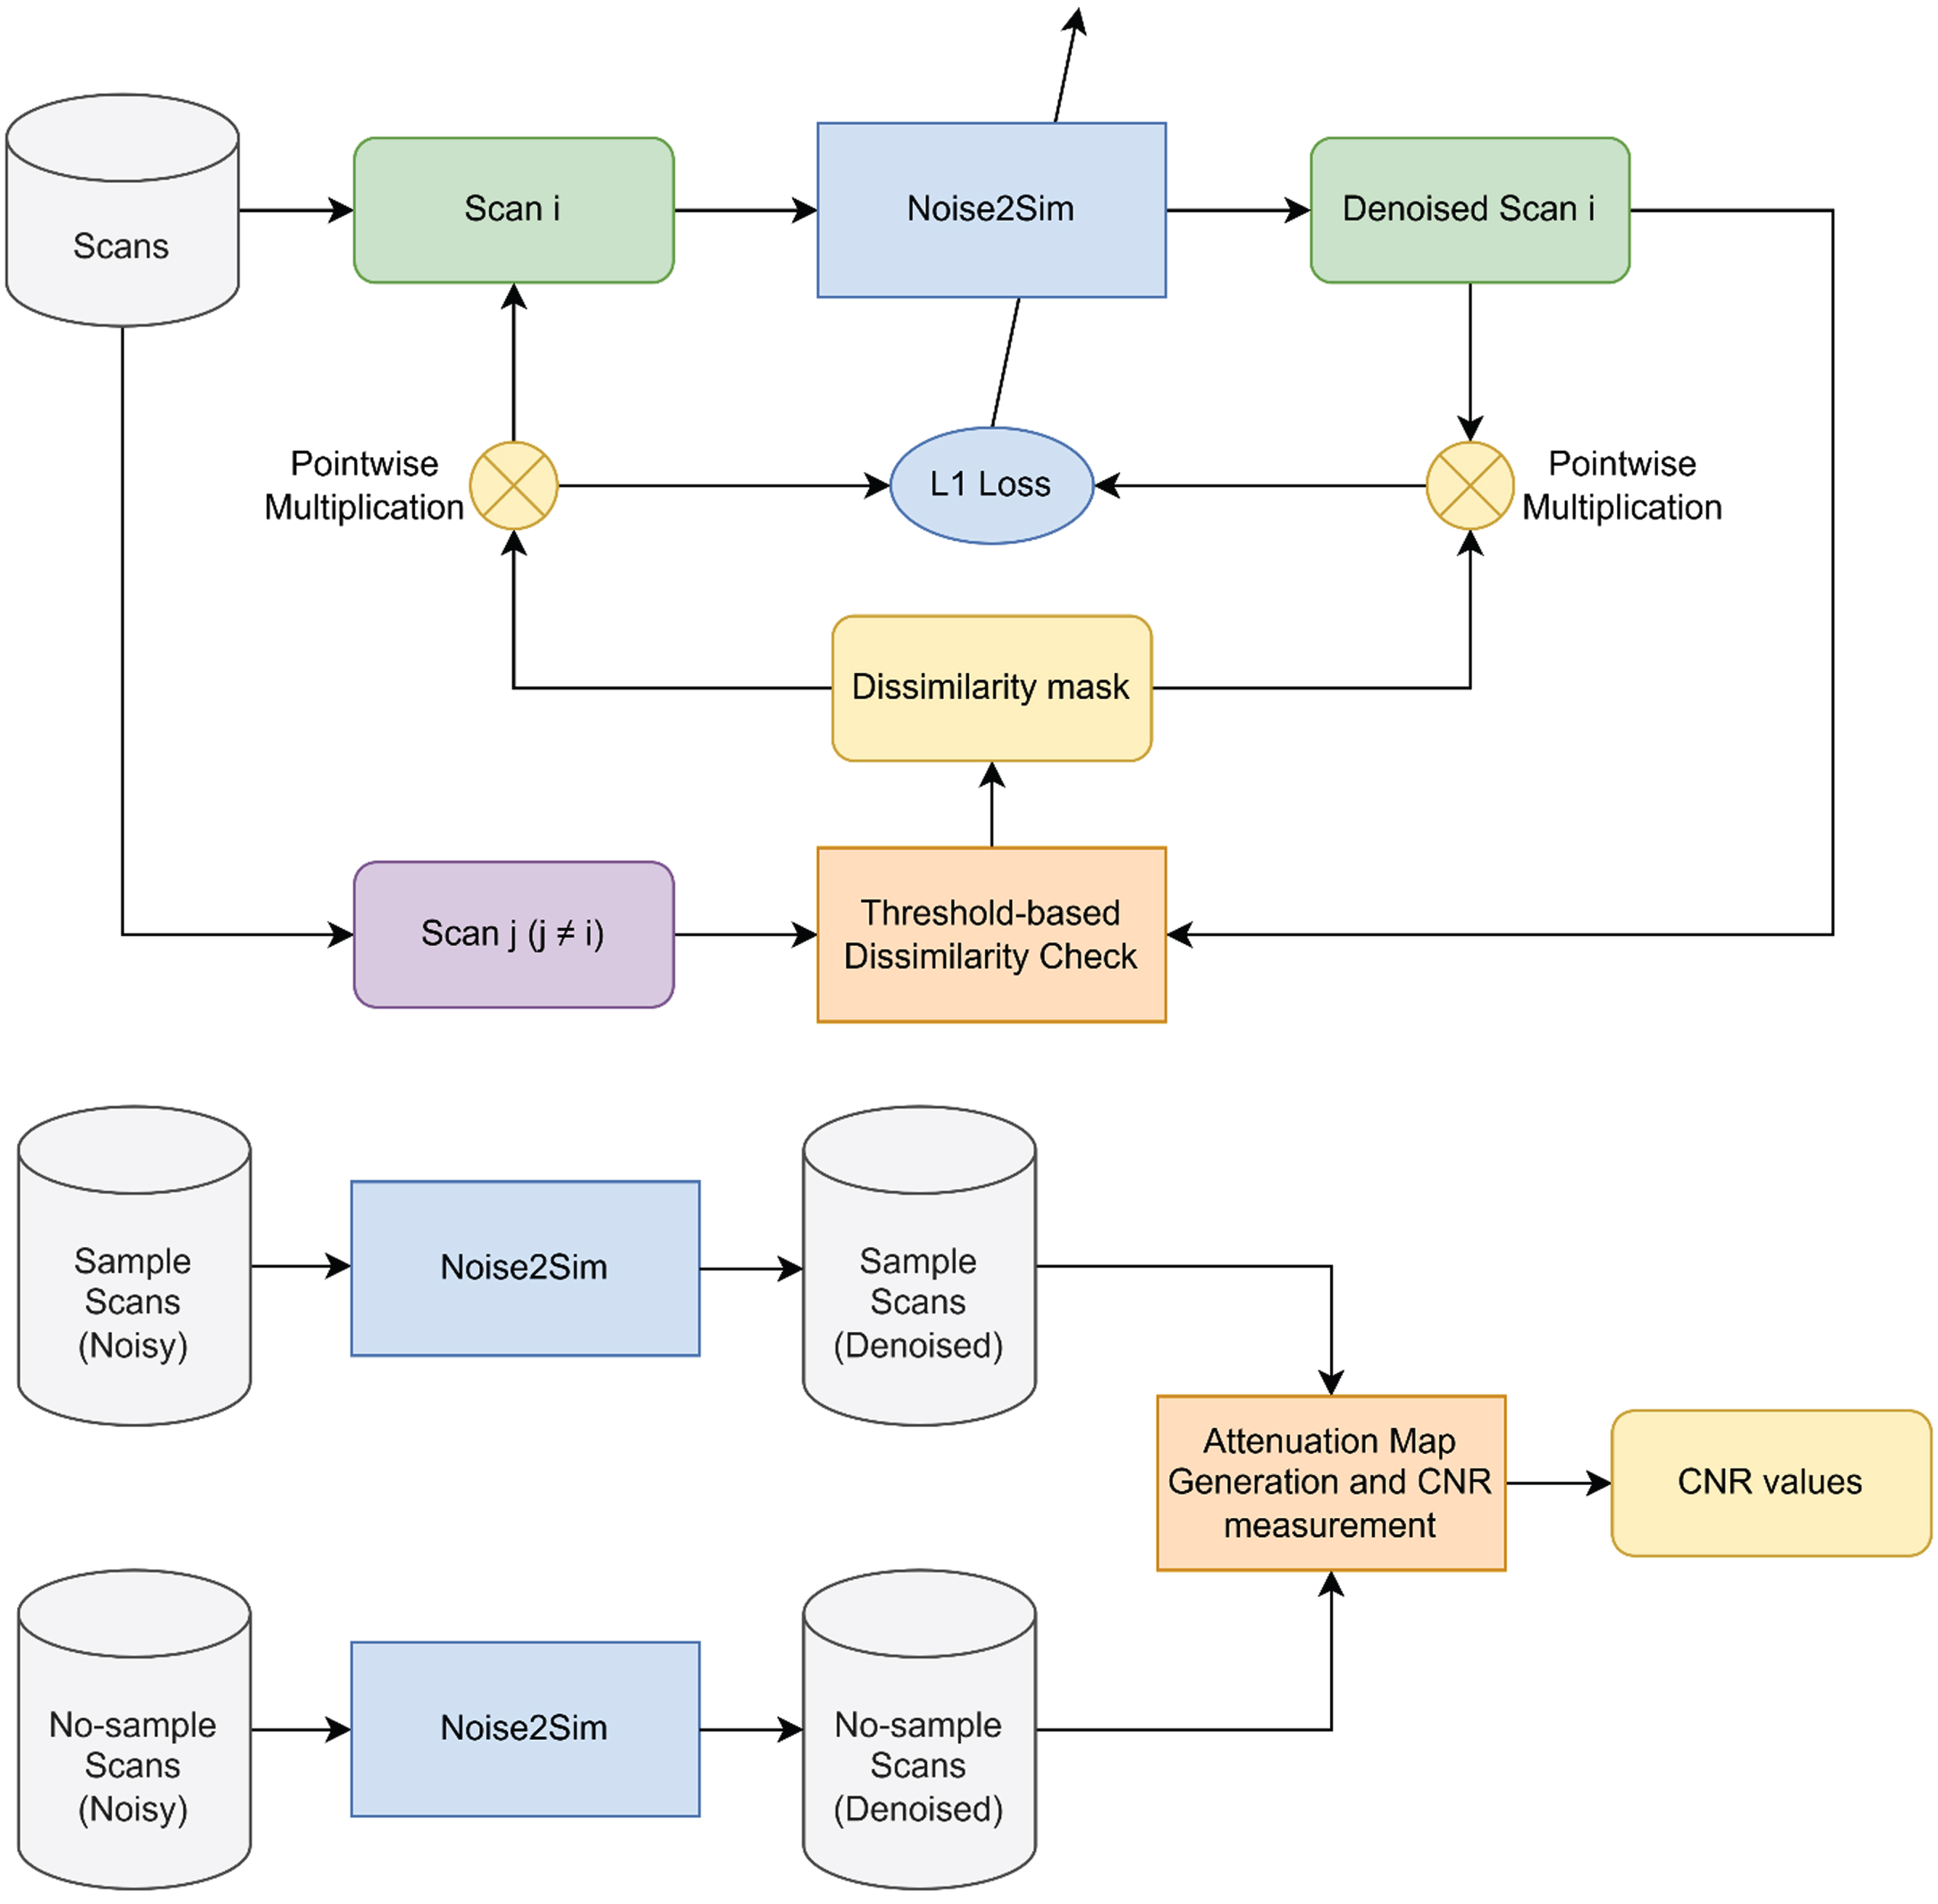
Information pipeline when using Noise2Sim for denoising X-ray projections.
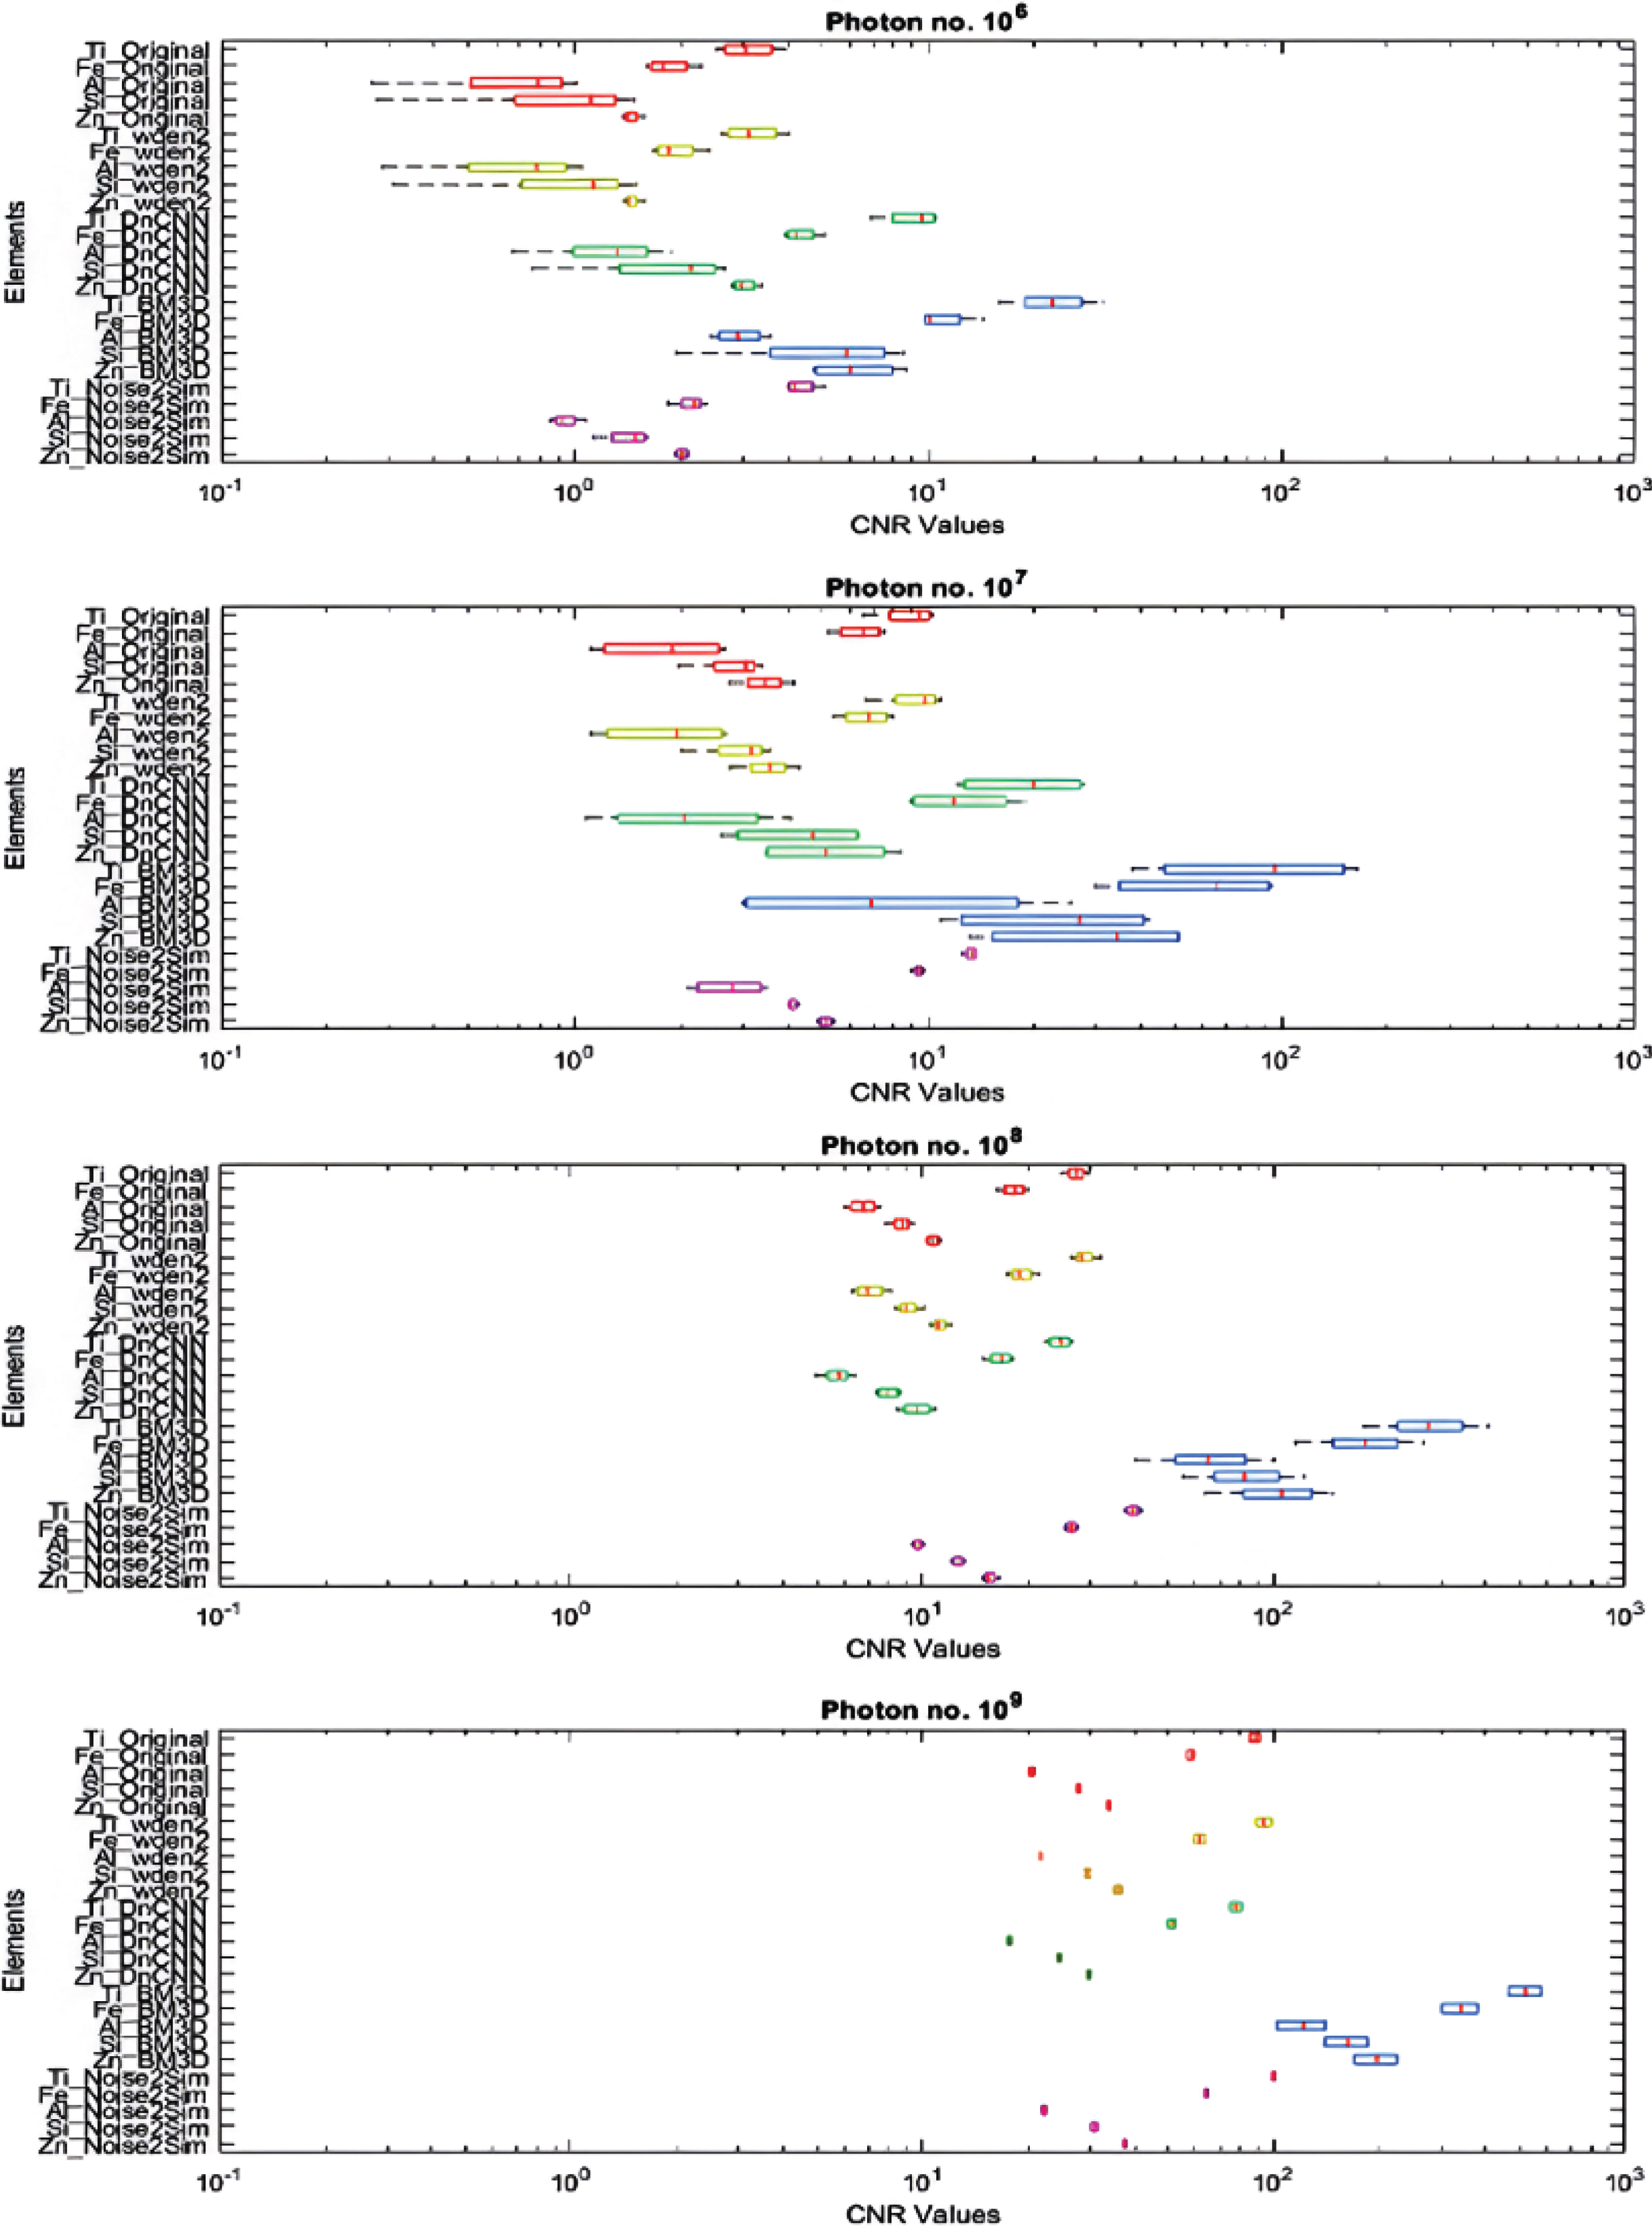
Boxplot obtained from the CNR values calculated after performing various denoising algorithms (red—original projection, yellow—2D wavelet denoising, green—DnCNN, blue—BM3D, magenta—Noise2Sim). From the boxplots, it shows that the Noise2Sim method can provide sufficient separation even with a low dose of 107 photons.
Here, the mean and standard deviations of the CNR values after denoising using the Noise2Sim method can be seen in Table 3 for the case with 4 micrometers focal spot size and 5 keV energy bandwidth of Cr source. Comparing with Table 1, we can clearly see that the means of the CNR values have increased while the standard deviations of the CNR values have decreased for all photon numbers. We can see the effect of denoising on the projections in Fig. 10, where we can qualitatively see significant improvements in the noise condition even for low doses.
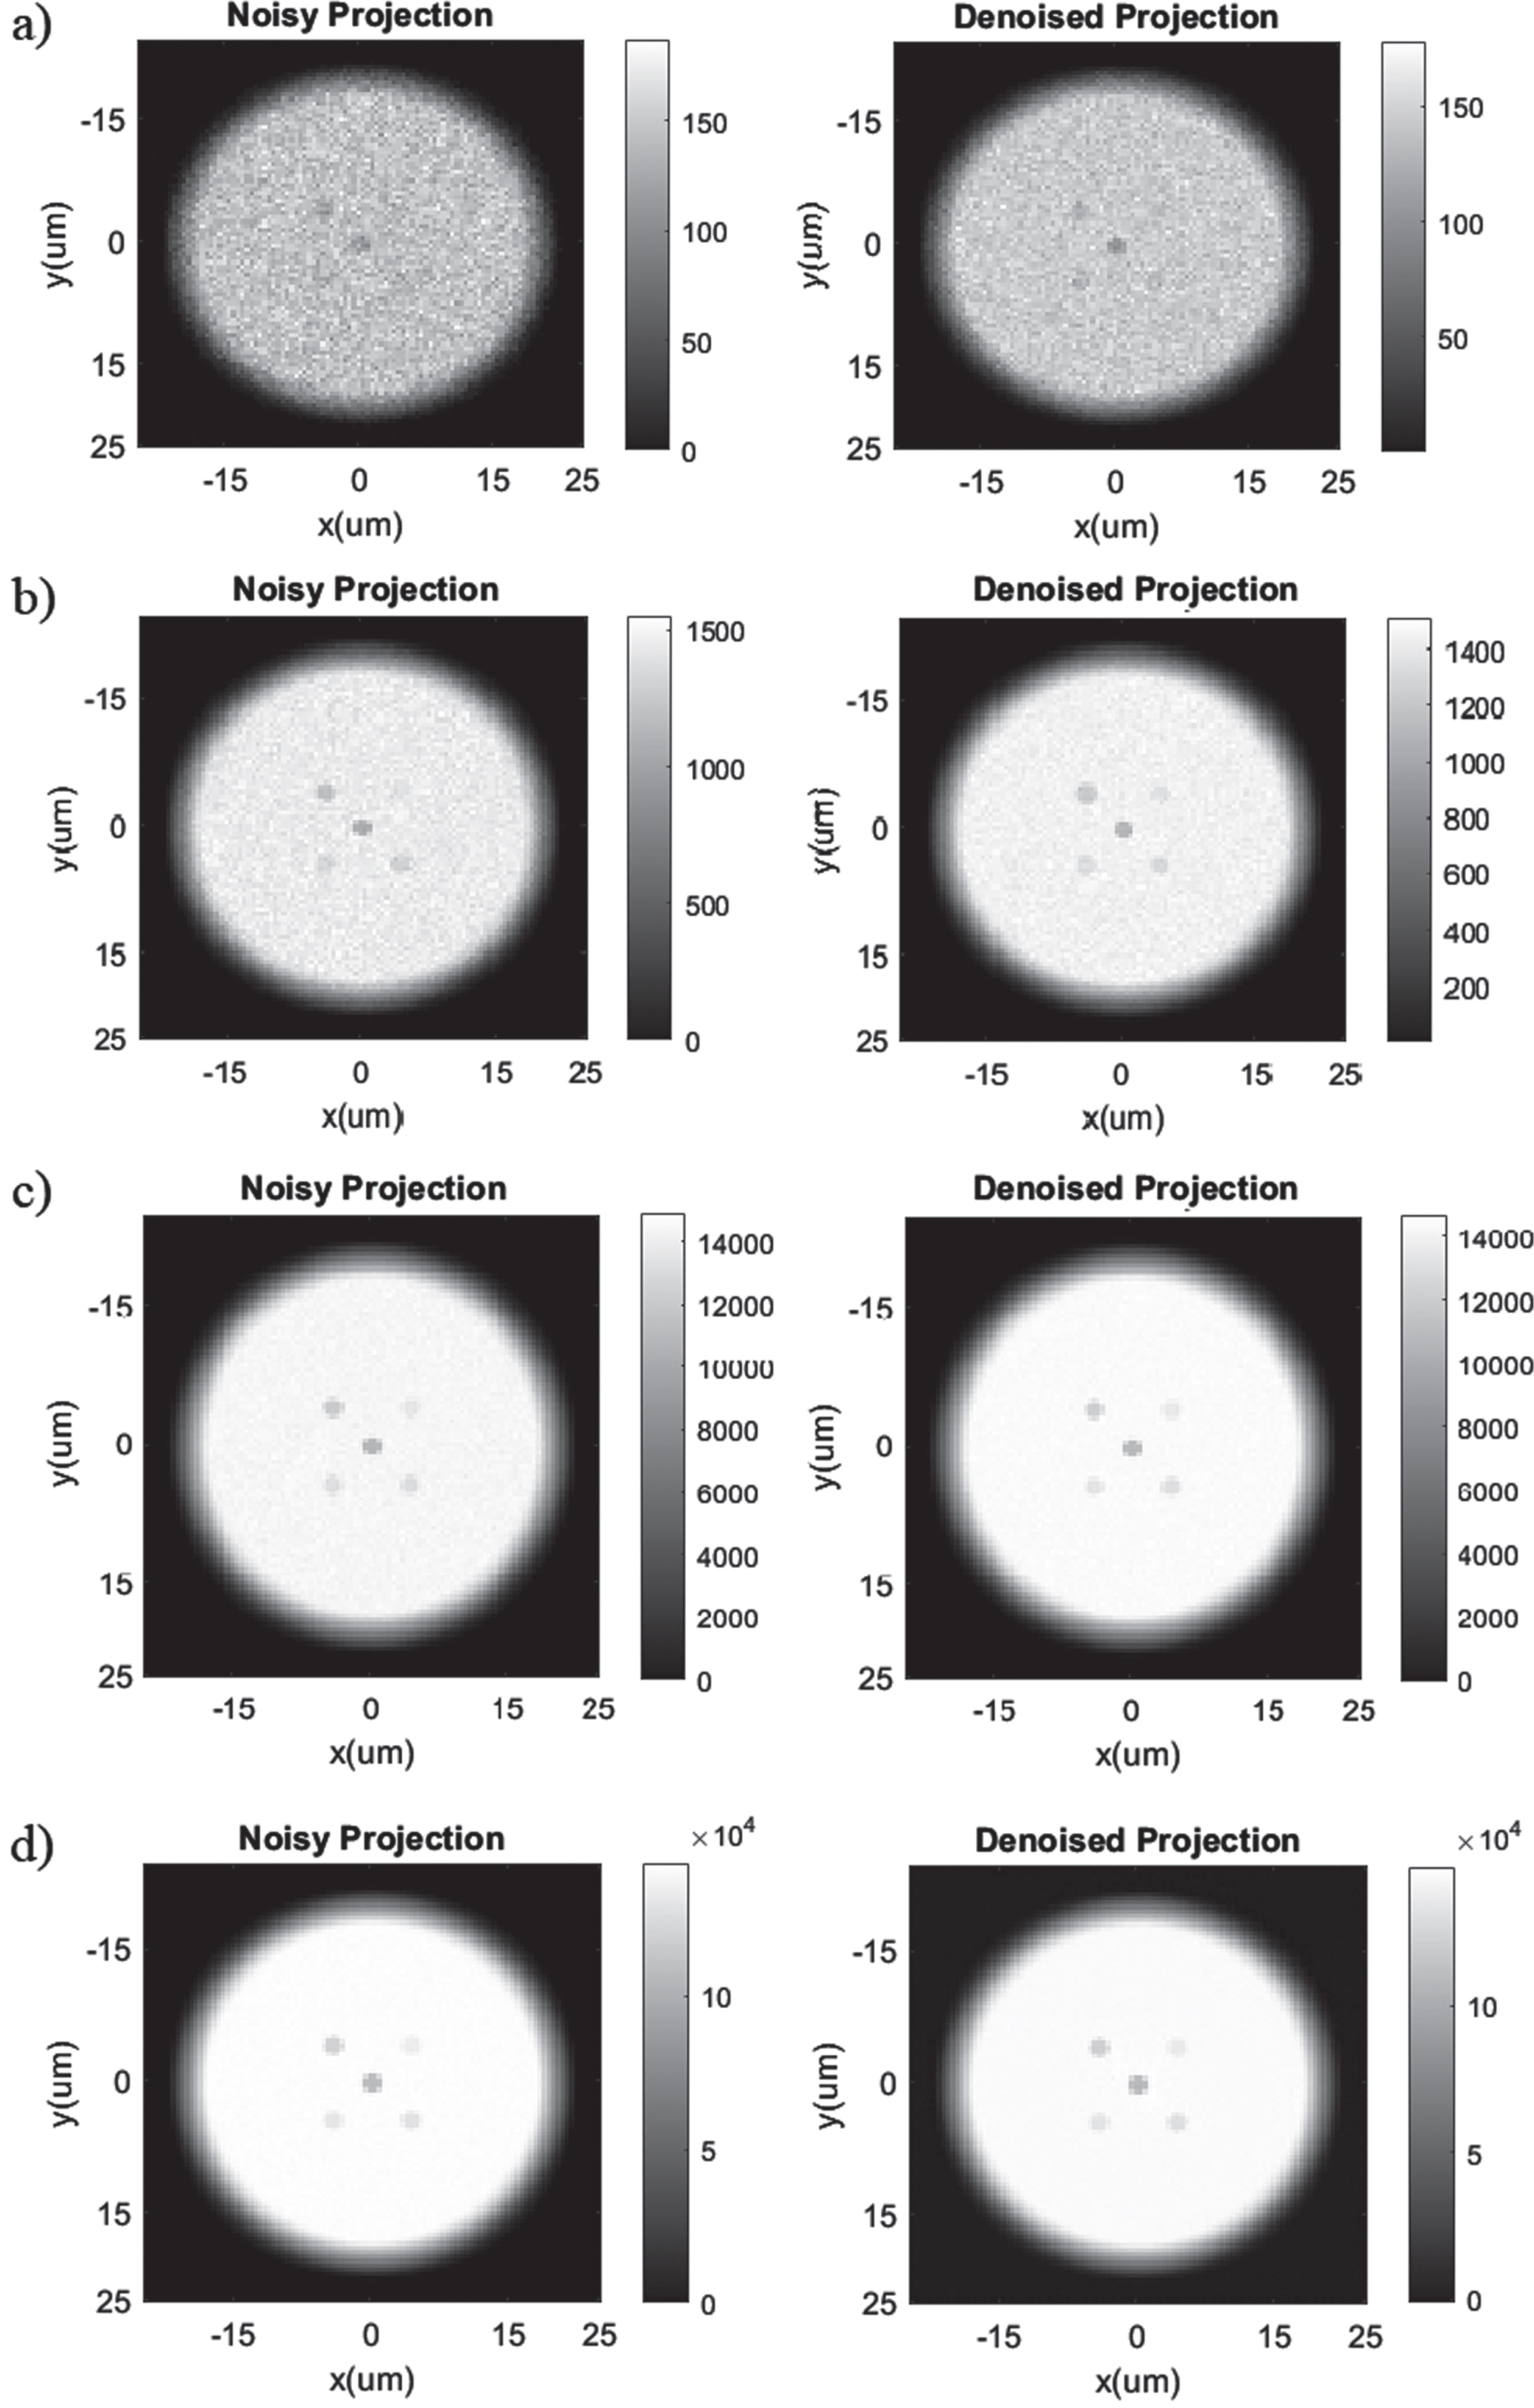
Attenuation based projection (not normalized) of the metal oxide sample using a 5 kV energy band spectra produced by the Cr target anode from the Sigray Source using (a) 106, (b) 107, (c) 108, and (d) 109 X-Rays before (left) and after (right) running through the Noise2Sim denoising algorithm.
Metal oxide calculated CNR for different X-ray photon counts after processing with Noise2Sim denoising algorithm, 4 micrometers focal spot size, and 5 keV energy bandwidth of Cr source
We have summarized our major results in the above section. Our results indicate that it is feasible to detect metal dioxide particles as small as 0.5 micrometers and it is possible to differentiate these particles from each other by using four different X-ray spectra with the simulated attenuation-based X-ray imaging system. This makes it a unique system compared to many others because it is portable on a benchtop. Compared with other systems, this imaging system is affordable. Thus, we expect that the proposed imaging system can be used in most dental offices and labs. Meanwhile, the multiple energy X-ray imaging system shares the same optical paths and the field of view with the fluorescence optical microscope, which makes it possible to study the correlations between the inflammation (detected by fluorescence optical imaging) and the location, types of the metal oxide particles. Furthermore, our simulations reveal the feasibility of an attenuation-based X-ray imaging system which uses a low-energy X-ray beam that can detect as well as be used to differentiate metal oxides from gingival samples. This would assist clinicians who would otherwise have to rely on identifying lesions in a gingival sample to diagnose their patients affected by FBG.
We have changed the focal spot size of the X-ray beam. The focal spot size was decreased from 4 micrometers by a factor of two a total of five times until it became 0.25 micrometers. This was also consistent with the expected results as the final projection became sharper, while the CNR experienced little change between different sizes. When observing the effects of a larger pixel size, starting at 0.25 micrometers then increasing until pixels were 2 micrometers, the simulations did not reveal any significant results. We have performed an additional round of simulations comparing the contrast of a monochromatic source with that of the 5 kV energy band spectra, referred to as semi-monochromatic, and the full 40 kV polychromatic spectra of Sigray’s Chromium anode. As expected, we found that the monochromatic results are slightly better with the other two cases having comparable results. We have also tested different substrates such as glass. As expected, the polystyrene substrate resulted in better CNRs due to its lower X-ray attenuations.
From all these numerical simulations, we have seen that these X-ray attenuation-based images of the five different metal oxide particles inside gingival tissues are affected by many factors and our simulated results could guide the future imaging system design by analyzing the CNR changes due to the changes of these parameters. Due to the nature of X-ray attenuation, the metal oxide particles with lower densities such as the silicon dioxide and aluminum (III) oxide do not have good contrast against the gingival tissue and the plastic plate background. Thus, it is critical for us to select narrow spectra bandwidth to enhance the CNR. As demonstrated by Fig. 5 and Table 2, we see that the CNR is best when we use the 5 keV spectra bandwidth for the X-ray metal anode of Cr. And it is possible to have 5 keV spectra by using X-ray optics and filters.
While both DnCNN and BM3D are very effective in qualitatively removing the noise and enhancing the signal-to-noise ratio for general images, in our case they not only perform over-smoothing on the data—thus increasing the mean CNR, but they also damage the quantitative information inside the X-ray projections, as can be seen from the boxplots in Fig. 9.
Our final algorithm, Noise2Sim by Niu et al [16], was selected mainly to overcome these issues. Noise2Sim has already been tested on X-ray-based CT and photon-counting CT scan images, and it is already shown that this method can preserve the image characteristics while carrying out the denoising process. Noise2Sim is extremely compatible with our experiment since the experiment provides the requirements of the algorithm: multiple images with similar noise characteristics. The primary advantage of the Noise2Sim model in our case is the fact that it is a self-supervised model that only requires images with similar noise characteristics and no ground truth images for training. Being a self-supervised model, it needs far fewer samples compared to supervised models such as DnCNN. Thus, our dataset of 4 sample images and 3 no-sample images per photon number with no reference ground truth is suitable for the model.
When we plot all the CNRs of five different metal oxides at different X-ray anodes (thus different X-ray spectra), we can see the significant differences of the changes in the CNR trends, from which we can differentiate five different metal oxide targets. It is worth noting that these CNR calculations already included the attenuating effects of gingival tissues and the plastic plate. Thus, the simulations are close to the physical experiments thanks to the interactions recorded in GATE. However, with GATE everything is ideal and there is no way for the X-rays to scatter back to the detector since their path in GATE is through a vacuum instead of a lead cabinet. Furthermore, simulations allow us to select a large X-ray photon number. In reality, this is related to the power of the source and the measurement time. Lastly, the designed imaging system is also not limited to these five metal oxides. Since the CNR is used to differentiate materials through exposure to multiple X-ray source spectra, any material that contrasts at low energy levels, in the keV range, could be differentiated from a thin tissue sample. Advanced automatic diagnosis methods will be applied for the automatic differentiation of metal oxide particles in the future study because it is beyond the scope of this paper.
In conclusion, we have proposed a multispectral X-ray tube and microscope-based X-ray imaging system. Our simulation results indicate that it is feasible to detect single metal oxide particles as small as 0.5 micrometers in diameter inside gingival tissue with a support plastic plate with our proposed imaging system. We have also found that it is possible to differentiate these particles by using four different X-ray anode metals. Our findings are encouraging and will guide us to build a prototype X-ray imaging system. We also plan to include an optical fluorescence imaging system sharing the same field of view to study the correlations between the existing metal oxide particles and gingival tissue inflammation.
Funding
This work was partially funded by the NIH National Institute of Biomedical Imaging and Bioengineering (NIBIB) [R01EB026646] and the National Institute of General Medical Sciences (NIGMS) [R42GM142394-01A1].
Footnotes
Acknowledgments
We would like to thank Sigray, Inc. for the spectral information of their Sigray X-ray source.
Disclosures
The authors declare no conflicts of interest.