
Abstract
OBJECTIVE:
A normal video Head Impulse Test is the gold standard in the emergency department to rule-in patients with an acute vestibular syndrome and a stroke. We aimed to compare the diagnostic accuracy of vHIT metrics regarding the vestibulo-ocular reflex gain and the corrective saccades in detecting vestibular strokes.
METHODS:
Prospective cross-sectional study (convenience sample) of patients presenting with acute vestibular syndrome in the emergency department of a tertiary referral centre between February 2015 and May 2020. We screened 1677 patients and enrolled 76 patients fulfilling the inclusion criteria of acute vestibular syndrome. All patients underwent video head impulse test with automated and manual data analysis. A delayed MRI served as a gold standard for vestibular stroke confirmation.
RESULTS:
Out of 76 patients, 52 were diagnosed with acute unilateral vestibulopathy and 24 with vestibular strokes. The overall accuracy of detecting stroke with an automated vestibulo-ocular reflex gain was 86.8%, compared to 77.6% for cumulative saccade amplitude and automatic saccade mean peak velocity measured by an expert and 71% for cumulative saccade amplitude and saccade mean peak velocity measured automatically. Gain misclassified 13.1% of the patients as false positive or false negative, manual cumulative saccade amplitude and saccade mean peak velocity 22.3%, and automated cumulative saccade amplitude and saccade mean peak velocity 28.9% respectively.
CONCLUSIONS:
We found a better accuracy of video head impulse test for the diagnosis of vestibular strokes when using the vestibulo-ocular reflex gain than using saccade metrics. Nevertheless, saccades provide an additional and important information for video head impulse test evaluation. The automated saccade detection algorithm is not yet perfect compared to expert analysis, but it may become a valuable tool for future non-expert video head impulse test evaluations.
Introduction
The video head impulse test (vHIT) is an invaluable objective tool for the detection of vestibular stroke (defined as an acute onset of vertigo, dizziness, or postural imbalance due to a stroke) in the bedside assessment of the acutely dizzy patients in the emergency department (ED) [25, 44]. In clinical practice, physicians often rely on the VOR gain to characterize the vHIT as normal or abnormal. This assessment, however, may be unreliable as other indicators of a deficient VOR including the presence of compensatory saccades, are not seriously considered. The clinician is often faced with ambiguous situations, such as vHITs with low gains and no saccades or vHITs with normal gains and numerous saccades.
Currently, stroke prediction with vHIT is based on a single parameter: gain. Previous studies measuring HITs with scleral search coils suggested a better stroke prediction using saccade metrics instead of gain values [9] but no data is currently available from bedside measurements using portable video goggles. Patients with a deficient vestibulo-ocular reflex (VOR) must correct their gaze after a brisk head movement (head impulse) in order to keep the target on the fovea. Such compensatory saccades may be visible to the examiner (overt) or invisible (covert) [6]. vHIT devices can track such saccades using high speed infrared cameras. The latest vHIT or video-oculography devices automatically analyse saccade metrics such as saccade latency and amplitude. Depending on the device’s algorithm, they also report VOR gains for each tested semicircular canal tested, calculated either at a single time point (e.g. 40 ms, 60 ms) using the ratio of eye- and head velocity as the ratio of the area under the curve after a ‘de-saccading’ procedure [61].
The vHIT has gradually gained acceptance for the evaluation of vestibular function [2], in particular for the assessment of the high frequency range of the vestibulo-ocular reflex (VOR). Its sensitivity in diagnosing central vertigo was proved even greater than that of magnetic resonance imaging with diffusion-weighted imaging (MRI-DWI) [56, 57], especially when performed within the first 48 hours after vertigo onset. As such vHIT is considered a primary diagnostic tool in the acute care setting [7, 44].
As with all new technologies, the implementation of vHIT in the ED involves a learning curve for its proper application [19, 24] and expertise for the interpretation of the recorded traces. The artifacts occurring during and after the head impulse can also have a negative impact in the evaluation of gain and saccades. Any improvement in the automated analysis of vHIT parameters is important for a future systematic and widespread use by non-specialists in the ED.
To our knowledge, the value of vHIT saccade metrics in detecting stroke was never investigated in patients presenting with an acute vestibular syndrome (AVS). In this cross-sectional prospective study, we compared the diagnostic accuracy of vHIT parameters such as VOR gain and saccade metrics in differentiating central from peripheral acute vertigo. In addition, we studied the concordance between manual and automated saccade analysis provided by the device algorithm.
Materials and methods
This study prospectively analyses (convenience sample) all patients with AVS who visited between February 2015 and May 2020 the emergency room of our tertiary referral center. 1677 patients were screened for AVS as part of a large cross-sectional study (DETECT—[Dizziness Evaluation Tool for Emergent Clinical Triage]). We included and enrolled patients with AVS (continuous dizziness accompanied with nausea or vomiting, head-motion intolerance, new gait or balance disturbance). Exclusion criteria consisted of age younger than 18 years, duration of symptoms < 24 h or index ED visit > 72 h after symptom onset. A subset of data from the DETECT study including vHIT gain and vestibular tests of this patient cohort have been published elsewhere [24–26, 41]. We present here data from AVS patients who received a vHIT with an automated VOR gain and saccade analysis and compared with a posthoc manual saccade analysis performed by an expert.
All enrolled AVS patients underwent a physical examination conducted by an experienced neuro-otologist and were assessed for spontaneous nystagmus using either frenzel goggles or video-oculography. They also underwent a vHIT and received a DWI MRI either on an acute setting or a second, delayed MRI in case of non-diagnostic first MRI or if there was no clinical indication for acute MRI. All images were reviewed by a certified second blinded neuroradiologist. The DWI MRI served as the reference standard for stroke detection. Patients with a negative MRI and pathological caloric test were diagnosed with acute unilateral vestibulopathy. The final diagnosis was made by two neuro-otology specialists (GM, AK).
Neuro-otology experts performed vHIT uniquely on the horizontal semicircular canals conducting fast passive head movements (high frequency, 10–20° head excursion within 100–300 ms corresponding to a 1000–6000°/sec2 acceleration) in room light with patients fixated on a target placed at a distance >1 m. Head- and eye movement velocity were recorded using a head mounted infrared high-speed camera (EyeSeeCam, Munich) connected to a laptop by USB [52]. VOR gain values were calculated dividing eye velocity by head velocity at 60 ms after initiation of the vHIT.
All corrective saccades (covert and overt) were marked twice, once automatically using the built-in vHIT device algorithm and once manually by a single trained rater, who was blinded to imaging results. The quality criteria for the manually analyzed saccades were the following: bell-shaped curves occurring after the initiation of the head movement and completed at the latest by 700 ms, minimal peak saccade velocity amplitude of 40°/s and duration between 10–80 ms. A typical vHIT curve from a patient with acute unilateral vestibulopathy is depicted in Fig. 1. Positional data of vHITs were visually inspected and square wave jerks and micro saccades were not marked as saccades.
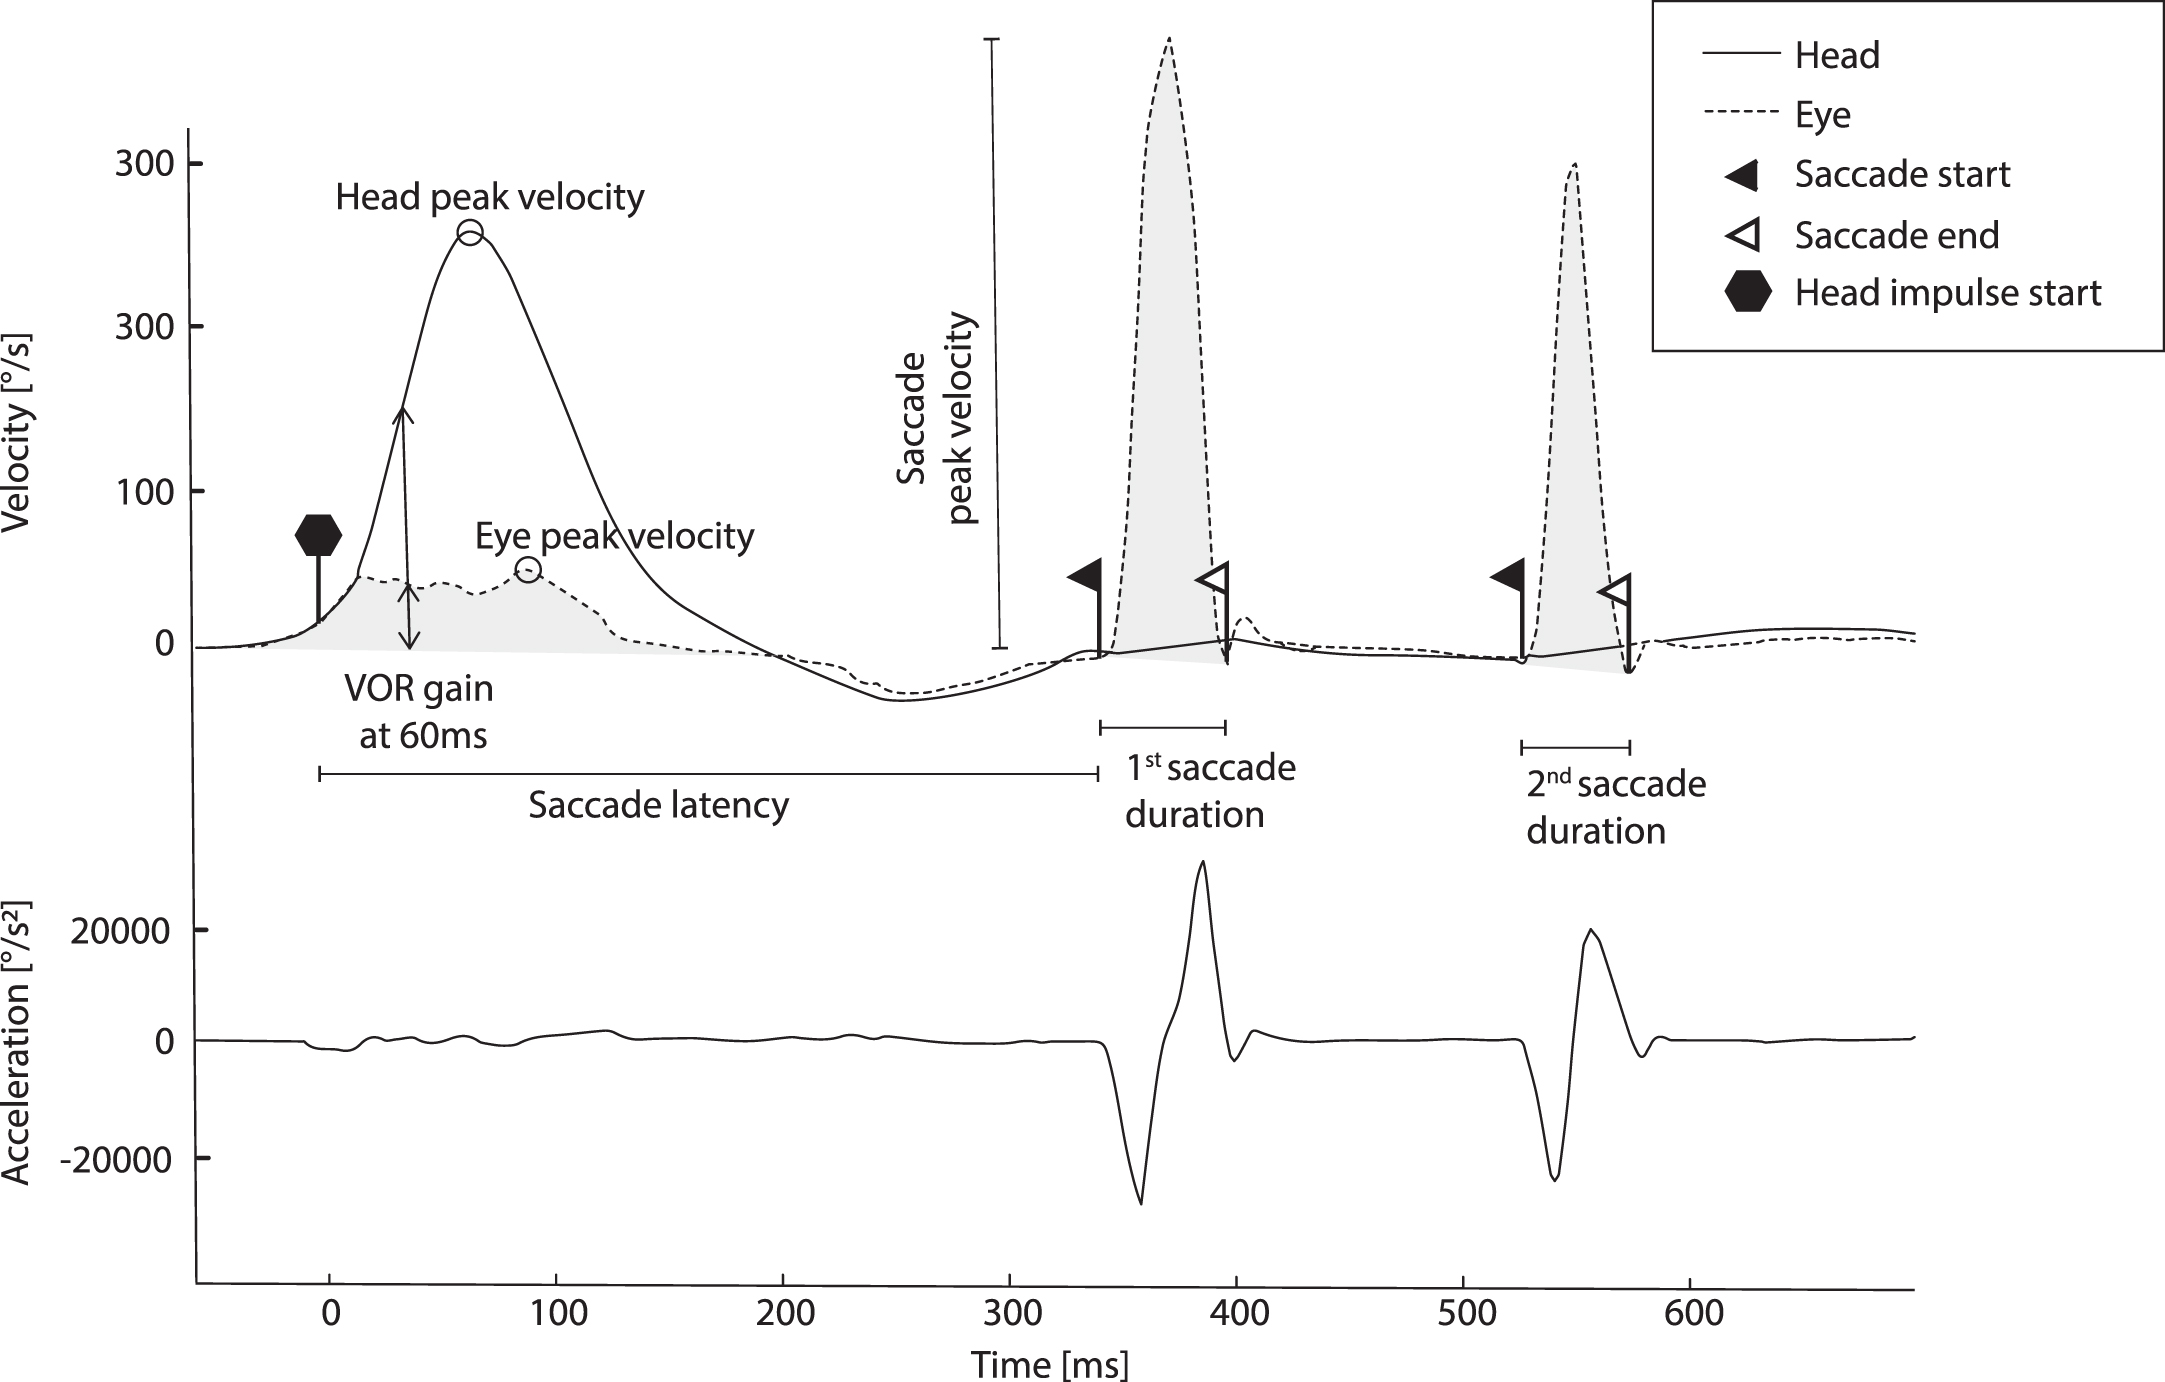
vHIT curve of a patient with acute unilateral vestibulopathy. Note the typical presence of overt saccades and low gain.
We excluded, ‘wrong-way’ saccades with negative velocity, probably representing nystagmus towards the VOR deficit or “anti-saccades” occurring after head overshooting, where the head is quickly turned back to the center line at the end of the HIT and “pseudo-saccades” with two or multiple peaks and trace oscillations due to blinking [37]. We calculated the cumulative saccade amplitude (cumulative saccade amplitude) and the saccade mean peak velocity (°/s) (saccade mean peak velocity) of the marked saccades for all vHIT towards the side with the lower VOR gain and we included the first six saccades within a time frame of 700 ms of each impulse. In addition, we collected information on age.
Descriptive statistics were reported using SPSS statistical software (IBM SPSS Statistics for Windows, Version 25.0. Armonk, NY: IBM Corp.). We calculated a receiver characteristics curve [48] with its corresponding sensitivity, specificity, accuracy, and negative likelihood ratio. Best cut-off points of amplitude, velocity and gain were estimated based on Youden’s J. We followed the STARD guidelines for reporting the diagnostic accuracy. The three ROC curves were statistically compared with R Microsoft open 4.0.2, pROC package using the Bootstrap method.
Results
We screened 1677 patients with AVS of which 76 patients were enrolled aged between 20 and 88 (mean 55.7 years±SD 15.5 years). Of the 76 patients, 52 were diagnosed with acute unilateral vestibulopathy using either the first or delayed DWI MRI as the reference standard for stroke detection (mean age 54.3 years±12.7 years), while the remaining 24 patients were vestibular strokes, (mean age 60.7 years±15.2 years). Of the 24 patients with stroke, 12 had infarction of the posterior inferior cerebellar artery (PICA), 1 of the anterior inferior cerebellar artery (AICA), 1 of the superior cerebellar artery (SCA), 3 of the basilar artery (BA), 2 of the middle cerebral artery (MCA), 3 of PICA and SCA, 1 of PICA and AICA, and 1 was diagnosed with vestibular migraine and infarction of the MCA.
Figure 2 shows a flow diagram with all screened patients, included and excluded subjects according to the predefined criteria.
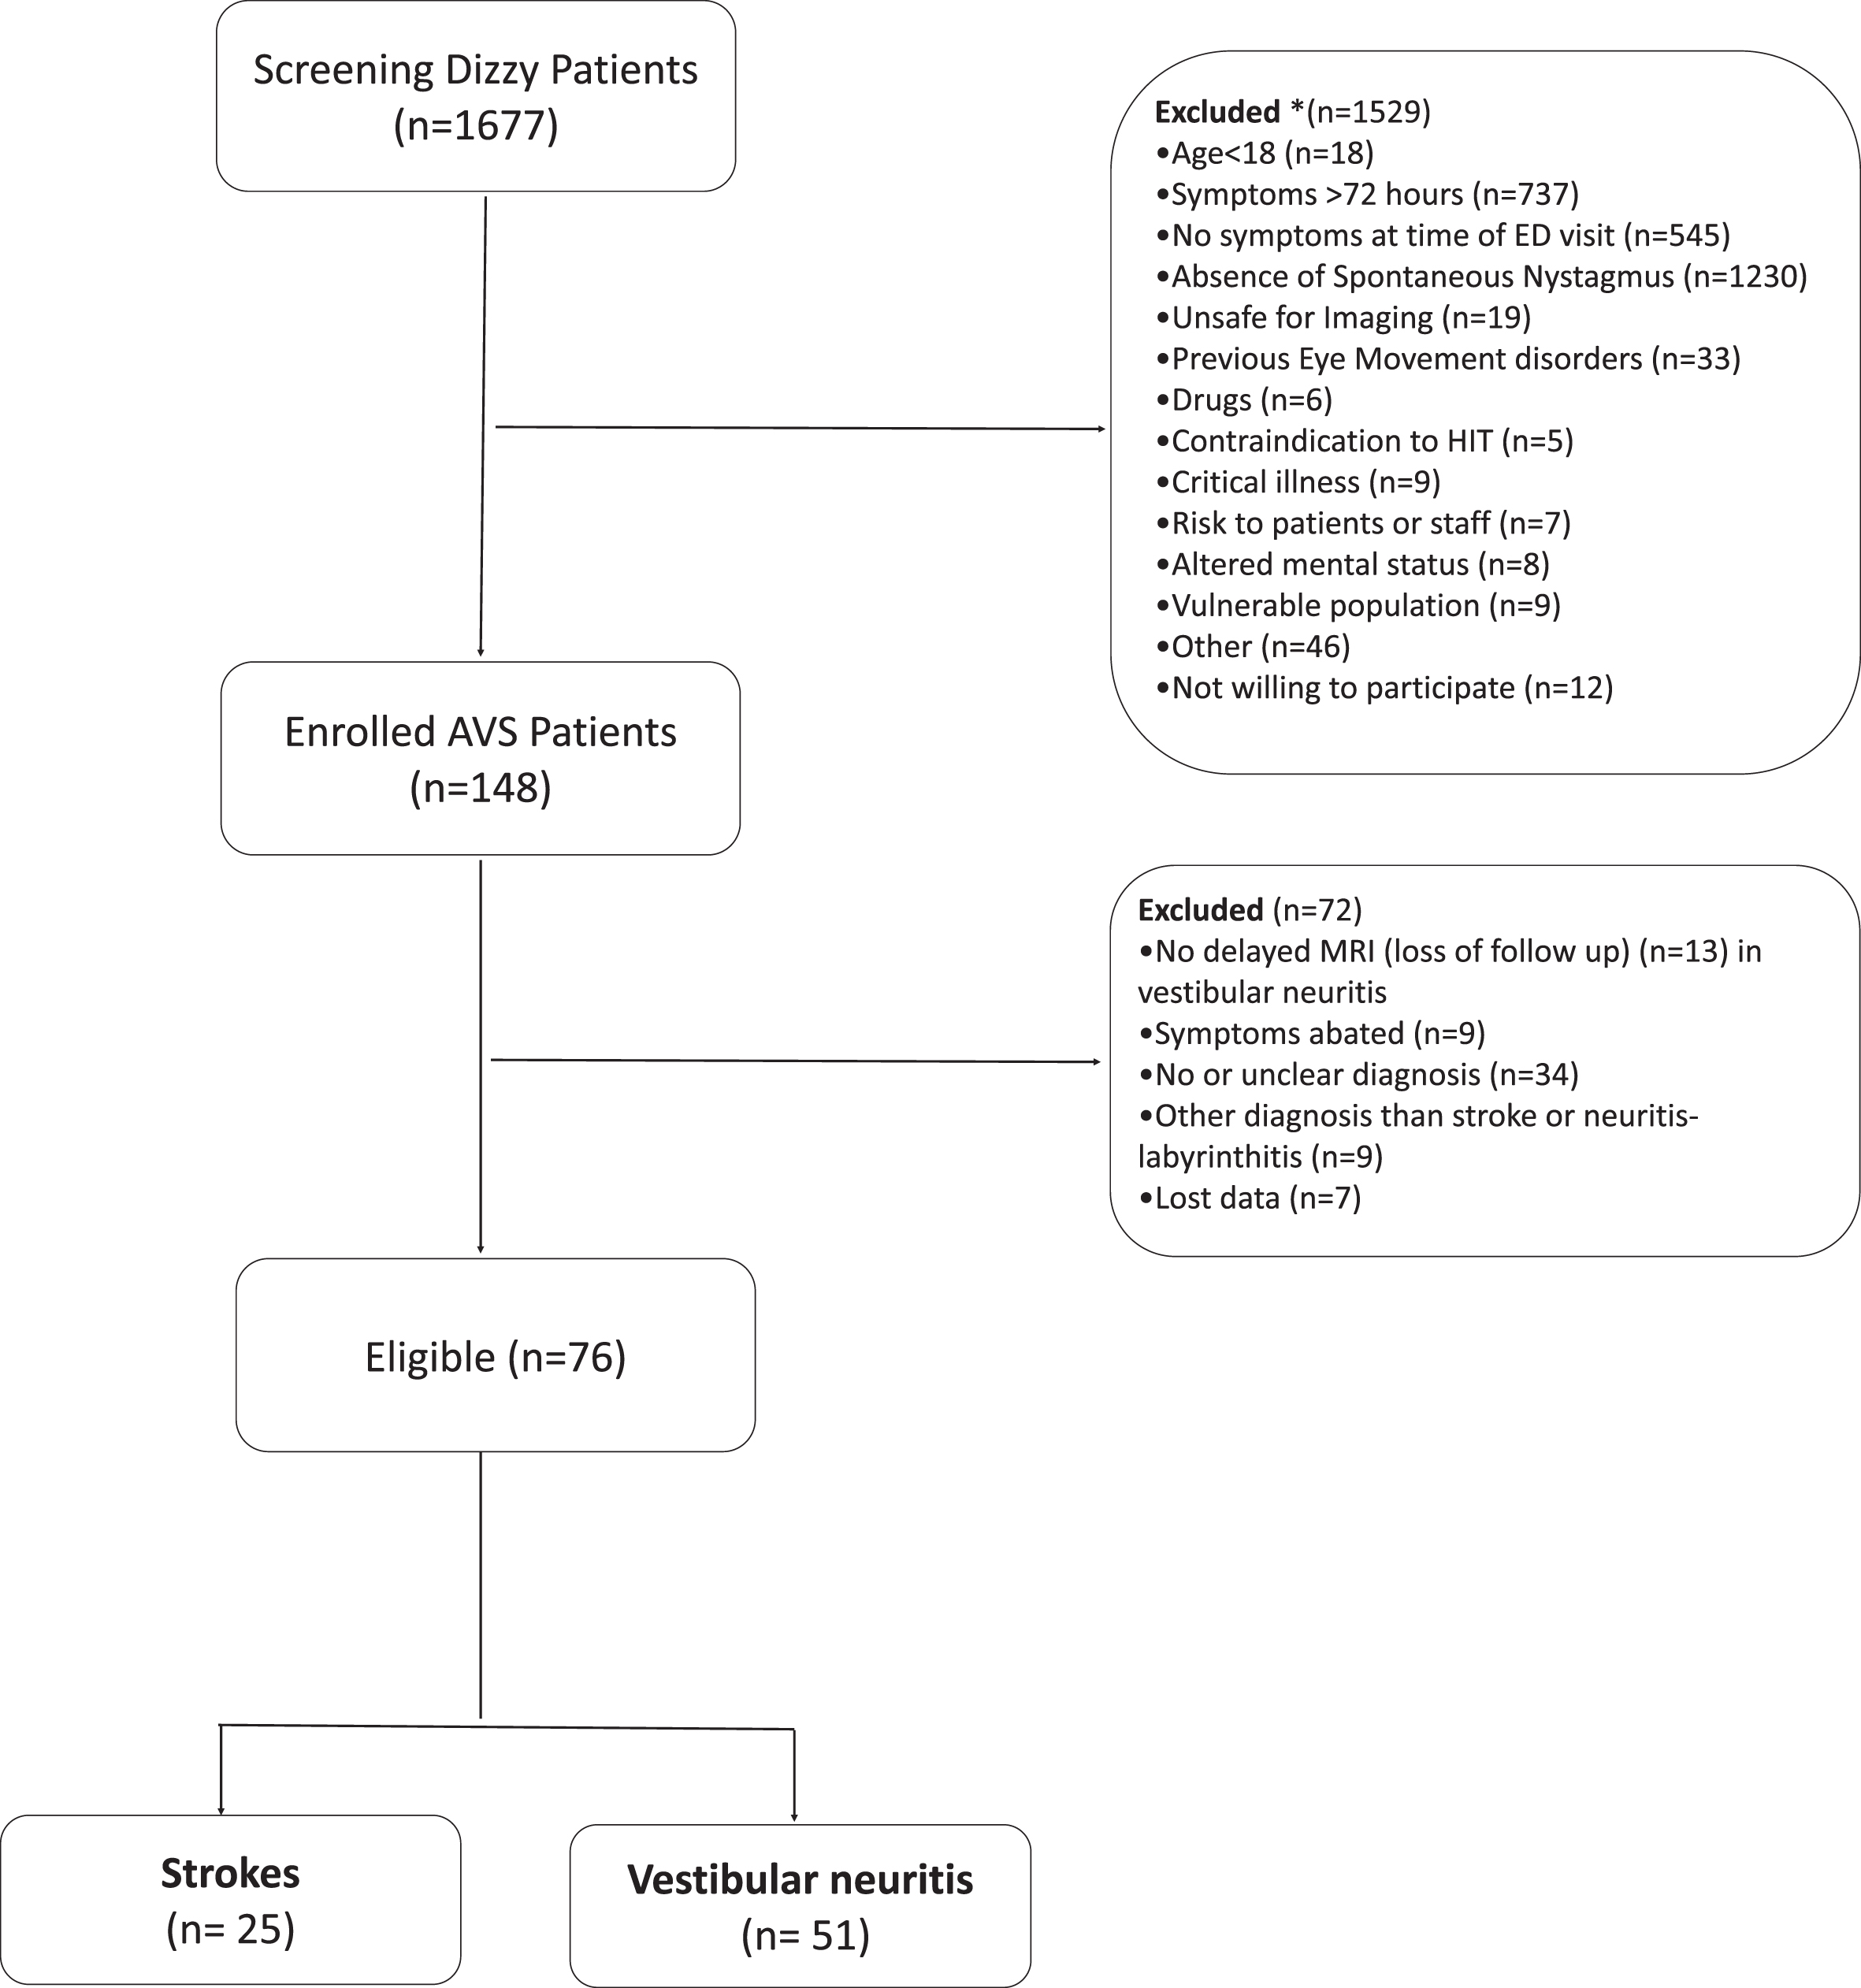
Flow chart showing the screening and enrolment process.
The overall sensitivity in discriminating strokes based on the VOR gain value was 83.3% with a specificity of 88.4%, while the accuracy was estimated 86.8% using a cut-off of 0.665 VOR gain. Table 1 shows details about the diagnostic accuracy of VOR gain in detecting strokes.
Sensitivity and specificity for gain, manual and automatically evaluated saccade mean amplitude and peak velocity
Sensitivity and specificity for gain, manual and automatically evaluated saccade mean amplitude and peak velocity
The accuracy of the cumulative saccade amplitude of the automatically marked saccades in detecting stroke was 71% with a sensitivity of 95.8% and specificity of 63.4% using a calculated cut-off of 2.48° cumulative amplitude (Table 1). The accuracy of the cumulative saccade amplitude of the manually marked saccades in stroke detection was 77.6% with a sensitivity of 95.8% and specificity of 69% using a cut-off of 5.19° cumulative amplitude (Table 1).
Stroke diagnosis based on the saccade peak velocity
The accuracy of the saccade mean peak velocity of the automatically marked saccades in detecting stroke was 71% with a sensitivity of 83.3% and specificity of 65.3% using a calculated cut-off of 152.6°/s peak velocity (Table 1). The accuracy of the saccade mean peak velocity of the manually marked saccades in stroke detection was 77.6% with a sensitivity of 95.8% and specificity of 69% using a cut-off of 260.9°/s peak velocity (Table 1).
Misclassification rates based on vHIT parameters
Based on the calculated cut-off for VOR gain, six patients with acute unilateral vestibulopathy could have been falsely categorized as stroke patients (false positives), while four patients with stroke would have been misdiagnosed as acute unilateral vestibulopathy (false negatives). These patients had a middle cerebral artery stroke (MCA) (1), basilar artery stroke (1), anterior inferior cerebellar artery–peripheral (AICA) (1) and posterior inferior cerebellar artery (PICA) stroke with low gain (1). Figure 3 demonstrates the vHIT of the patient with AICA and ipsilateral low gain. The patients with AICA and PICA, however, would have been correctly categorized as stroke based on the cumulative saccade amplitude and saccade mean peak velocity with manual saccade analysis. The patient with basilar artery stroke could have been correctly categorized using both manual and automated cumulative saccade amplitude and saccade mean peak velocity. The patient with MCA was falsely categorized in all tests. Table 1 gives an overview about the number of misclassified patients stratified by vHIT parameters.
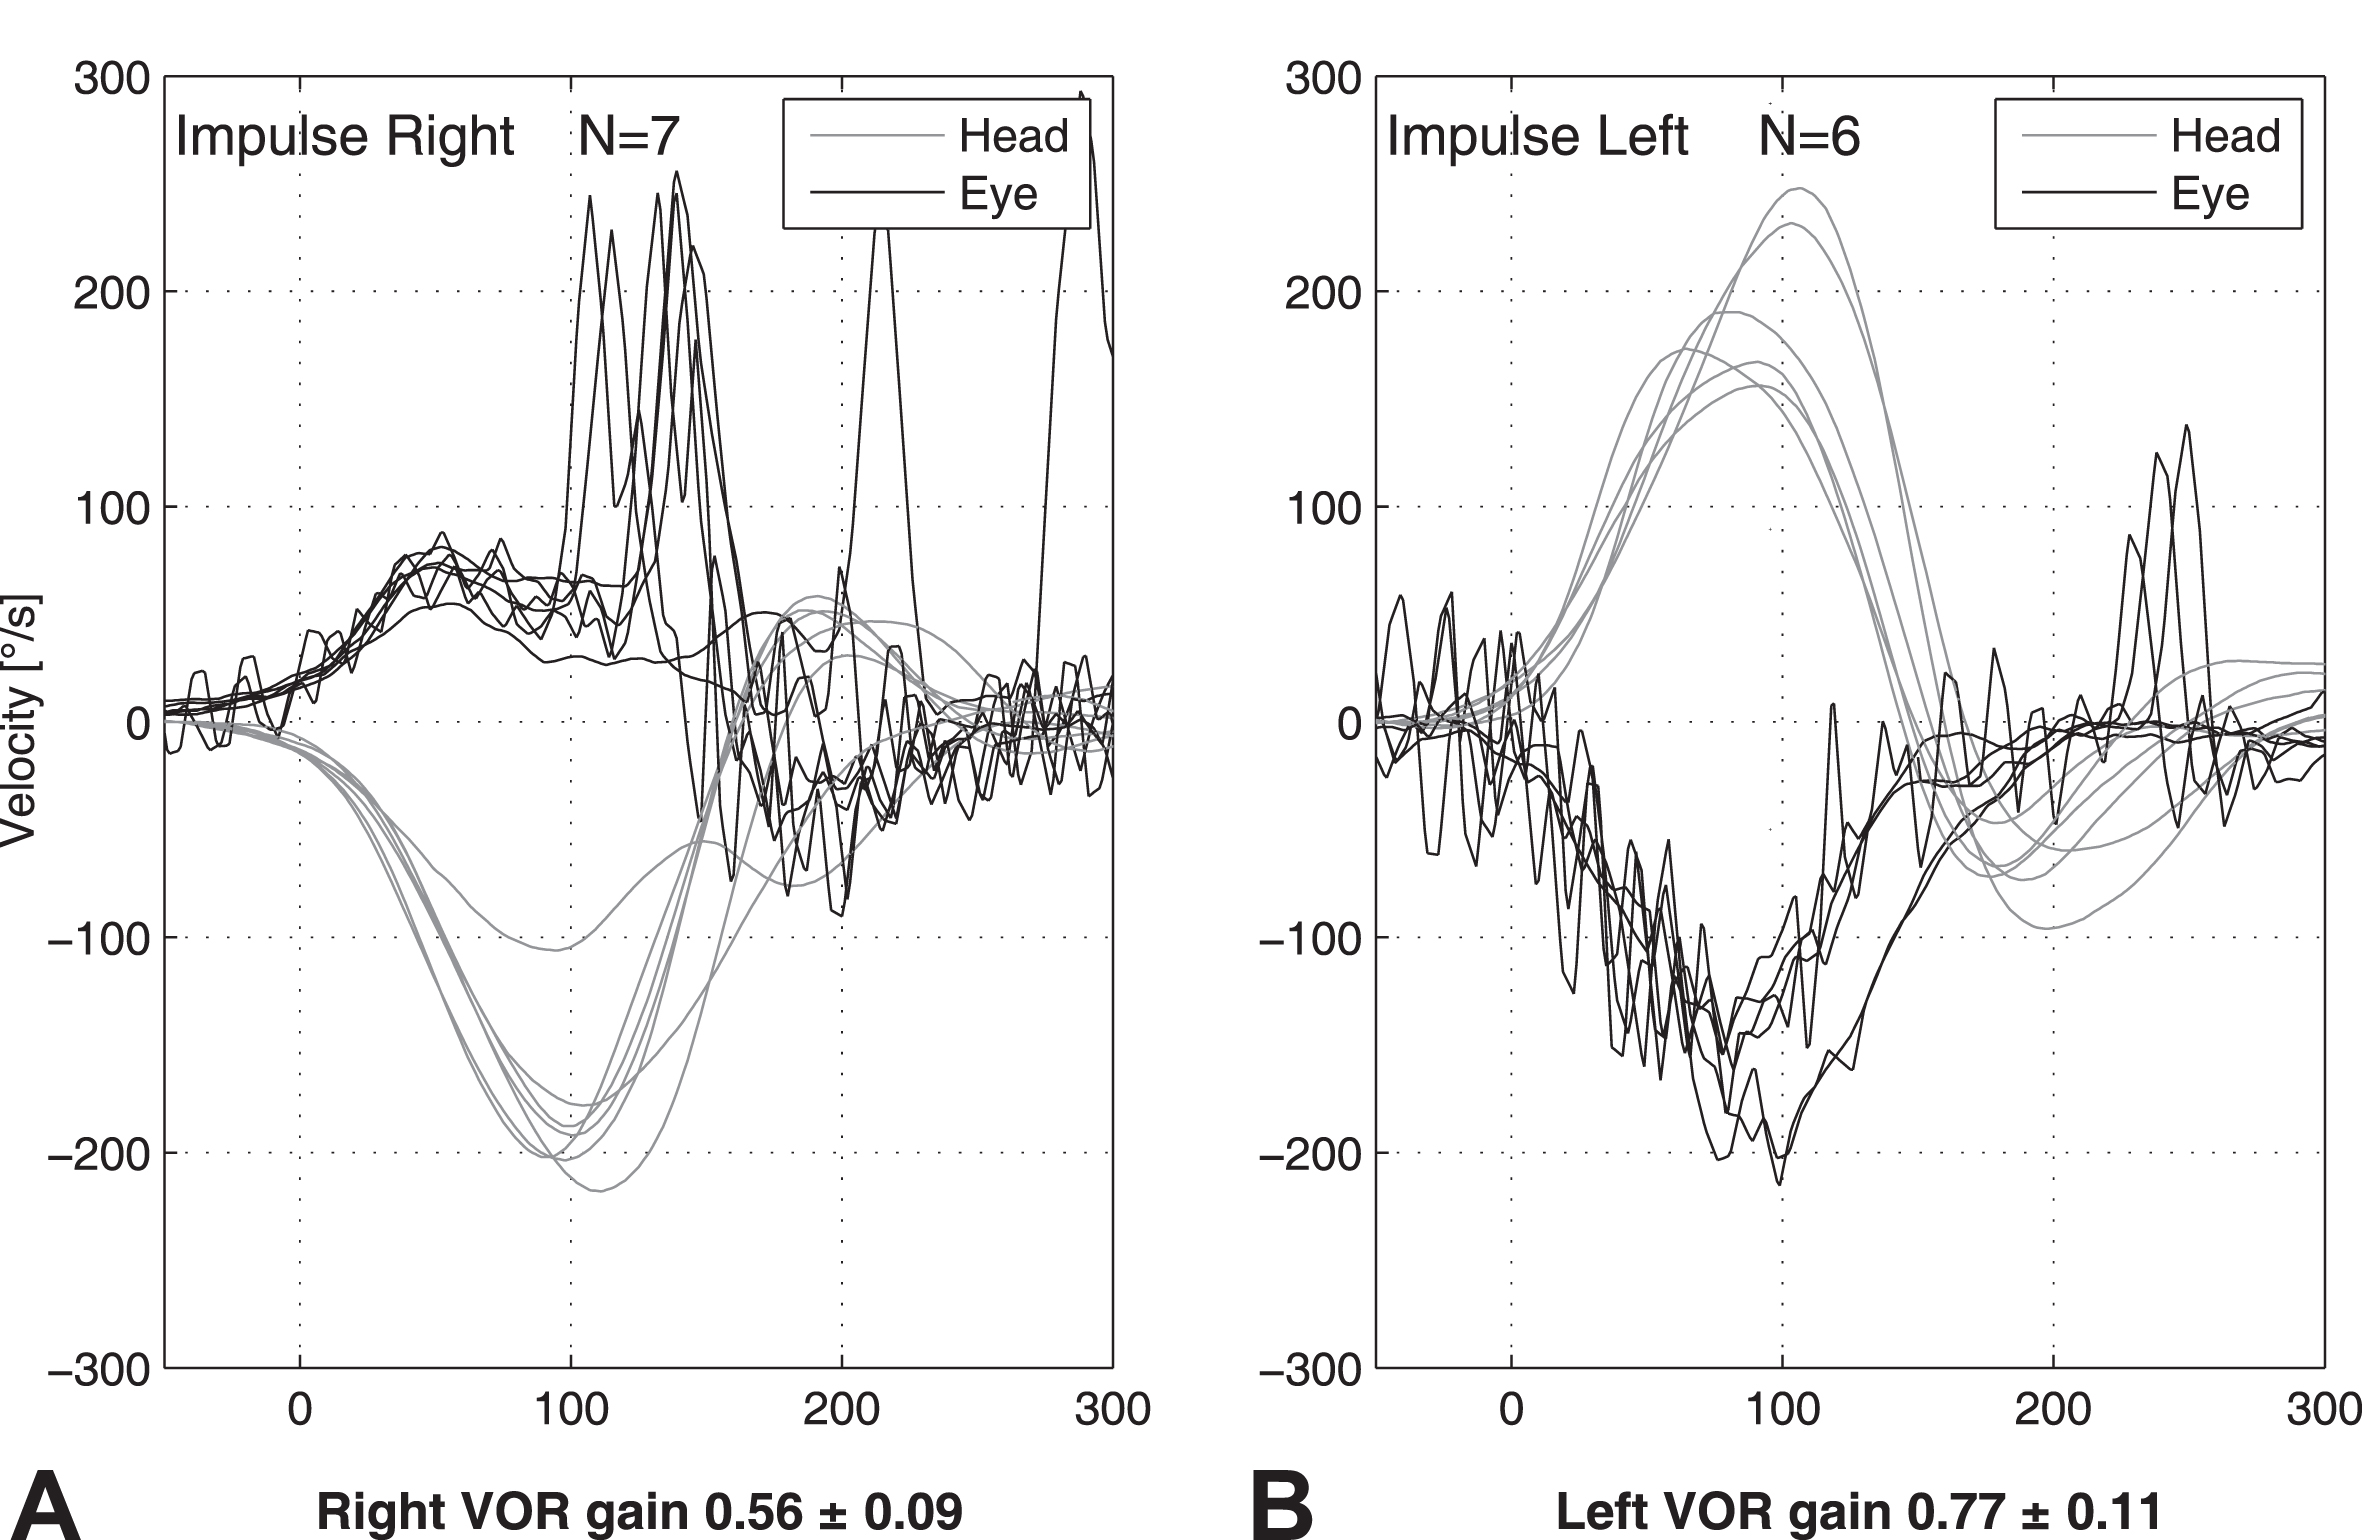
vHIT curve of a patient with AICA stroke who exhibits an ipsilateral low gain (Panel A) and a large proportion of covered saccades. Panel B demonstrates the contralateral side with a few overt anti-compensatory saccades.
The negative likelihood ratio for ruling-out stroke was 0.19 for VOR gain, 0.2 for automated cumulative saccade amplitude, 0.26 for automated saccade mean peak velocity and 0.06 for both manual saccade amplitude and peak velocity. Table 1 shows details about the diagnostic accuracy of saccade analysis in detecting strokes.
Table 2 depicts the pre-test and post- test probabilities of stroke assuming pre-test probabilities based on risk stratification rules and the impact of the negative likelihood ratio (NLR) on stroke probability. Stroke probability decreased by 8–39% points after a vHIT exam, by 8–38% after automated analysis of mean amplitude, by 7.3–31.6% points after estimation of automated peak velocity and by 9.3–59.6% points after analysis of the manual mean amplitude und mean peak velocity, depending on the assumed pre-test probability.
Pre-test and post-test probabilities of no-stroke using gain of VOR, mean saccade amplitude and mean peak velocity to “rule out stroke”
Pre-test and post-test probabilities of no-stroke using gain of VOR, mean saccade amplitude and mean peak velocity to “rule out stroke”
19 of the stroke patients showed a cumulative saccade amplitude higher than the cut-off of 2.49° in the automated saccade evaluation (false positives) and 3 of them were below the cut-off after manual assessment. Furthermore, 18 of the stroke patients showed a saccade mean peak velocity higher than the cut-off of 152.6°/s in the automated saccade evaluation (false positives) and 2 were correctly categorized after manual assessment. In addition, only one patient with vestibular neuritis (VN) was falsely categorized after manual saccade analysis.
The receiver operating characteristic curves for manually estimated cumulative saccade amplitude (AUC = 0.82), automatically estimated cumulative saccade amplitude (AUC = 0.76) and VOR gain (AUC = 0.92) are depicted in Fig. 4a with curves going to the left upper corner. We found a statistically significant difference between the gain ROC curve and the automated cumulative saccade amplitude (p < 0.01) indicating a higher accuracy of VOR gain in detecting stroke. The accuracy in stroke detection (AUC = 0.92) was also significantly superior with VOR gain than with the manual cumulative saccade amplitude (AUC = 0.82), though (p < 0.05, Fig. 4a). Manual cumulative saccade amplitude (AUC = 0.82) is more accurate in detecting stroke than the automated cumulative saccade amplitude (AUC = 0.76, Fig. 4a), and equally here the difference is statistically significant (p < 0.05).
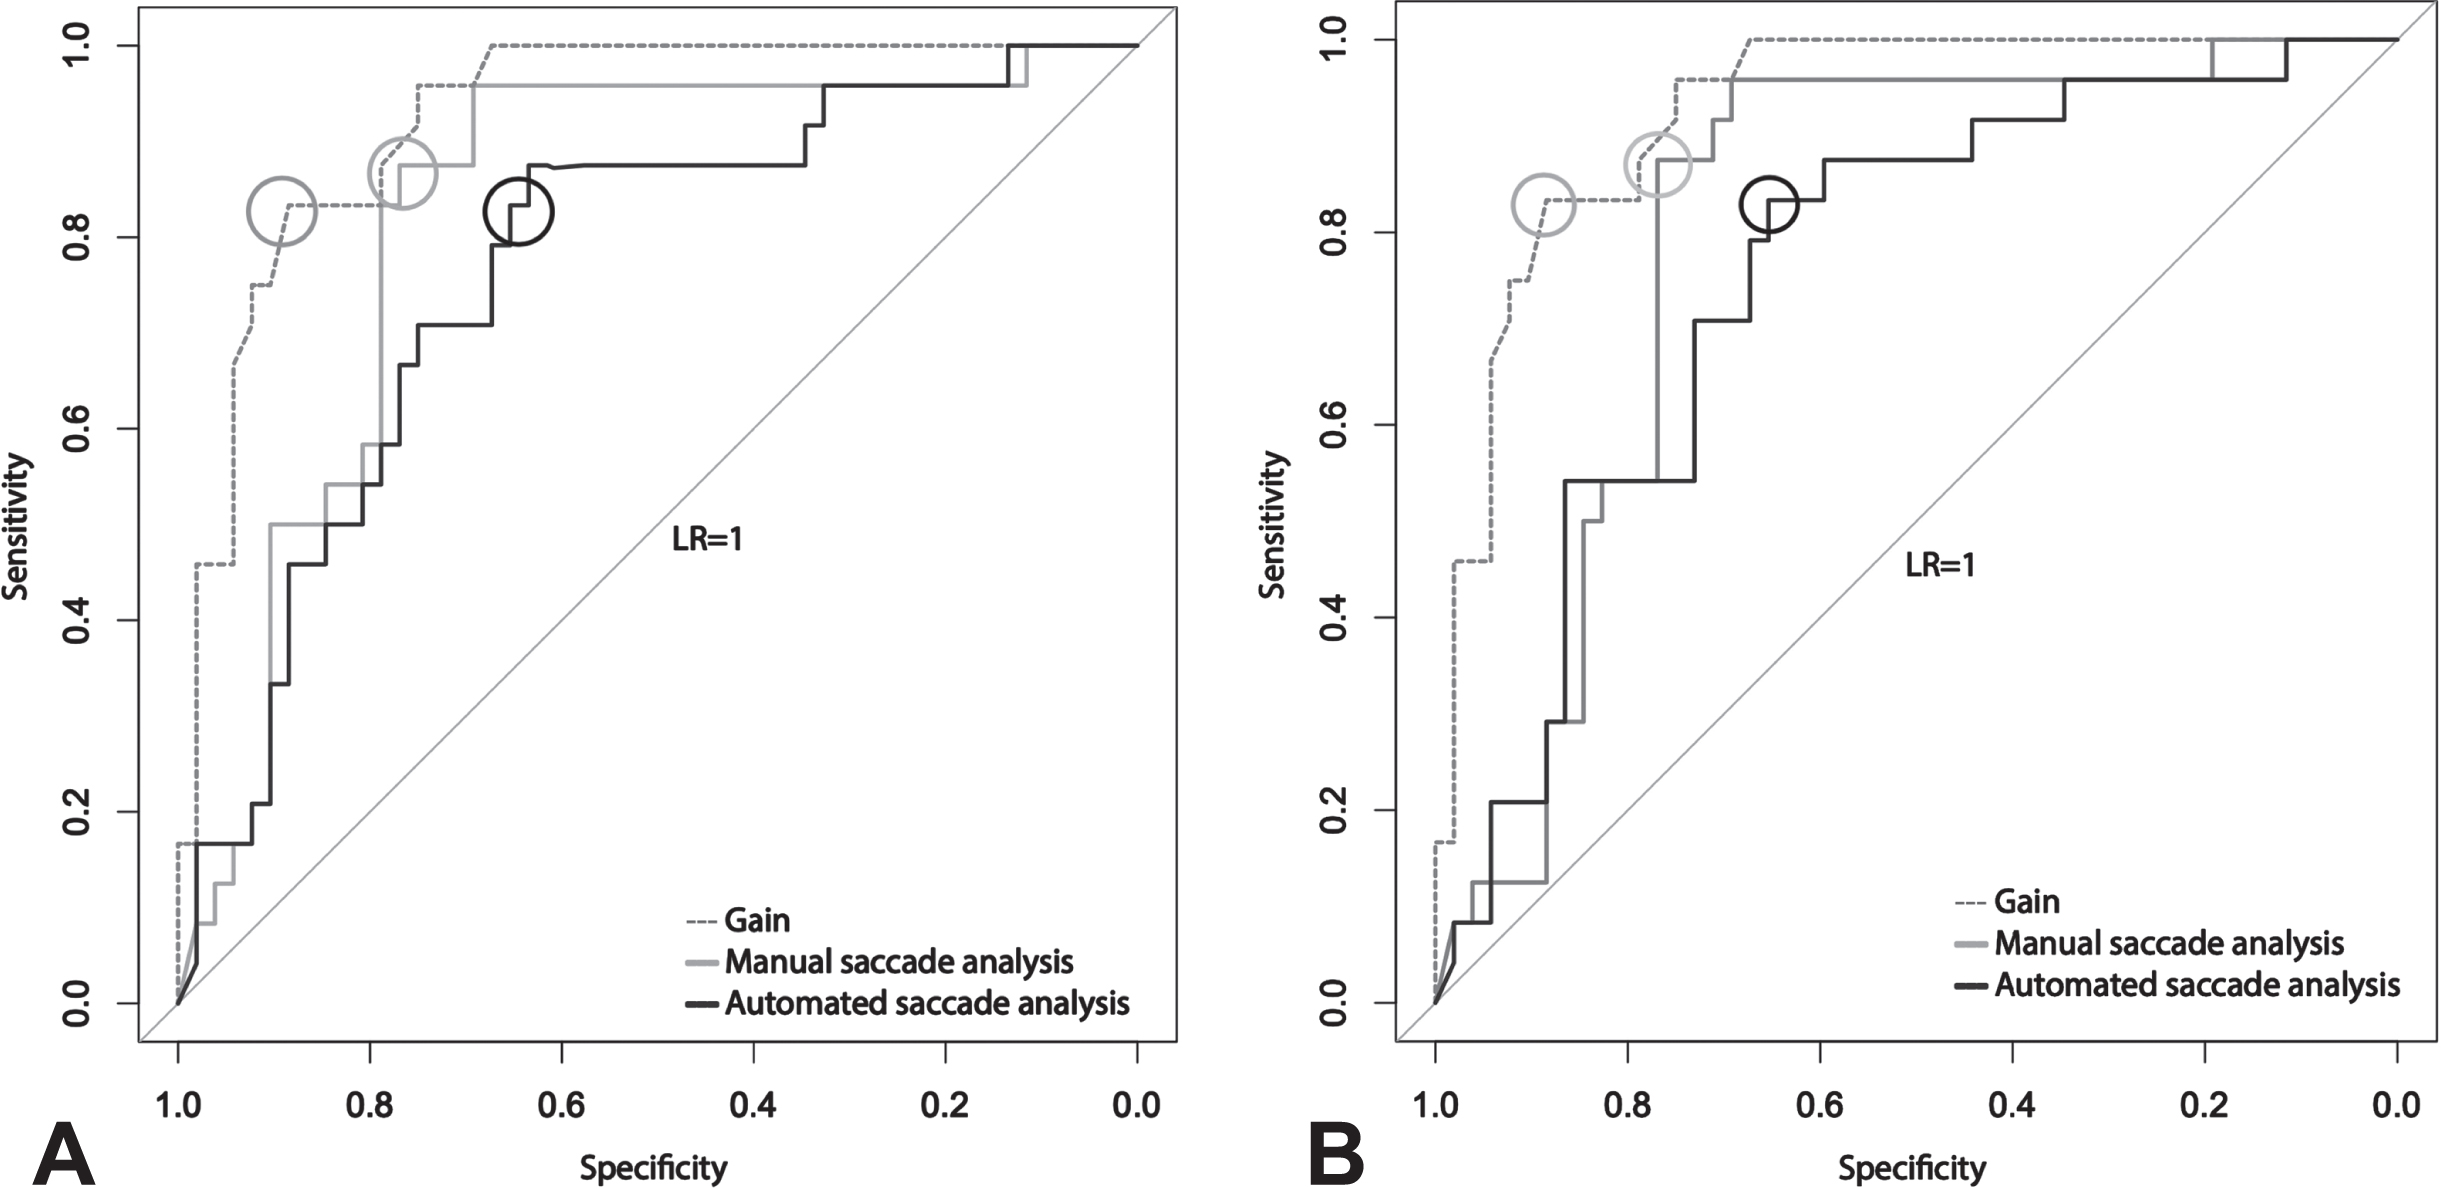
a) ROC curves for gain, manual and automated evaluated saccade mean amplitude. ROC curve demonstrating a higher sensitivity for saccade mean amplitude and higher specificity for gain for the detection of stroke. b) ROC curves for gain, manual and automated evaluated saccade peak velocity. ROC curve demonstrating a higher sensitivity for manually evaluated saccade peak velocity and higher specificity for gain for the detection of stroke. The circles indicate the optimal test discrimination cut-off for each test. The light grey line illustrates a likelihood ratio of 1 with an area under the curve (AUC) at 0.5 indicating an unhelpful test.
The receiver operating characteristic curves for manually estimated saccade mean peak velocity (AUC = 0.8), automatically estimated saccade mean peak velocity (AUC = 0.75) and VOR gain (AUC = 0.92) are depicted in Fig. 4b with curves going to the left upper corner. We found a statistically significant difference between the gain ROC curve and the automated and manual saccade mean peak velocity (p < 0.01) indicating a higher accuracy of VOR gain in detecting stroke. The accuracy in stroke detection was superior with manual saccade mean peak velocity (AUC = 0.8) than with the automated saccade mean peak velocity (AUC = 0.75, Fig. 4b), however the difference was not statistically significant (p > 0.05).
In this study, our aim was to highlight the ‘gain’ versus ‘saccades’ dilemma. Our findings indicate that, within our small group of patients, VOR gain demonstrates significantly better diagnostic accuracy than saccade metrics in distinguishing vestibular stroke from acute unilateral vestibulopathy, irrespective of whether saccades are analyzed automatically or manually. However, automated saccaded analysis needs further improvement in order to reach the accuracy of manual processing.
Stroke prediction based on VOR Gain
We found a VOR gain cut-off of > 0.66 for stroke prediction. This cut-off is in agreement with other studies reporting cut-offs between 0.68 [31, 55], and 0.7 [34, 59]. The sensitivity and specificity in diagnosing stroke was 83.3% and 88.4% respectively. Although a higher cutoff increases the risk in diagnosing patients with a mild acute unilateral vestibulopathy and borderline low gains (e.g. 0.66–0.8) as a stroke, a lower and more conservative chosen VOR gain cut-off reduces the number of false negative results. Caution is advised when interpreting VOR gain since vHIT measurements in the acute stage (bedside) are susceptible to artifacts, such as bump artifacts and goggle slippage, which tend to emerge around 60–80 ms [32, 37]. Current vHIT algorithms are effective at filtering noisy data making them very robust to artifacts. To date, there is no superiority of any VOR gain calculation method. Importantly, artefacteous data create random noise rather than a systematic gain bias [61].
Saccades analysis for stroke prediction
A cumulative saccade amplitude lower than 2.48° and a saccade mean peak velocity lower than 152.6°/s indicated a stroke when saccades were automatically estimated by the software. The manual saccade analysis showed a higher cut-off value being at 5.19° and 260.9°/s which is a more conservative value that reduces the number of false negative findings.
Chen et. al studied, among other characteristics, the cumulative saccade amplitude in patients with pontine-cerebellar stroke (PCS) and acute unilateral vestibulopathy. Using a cut-off of 4.3°, higher than the cut-off that we used during automated evaluation and lower than the cut-off of our manual analysis, they showed that cumulative amplitude has a 94% sensitivity in differentiating patients with PCS and VN. The sensitivity and accuracy of this study was higher than those of VOR gain and automated saccade cumulative amplitude and saccade mean peak velocity in our study. Chen et. al calculated the overt saccade amplitude using scleral search coils, which is the gold standard to record HITs. This technique shows, nonetheless, in comparison to recording with goggles many practical difficulties and is limited to certain specialized laboratories [10].
The sensitivity of manual saccade analysis, including cumulative saccade amplitude and saccade mean peak velocity, in our study was higher than in Chens study, proving again that automated algorithms for saccade analysis, even when the gold standard for HIT record is used, are not yet perfect or superior than manual analysis.
The creators of ‘HITCal’, a computer software program which analyzes and explores the characteristics of refixation saccades such as the delay between these saccades, proposed the PR algorithm (Perez and Rey Score) as an indicator of saccade distribution and evaluation tool for vHIT [47]. This calculated saccade score, however, is not suitable for use in the acute setting, as its utility is focused on the discrimination of well-compensated and un-compensated vestibulopathy [3].
Other studies focused on the diagnostic value of refixation saccades in diagnosing Meniere’s Disease (MD) [4]. The study of Du et al. validated the effectiveness of 1st saccade velocity on identifying the affected side and MD stages [15] and Heuberger et al. studied how the covert anti-compensatory quick eye movements (CAQEM) and their characteristics can help to distinguish patients with vestibular migraine (VM) and MD [19]. Although the CAQEM were studied only on VM and MD, they are a commonly observed phenomenon in vHIT with gain asymmetries and should not be confused with compensatory saccades or artifacts.
At the same time, we proved that manual evaluation of the saccades significantly increased the test accuracy when cumulative saccade amplitude was tested. The cut-off for the mean cumulative amplitude was calculated to be 5.19° in the automated evaluation and 2.48°, almost the half, in the manual, resulting in the misclassification of 5 more patients in the automated analysis (Table 1). We assume that smaller saccades might be missed by the algorithm and therefore suggest relying on the automated system in the ED, given the necessity to prioritize first and foremost, the fast exclusion of a critical illness. Manual evaluation is not only time-consuming but also relies on the know-how of an expert, who may not always be readily available.
At this point we need to clarify that at the beginning of the data analysis for the DETECT study the creators of the software used, developed the new EyeSeeCam Sci software and programmed some versions specially configured for this study. The main goals were to develop the multicenter capable software that can merge the data from multiple computers and also to allow manual marking of the saccades. A precursor for automatic analysis was also included at that time. Over time, many successor versions have been installed and the import of the old data and the detection of saccades was improved again and again.
False positive HIT results based on VOR gain alone
The vHIT assessment of a single parameter such as VOR gain or saccades alone bears the risk of misclassification.
AICA strokes can produce unilateral or bilateral low (abnormal) VOR gains mimicking a acute unilateral vestibulopathy. There are cases described in the literature where patients with AICA stroke or superior cerebellar artery show a marginal (borderline) low gain [10, 44]. An ipsilesional deficient VOR gain can be induced by infarction of the pontine vestibular nucleus, vestibular nerve root entry zone (fascicle), or labyrinth [21].
Isolated floccular infarction, although very rare, can also result in an impaired bilateral VOR response to high acceleration using the HIT, because the flocculus plays a major role in the regulation of the VOR; inhibiting the horizontal VOR during low-frequency stimulation and facilitating it during high-frequency stimulation [45]. The bilaterally reduced VOR gain seen in AICA strokes and in isolated floccular infarctions theoretically could be attributed to the correlative interneuron connections between the vestibular nuclei, connections via the inhibitory and excitatory floccular target neurons in the ipsilesional vestibular nucleus, or adaptive action of the contralateral flocculus [16, 53]. The above finding was also present in our study with one AICA stroke patient showing ipsilateral low gains in vHIT.
PICA and SCA strokes have bilateral normal VOR gain, however, a bilateral milder gain reduction around 0.75 with small corrective saccades can sometimes be observed explained by partial disturbance of the projection from the flocculus or the nodulus and uvula to the vestibular nucleus [7, 11]. Furthermore, a PICA infarct is likely to cause a mass effect, typically appearing approximately 2 to 3 days after the onset of symptoms, on the vestibular nucleus or 8th nerve root-entry zone in the pons. A symmetric mild VOR gain reduction in PICA stroke is therefore akin to the way a localized cerebellar lesion modulates the high-acceleration VOR in humans, in contrast to diffuse processes, which affect the gain variably [14].
Moreover, Nam et al. showed in their study that the presence of bilateral, symmetric, small-amplitude corrective saccades can efficiently differentiate PICA stroke from VN [38]. However, previous research has indicated that individuals with cerebellar ataxia (CA) who exhibit normal calorics also experience a decrease in their vestibulo-ocular reflex (VOR) gains. According to Kremmyda et al., patients with CA display a pathological response, which can be attributed either to a concurrent degeneration of the vestibular system and cerebellum or to dysfunction in the central cerebellar flocculus. Consequently, clinically, these patients exhibit an abnormal bedside head impulse test (HIT), which may not necessarily indicate a peripheral vestibular dysfunction and could be considered a “false-positive” clinical HIT [14, 28].
On the contrary, stroke in the territory of the MCA may occasionally cause an AVS including vertigo, nausea, and unsteadiness. These patients may exhibit horizontal spontaneous nystagmus but, the VOR is unaffected and the vHIT is normal [62].
Strokes cannot only produce abnormal vHITs but also abnormal caloric results in up to 25% of cases [41]. Although gain reduction and asymmetry in vHIT is considered as a direct sign of vestibular loss, it is only an instantaneous measurement at 30, 40, 60 ms and does not depict the whole time and frequency range of the VOR [8, 61].
In addition, after a unilateral ocular motor nerve palsy, gain is reduced during movement in the direction of action of both paretic and non-paretic muscles, while gain in the healthy eye remains normal, implicating a selective adjustment of the paretic eye, specifically to the antagonists of paretic muscles [49, 50].
On the other hand, a normal vHIT does not mean necessarily stroke. The study of Lee et al. showed that only 10% of patients examined within 1 hour to 3 days of the onset of symptoms and who initially presented with acute vertigo, spontaneous nystagmus and normal vHIT had actually stroke [29]. The rest were diagnosed with Meniere’s disease, sudden sensorineural hearing loss with vertigo (labyrinthitis), vestibular migraine, and inferior vestibular neuritis. Patients presenting initially as an AVS might have had a symptom duration below 24 hours, which should be re-classified as an episodic vestibular syndrome [5]. Such patients are still at risk to suffer from an undiagnosed stroke with dizziness and headache [44]. A transischemic attack (TIA) or stroke is more likely to be missed in younger, female and non-white patients [44]. Diffusion weighted MRIs (performed within 48 hours after symptom onset) are often false negative (50%) for smaller strokes (<1 cm) [41]. Dizzy patients discharged home are more likely to return with a stroke within the first month [20]. For these reasons, we still recommend a stroke work-up in MR-negative AVS patients and further neurootological tests (including hearing test) as a second line in an outpatient setting.
A mild acute unilateral vestibulopathy with a bilateral normal vHIT gain can be confirmed by abnormal calorics [41] at a later subacute stage.
False positive HIT results based on saccade metrics alone
The higher reliability of gain in the evaluation of VOR in patients with AVS is not surprising taking into consideration that saccades are examined in a larger time lapse and thus are more vulnerable to artifacts. The vHIT saccade analysis can be complicated due to disruptive artifacts (reduced patient cooperation, inattention eye blinking or spontaneous nystagmus). [37].
Saccade analysis might be more variable and biased by the visual system. The involvement of the visual system after the first 60 miliseconds of head movement increases the risk of extra-vestibular origin inputs such as the saccadic, the optokinetic and the smooth pursuit system or the cervico- ocular reflexes [13].
False positive saccades with borderline normal gain might lead to a misinterpretation of a vHIT. Saccades in the presence of normal gain are frequently observed in older individuals (> 70yrs) in the context of presbyvestibulopathy [40]. The above was confirmed in the study of Anson et al, who observed that aging increases the compensatory catch-up saccade amplitude in healthy adults [1]. Nonetheless, a constraint in this research was the absence of imaging data. It’s important to note that small vessel disease can potentially influence the vHIT results, and this factor wasn’t accounted for in the study. Consequently, it becomes challenging to definitively attribute the occurrence of catch-up saccades in older adults to either the aging process or the extent of small vessel disease. Saccades can be observed in younger healthy individuals, though, suggesting that VOR is a hypometric system. In the study of Yang et al. saccades were observed in about half of healthy ears, regardless of the age of the subjects [58].
Patients with Meniere’s disease and a normal VOR gain [18, 33, 46, 43], however, demonstrate significantly larger cumulative and first saccade, when compared to age-matched healthy controls [60]. Saccades can also occur with subjects suffering from eye misalignments (tropia). VOR gains, however, are affected, too [63–65].
False negative HIT results based on saccade metrics alone
Any oculomotor disorder can distort the interpretation of vHIT results. Patients with an INO (internuclear ophtalmoplegia), for example, have an unilateral low gain but absence of corrective saccades when VOR is tested on both horizontal semicircular canals (SCC) [30]. Corrective saccades are most frequently recorded when testing the contralesional posterior SCC, accordant to the most pronounced VOR-gain reduction for this canal. The horizontal gaze palsy in the ipsilesional eye and the dissociated abducting nystagmus in the contralesional eye might be confounding factors in this case [30]. In bilateral cases, though, gain is reduced bilaterally and compensatory saccades are present ipsilateral to the recorded eye [27].
Strengths and limitations
To our knowledge, our study is the first to focus on the cumulative amplitude of compensatory saccades in vHITs and its significance in differentiating stroke from acute unilateral vestibulopathy.
Our sample was relatively small and the tests were performed by experts which potentially limits the generalizability of our results. Since non-experts are able to perform valid vHIT measurements after being instructed and teached by experts [24], they may benefit from the automated saccade analysis provided by the vHIT device.
The vHITs were recorded using only the EyeSeeCam and the results were not compared with other vHIT devices with different saccade detection algorithms or with the gold standard technique of the scleral search coils to confirm the reliability of our measurements. Nevertheless, the differences in vHIT results due to the use of different measurement systems appear to be statistically insignificant, when using the same gain technique [12]. However, we examined only vHITs in the horizontal plane. The extent to which these results are applicable to the anterior and posterior planes remains an open question.
Finally, we included patients with selected inclusion criteria, so the diagnostic accuracy study in unselected patients with an AVS is unknown.
Implications for clinicians and future research
Our study contributes to the resolution of the gain versus saccades dilemma by showing that the diagnostic accuracy of VOR gain was significantly higher than that of saccade cumulative amplitude or the saccade peak velocity, regardless of whether the saccades were analyzed automatically or manually. Saccade evaluation alone would tend to overdiagnose stroke, resulting in consequently to expensive and unnecessary diagnostic work-ups and prolonged patient stay in the ED. VOR gain shows a low rate of missed stroke patients and should be considered as the primary diagnostic marker. We still strongly recommend the additional interpretation of the complete recorded velocity trace morphology (head and eyes) including saccades, which provides additional information on data quality and the plausibility of the results. Saccade analysis could be an important parameter in the diagnosis of vestibular strokes especially in the presence of noisy vHIT traces caused by artifacts and irregular practices or when calibration is not performed properly and the VOR gain is higher than 1 on the healthy side.
The importance of saccade characteristics in the vHIT is increasingly recognized, but further studies are needed in order to explore the potential applications of saccade metrics in the diagnostic procedures on vertigo patients.
Conclusions
vHIT devices provide an automated analysis of several parameters. We found a better accuracy of vHIT for the diagnosis of vestibular strokes when using the VOR gain rather than when using saccades metrics. Nevertheless, saccades provide an additional and important information for vHIT evaluation. Automated saccade detection algorithm is not yet perfect compared to the manual analysis by an expert, but it may become a valuable tool for future vHIT evaluations by non-experts.
Footnotes
Acknowledgments
EyeSeeTec GmbH loaned the VOG goggles.
Author contributions
EM: data curation, writing-original draft, critical revision of the article, final approval of the version to be published.
AK: patient recruitment, data collection, data analysis, database setup, critical revision of the article, final approval of the version to be published.
TW: software, data curation.
SB: software, data curation, formal analysis, editing.
ES: general manager and a shareholder of EyeSeeTec GmbH, final approval of the version to be published.
MM: patient recruitment, data collection, critical revision of the article, final approval of the version to be published.
FW: data imaging analysis, critical revision of the article, final approval of the version to be published.
MC: supervision, funding acquisition, critical revision of the article, final approval of the version to be published.
GM: conceptualization, investigation, methodology, data analysis, supervision, project administration, funding acquisition, final approval of the version to be published.
Conflict of interest statement
ES is the general manager and a shareholder of EyeSeeTec GmbH.
Ethics statement
The study was approved by the Local Ethics Committee. The patients/participants provided their written informed consent to participate in this study.
Disclosures and funding
The project was supported by the Swiss National Science Foundation (Grant #320030_173081).