In recent years, people have paid more and more attention to the health hazards caused by O exposure, which will become a major problem after fine particulate matter (PM).
OBJECTIVE:
To investigate the effects of ozone (O) exposure on blood glucose levels in rats under different concentrations and times.
METHODS:
Eighty rats were divided into control group and three ozone concentration groups. Each group was continuously exposed for 1d, 3d and, 6d, and exposed for 6 hours daily. After exposure, GTT, FBG, and random blood glucose were measured.
RESULTS:
The FBG value increased significantly on the 6th day of 0.5 ppm and the 3rd and 6th days of 1.0 ppm exposure compared with the control group ( 0.05). The random blood glucose value was significantly increased on the 3rd and 6th days of each exposure concentration ( 0.05). When exposed to 1 ppm concentration, the 120 min GTT value of 1 d, 3 d and, 6 d was significantly higher than that of the control group ( 0.05).
CONCLUSION:
After acute O exposure, the blood glucose level of rats was affected by the exposure concentration and time. The concentration of 0.1 ppm had no significant impact on FBG and random blood glucose, and O with a concentration of 0.1 ppm and 0.5 ppm had no significant impact on values of GTT at 90 min, and 120 min.
In recent years, people have paid increasing attention to the health hazards caused by O exposure, which is becoming a prominent problem affecting human health following fine particulate matter (PM). In 2021, the WHO revised its Global Air Quality Guidelines based on evidence of health effects associated with long-term O concentrations and total and respiratory mortality, adding the seasonal average of peak O concentrations (i.e., warm season peaks) with a guideline value of 0.03 ppm [1]. China has strict regulations on indoor and outdoor O concentrations. The outdoor O standard is that of the Ambient Air Quality Standard [2] in which the maximum concentration of O is 0.08 ppm (1 h mean, Class I) and 0.01 ppm (1 h mean, Class II). The indoor O standard is that of the Indoor Air Quality Standard in which the maximum concentration of O is 0.08 ppm (1 h mean) [3]. As the Chinese economy has grown and its level of workplace automation has increased, many occupational practitioners have received high exposure to O, which has become a major occupational hazard factor; for example, laser printers emit O3 and volatile organic compounds (VOCs) during operation [4]. Pan [5] found that the levels of O and VOCs produced by printers increased significantly during extended operation. Wang et al. [6] found that the average concentration of O was 0.173 mg/m at the peak of office printing and photocopying work (2 h), which is higher than the Sanitary Standard for Ozone in Indoor Air. Feng et al. [7] investigated and studied the chemical hazards to which the staff of horse racing enterprises in the specified animal disease-free zone were exposed. After detecting the harmful chemical substances in the atmosphere under different working conditions, they found that the maximum exposure concentration of O in the air under welding maintenance conditions was 0.51–0.64 mg/m, which exceeded the maximum allowable concentration (0.3 mg/m) by nearly twice, so people engaged in welding might suffer from a minor hazard risk, that is, the concentration of O exceeds its maximum allowable concentration. Comprehensive waste treatment plants (CWTPs) form a large number of O precursors, such as VOCs and nitrogen oxide, resulting in a net accumulation of O [8]. Guo et al. [9] conducted an on-site investigation and evaluation of occupational health in a metal component factory. At some work posts, the O exposure exceeded the national standard concentration and became an important factor of occupational hazards.
With the deepening of research on the harm caused to the body by O exposure, it has been found that O not only causes serious damage to the lungs and cardiovascular system but also has a certain impact on blood glucose levels, which has drawn the attention of environmental biology experts. Diabetes is the major cause of the incidence rate and mortality of noncommunicable diseases. In 2012, the WHO reported that the global adult prevalence rate had risen to 8.5%, causing 1.5 million deaths. O exposure is considered a potential main pathogenic factors for the onset of Type 2 diabetes (T2DM). Epidemiological studies have shown that O exposure can aggravate the increase of insulin resistance (IR) [10] and may increase the risk of T2DM [11]. Paul et al. [12] conducted a cohort analysis of 4.8 million Canadian adults without a history of diabetes for more than 10 years. The results showed that the average O concentration at the 3-year baseline was 46.5 ppb, and each 6.3 ppb increase in O concentration was associated with 0.5% increased risk of T2DM events. Hernandez [13] showed that an increase of 10 ppb in average annual O concentration from 2002 to 2008 was associated with a 6% increase in the hazard of T2DM events in the United States. Liu [14] conducted a cohort study on individual O exposure among more than 30,000 rural people in Henan Province. For every 4.04 g/m increase in O exposure, the prevalence of T2DM and fasting blood glucose (FBG) levels increased by 53.3% and 0.292 mol/L, respectively. Elderly people and men are vulnerable to the effects of O exposure on T2DM and FBG. However, the effect of O exposure on blood glucose level and its inducing mechanism is not yet fully understood. The above study was conducted on the relationship between chronic O exposure and T2DM. However, the impact of acute O exposure on blood glucose level has been given less attention. In real life, the duration of severe O pollution in the environment is short, and workers at posts with severe O exposure are highly mobile. Therefore, we need to pay more attention to the impact of acute O exposure on blood glucose metabolism. This experiment explored the effects of acute O exposure at various times and concentrations on the change of blood glucose levels using an exposure model test with rats, thereby providing references for the inducement and prevention of diabetes.
Materials and methods
Animals
Six-week-old SPF male Wistar rats (Huafukang Company, Beijing production license: SCXK (Beijing) 2019-0008); body weight 195 20 g; temperature 22–24C; humidity 50%; and all rats were given a sufficient supply of food and drinking water.
Main instruments and reagents
O generator (Chuanghuan Ozone Electrical Equipment Co., Ltd., Guangzhou); portable O detector (Korno, Shenzhen); blood glucose meter (Roche, USA, model: Instant); blood glucose test strips (Roche, USA, model: REF 07819382); 20% glucose injection (Shuanghe Pharmaceutical Company, Beijing).
Experimental grouping and O exposure scheme
There were 80 Wistar rats in total, of which 40 were exposed to glucose tolerance testing (GTT) detection and randomly divided into 4 groups of 10 according to weight: control group (0 ppm) and 0.1 ppm, 0.5 ppm and 1.0 ppm O exposure groups. The other 40 rats were exposed to random blood glucose (RBG) and FBG detection, and randomly divided into 4 groups of 10 according to weight: control group, 0.1 ppm, 0.5 ppm, and 1.0 ppm O exposure groups. They were exposed to O for 1 day, 3 days and 6 days (8:00–14:00 every day). The tail vein blood of rats was taken to detect GTT, FBG, and RBG using a Roche blood glucose meter, and the FBG and RBG values of the rats were detected according to the experimental plan. A silent arc-discharge generator generates O from oxygen. The concentration in the exposure chamber is monitored in real-time by an O detector. The O flow was adjusted according to the O detector, and the O concentration in the exposure chamber was maintained at X 0.02 ppm, while the control rats were exposed to 0 ppm clean air.
Random blood glucose and fasting blood glucose
Rats in the RBG and FBG detection groups normally ate during exposure. The operation method of the blood glucose meter was the same as that of GTT. Rats in the RBG and FBG groups had their food removed after 22:00, and RBG was measured at 22:00. FBG was detected at 8:00 after exposure to ensure that the fasting time of the rats was more than 8 hours.
Glucose tolerance testing
GTT was conducted using a Roche blood glucose meter to measure blood glucose volume, and glucose dehydrogenase test paper was adopted for testing. In the GTT group, the rats fasted during the exposure period (8:00–14:00) and before the completion of GTT. At 16:00, GTT was conducted, and blood glucose concentration was assessed. The interval between GTT tests was greater than 18 hours of recovery. The test method was to puncture the distal surface of the tail with a sterile needle and obtain a 1 L blood sample from which to measure the blood glucose concentration. A Roche blood glucose meter was used to measure the blood glucose level with test paper, which requires 0.6 L of whole blood. After the first measurement, rats were given an intraperitoneal injection of glucose solution at 2 g/kg/10 ml (20% D-glucose; 10 ml/kg) [15, 16]. Measurements with a glucose meter were repeated every 30 min for 2 h, 5 times over 2 h. In this group of experimental rats, GTT was performed on Day 1, Day 3, and Day 6 of O exposure to obtain acute exposure data.
Statistical analysis
SPSS 26.0 software was used to establish a database for the statistical processing and analysis of all detected sample data. When the sample data was normally distributed, measurement data were expressed as mean standard deviation (X s). Independent sample -test was used to comparison among multiple samples, one-way ANOVA is used to compare multiple samples, LSD (L) test and Tamhane T2 (M) test are used, and 0.05 is considered statistically significant. GraphPad Prism 8.03 software is used to plot sample data.
Results
General conditions of rats after exposure
No death occurred during the exposure period. The rats gained weight with the extension of the exposure time, but the weight gain was not statistically significant.
Fasting blood glucose and random blood glucose results
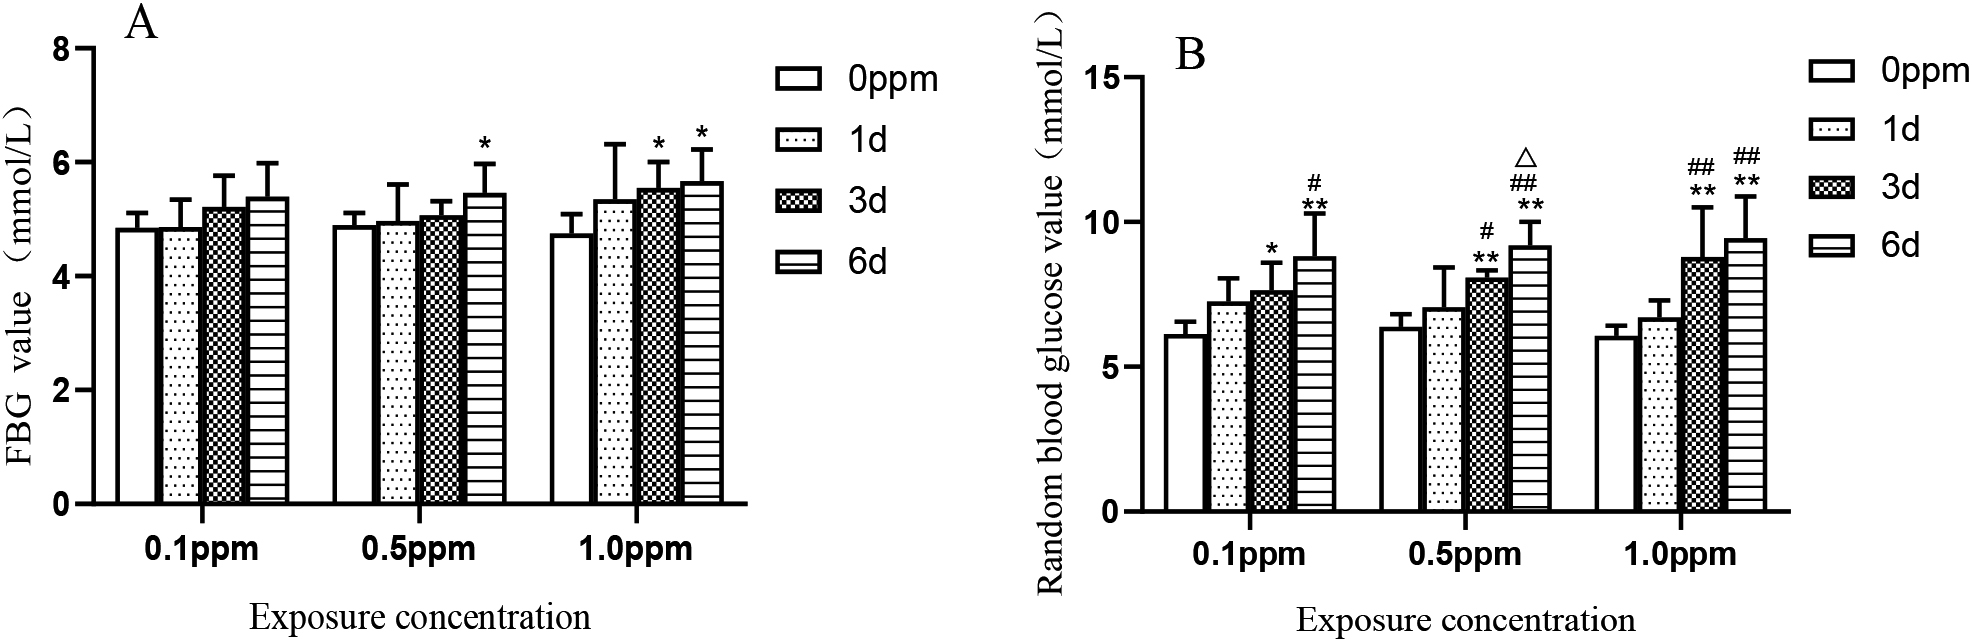
FBG detection results are shown in Fig. 1A. Compared with the control group, the FBG detection values at 1 day, 3 days and 6 days after exposure to 0.1 ppm concentration had no statistical significance. At a concentration of 0.5 ppm, the blood glucose value on the sixth day was significantly higher than that of the control group ( 0.037). At a concentration of 1.0 ppm, the blood glucose values on the third and sixth days were significantly higher than those in the control group ( 0.039, 0.02). RBG was detected in rats under normal diet and water intake. The specific results are shown in Fig. 1B. At a concentration of 0.1 ppm, the blood glucose values on the third and sixth days were substantially higher than those in the control group ( 0.015, 0.001). The blood glucose value on the sixth day was significantly higher than that on the 1st day ( 0.013). At a concentration of 0.5 ppm, the blood glucose values on the third and sixth days were significantly higher than those in the control group ( 0.002, 0.001), considerably higher than those on the first day ( 0.046, 0.001), and the blood glucose values on the sixth day were significantly lower than those on the third day ( 0.032). At a concentration of 1.0 ppm, the blood glucose values on the third and sixth days were significantly higher than those in the control group ( 0.001, 0.001), and the blood glucose values on the third and sixth days were significantly higher than those on the first day ( 0.006, 0.001)
FBG and RBG values at 0.1 ppm, 0.5 ppm, and 1.0 ppm O exposure for 1, 3 and, 6 days. The values in the bar graphs are shown as mean SE ( 10); 0.05 compared with the control group, 0.01 compared with the control group, 0.05 compared with the blood glucose value on the first day, 0.01 compared with the blood glucose value on the first day, 0.05 compared with the blood glucose value on the third day and 0.01 compared with the blood glucose value on the third day.
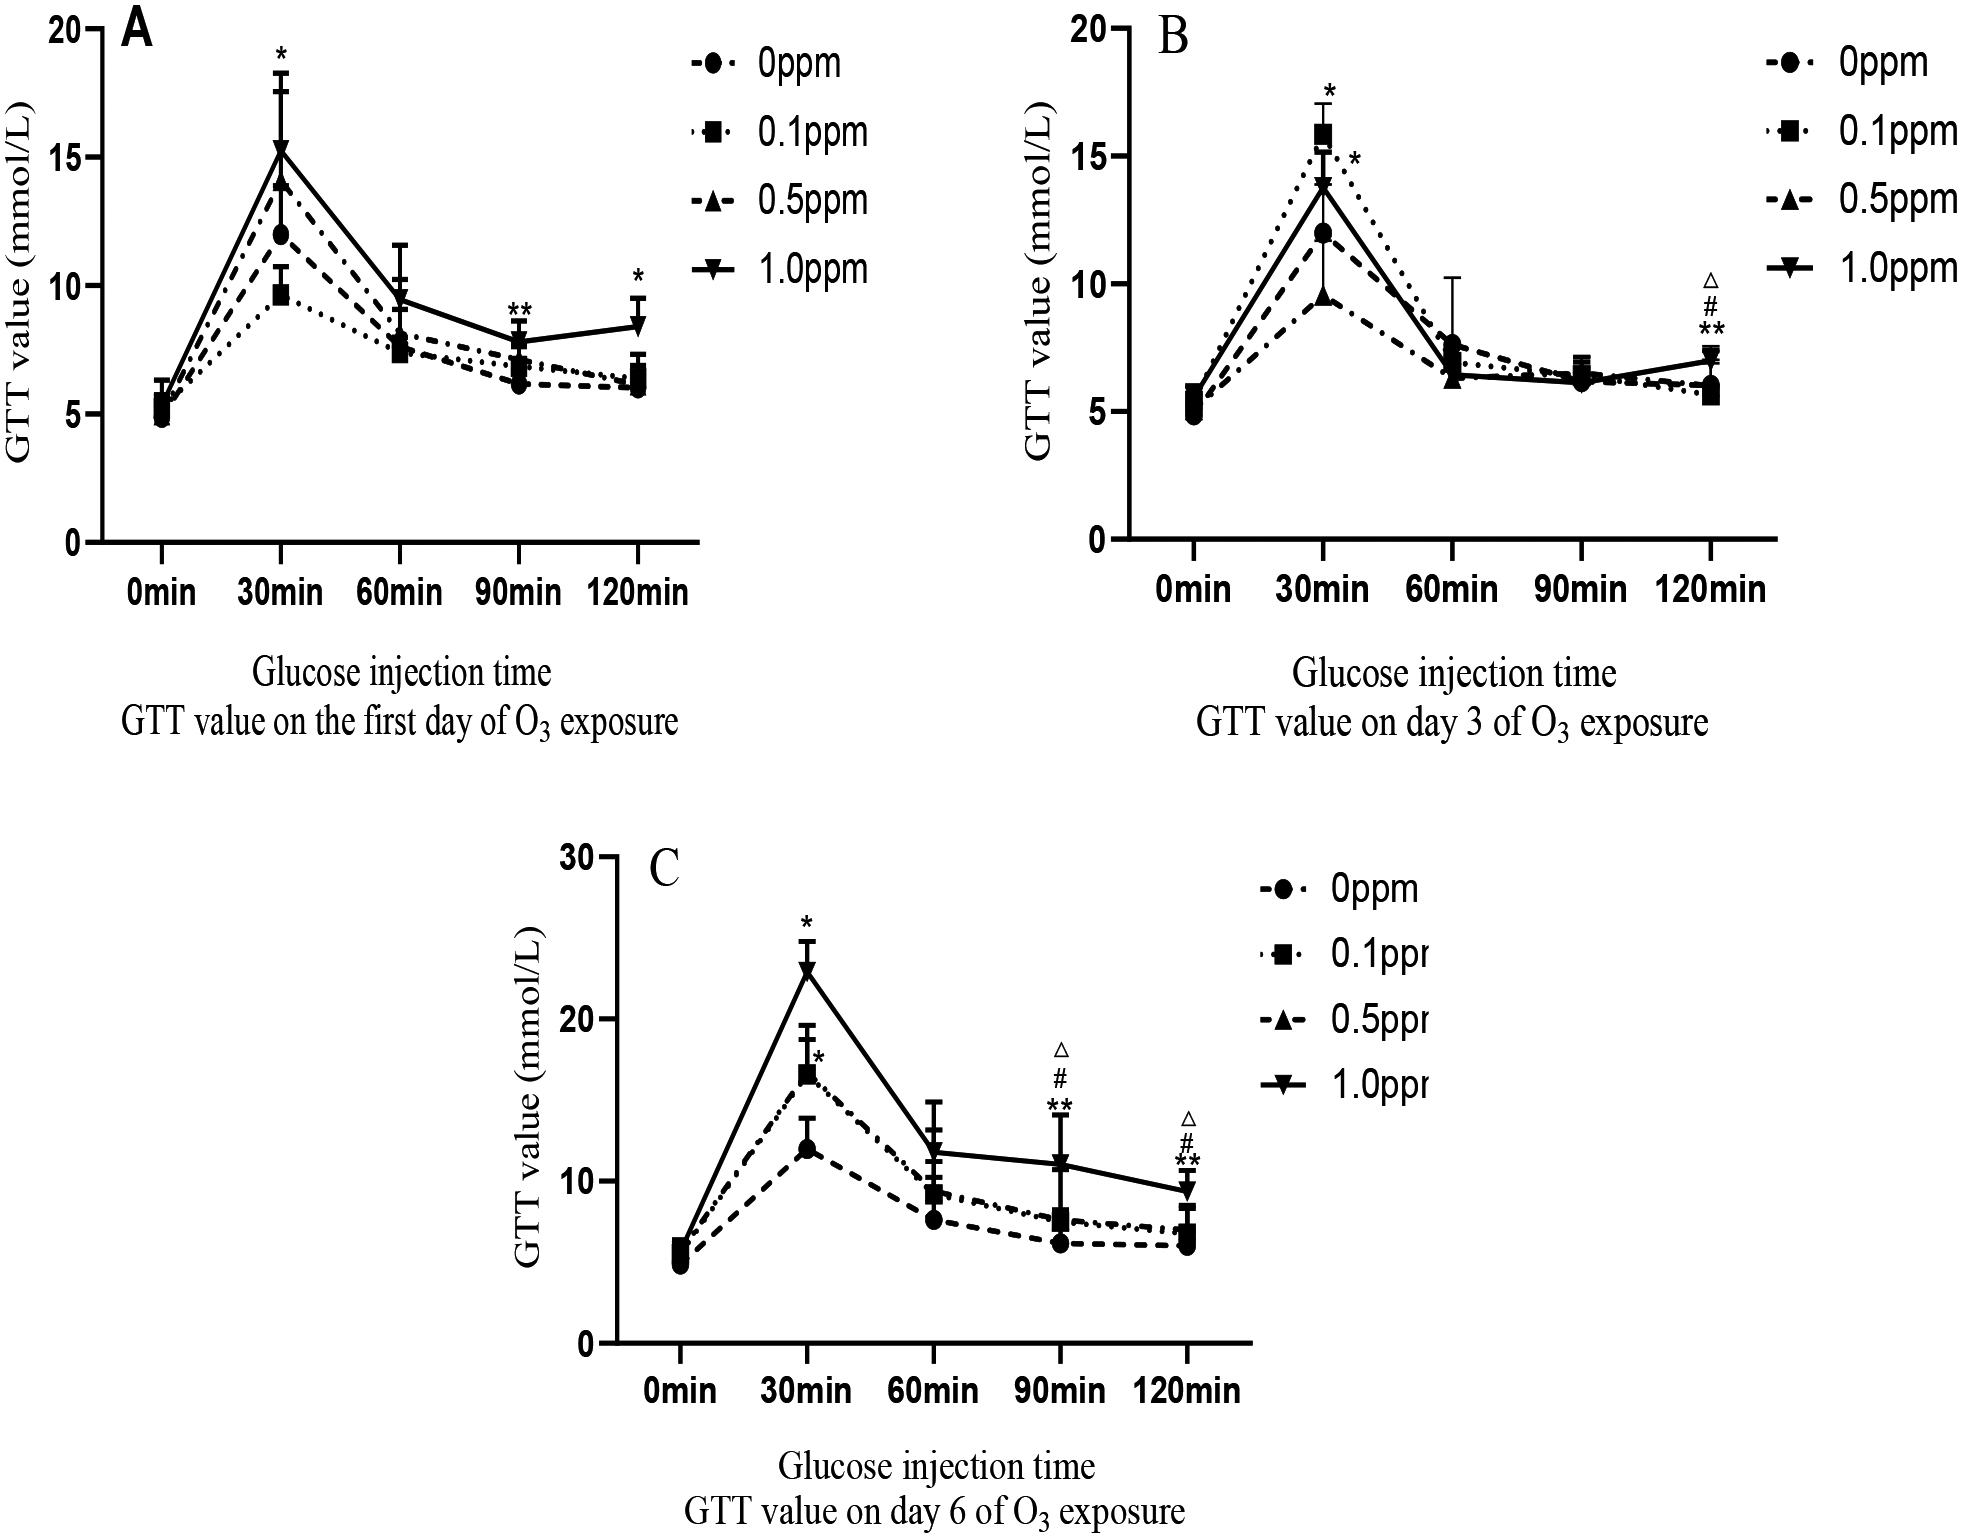
GTT values at 0.1 ppm, 0.5 ppm, and 1.0 ppm O exposure for 1, 3 and, 6 days. The values in the graphs are shown as mean SE ( 10); 0.05 compared with the control group, 0.01 compared with the control group, 0.05 compared with the 0.1 ppm concentration group, 0.01 compared with the 0.1 ppm concentration group, 0.05 compared with the 0.5 ppm concentration group and 0.01 compared with the 0.5 ppm concentration group.
GTT results
In the GTT group, rats exposed to 0.1, 0.5, and 1.0 ppm of O for 1, 3, and, 6 days showed a positive correlation. As shown in Fig. 2A, the GTT value after exposure on the first day increased with the increase of O exposure concentration. The specific results are as follows: at 30 minutes, 90 minutes and, 120 minutes of GTT, the concentration of 1.0 ppm was significantly higher than that of the control group ( 0.05). Figure 2B shows GTT on the third day: at 30 min, the exposure concentrations of 0.5 ppm and 1.0 ppm were significantly higher than those of the control group ( 0.05); and at 120 min, the value of the 1.0 ppm group was substantially higher than that of the control group, 0.1 ppm and 0.5 ppm groups ( 0.05). Figure 2C shows GTT on the sixth day: at 30 min, the values of the 0.5 ppm and 1.0 ppm groups were significantly higher than those of the control group ( 0.035, 0.029); at 60 min, the value of the 1.0 ppm group was significantly higher than that of the control group ( 0.023); and at 90 min and 120 min, the GTT values of the 1.0 ppm group were significantly higher than those of control group, 0.1 ppm group and 0.5 ppm group ( 0.05).
Discussion
In this experiment, rats were exposed to three different O concentrations for different duration, causing different effects on the FBG, RBG, and GTT values in rats. These blood glucose values can serve as important reference data for clinical diagnosis of T2DM, especially GTT 120 min and FBG. The increase in FBG can be taken as a sensitive indicator of pre-diabetes and general diabetes [17]. In humans, GTT is used in toxicological studies to assess the ability of the regulatory mechanisms to determine blood glucose concentrations, providing a physiological overview of changes in glucose tolerance [18]. The results of this experiment showed that O effected all the above blood glucose values. The blood glucose used in the experiment was rat tail venous blood detected by a rapid blood glucose detector. The experiment proved that there was no difference in the blood glucose value of rats detected by a rapid blood glucose meter and a biochemical meter [19]. The global prevalence of T2DM has risen dramatically in recent decades, with the International Diabetes Federation estimating that at least 415 million people aged 20 and 79 years had diabetes in 2015. That number is expected to rise to 642 million by 2040. China also has the largest number of diabetics in the world [20]. The etiology and pathogenesis of T2DM are not yet fully understood. Epidemiological and environmental toxicological studies have shown that O exposure can increase IR and the prevalence of T2DM. Research has also shown that short-term O exposure is positively correlated with FBG, insulin, HOMA-IR, and islet -cell secretory function index (HOMA-B) [17]. Bass et al. [15] exposed rats of 1, 4, 12 and, 24 months to 0.25 ppm and 1.0 ppm O, the experiment showed that acute O exposure in rats of all months of age resulted in increased FBG and decreased glucose tolerance. Liu et al. [14] found that the increase in O exposure concentration was positively correlated with the increase of FBG level and risk of T2DM. When the mixed exposure effects of PM, PM, or NO were constructed in a dual-pollution model and combined with the region, temperature and relative humidity, the results of O exposure and T2DM and FBG were basically unchanged. These results indicate that O exposure as an independent factor effects blood glucose metabolism. Desinia [21] exposed Wistar rats to 0.25, 0.5, and 1.0 ppm O for GTT over two days. Both the 0.5 and 1.0 ppm test groups showed elevated blood glucose and abnormal blood glucose tolerance, while the 0.25 ppm group did not experience hyperglycemia or abnormal blood glucose tolerance. Some studies have shown that no significant changes in glucose tolerance or FBG were observed in any study group when exposed to 0.25 ppm O [18]. In our experiment, the 120 min mean values of FBG, RBG and GTT were significantly increased on different days across the three concentration exposure groups. Although they did not exceed the Wistar rat model T2DM venous blood glucose limit of more than 16.7 mmol/l, they exceeded the normal value of rat venous blood glucose (5.8 0.5 mmol/l) [19]. In addition, the higher the concentration, the more obvious the increase in blood glucose value. It can be seen that the effects of acute O exposure on blood glucose are concentration-dependent. Some scholars have carried out relevant research, showing that the effects of O exposure below 0.25 ppm on the blood glucose of rats are mild, but impaired glucose tolerance can be observed after long-term low-concentration O exposure [22]. The experimental results of this paper show that the RBG and FBG levels of Wistar rats exposed to 0.1 ppm, 0.5 ppm and, 1.0 ppm concentrations for 1 day, 3 days and 6 days were significantly higher than those of the control group, and increased with the extension of the exposure time. However, the blood glucose values of GTT at the concentration of 0.1 ppm for 1 day, 3 days and 6 days did not significantly increase compared with the control group, and the blood glucose values of GTT at 90 min and 120 min on each exposure day at the concentration of 0.5 ppm did not significantly increase compared with the control group. The three exposure concentrations in this experiment can cause significant increases in FBG and RBG, and only the change in the GTT blood glucose value of Wistar rats at 1 ppm exposure concentration was statistically significant.
The mechanism of O exposure causing changes in blood glucose levels and T2DM is still not fully understood. Many researchers have proposed a number of possible pathways, chiefly pulmonary and systemic inflammatory reactions. After exposure to environmental pollution, the release of inflammatory mediators from the lungs into the circulatory system increases [23]. O exposure can cause changes in inflammatory factors and lung tissue injury [24]. Studies have shown that tumor necrosis factor (TNF)- and Interleukin (IL)-6 enter the systemic circulation and act on target tissues or organs, mainly the liver, muscles, and fat, which are sensitive to insulin [25]. Inflammatory factors are widely involved in the regulation of blood glucose, lipid and energy metabolism in the body, causing a chronic low-grade inflammatory reaction that leads to the damage of the insulin signaling pathway and the decrease of the body’s glucose utilization efficiency, in turn leading to the occurrence of IR [26]. Among the various possible causes of elevated blood glucose and IR induced by O, most researchers believe that inflammatory reaction/lung injury may be the center of the biological mechanism associated with elevated blood glucose induced by O [27]. Ying et al. [28] exposed KKAy rats to O at 0.5 ppm for 13 consecutive working days, and the results confirmed that plasma TNF-A as well as the expression of VCAM-1, iNOS, and IL-6 in lungs and adipose tissue were increased; the number of proinflammatory CD11 macrophages was increased by 200% in adipose tissue, and fasting plasma insulin level and HOMA-IR were significantly decreased. Second, O induces oxidative stress and endoplasmic reticulum stress to increase the body’s blood glucose level. Vella et al. [29] exposed rats to O at a concentration of 0.8 ppm and found that the concentrations of FBG and insulin in rats were significantly increased; the concentrations of oxidative stress biomarkers 4-hydroxy-2-nonenal (HNE), 4-hydroxy-2-hexenal (HHE) and malondialdehyde (MDA) in the blood and bronchoalveolar lavage fluid (BALF) of the rats were increased; the concentrations of protein carbonyl groups in lungs was increased; the ratio of GSH/GSSG in the red blood cells was decreased; and the expression of the endoplasmic reticulum stress protein gene in the muscle was increased. O exposure induces a rise in blood glucose caused by nerve reflexes in the lungs and brain, and activates the stress response regions in the nucleus tractus lonsus (NTS) and hypothalamus by stimulating the C fibers of the pulmonary vagus nerve [30]. Acute O exposure increases the level of stress hormones in the circulation, such as adrenaline and corticosterone [31, 21]. O exposure also leads to cardiac autonomic effects, hypothermia, and bradycardia in rats [32], as well as hyperglycemia, glucose tolerance and systemic changes in circulating metabolites related to peripheral glucose, fat, and amino acid metabolism in rats [21]. These changes reflect classic stress-mediated changes in homeostasis, including the activation of sympathetic neurons and the hypothalamic-pituitary-adrenal (HPA) axis [21]. Acute O exposure increases the serum corticosterone of rats, which is a sign of HPA axis activation. Miller [33] recruited 24 volunteers to expose them to 0.3 ppm concentration of O. The research showed that the serum samples collected after O exposure showed significantly increased cortisol and corticosterone compared with the air group. Thomson et al. [31] exposed rats to O at concentrations of 0.4 ppm and 0.8 ppm, the results showed that the plasma levels of corticotrophin and glucocorticoid in the plasma were increased, especially for O at 0.8 ppm. Bass [15] showed that adrenalin, a neurohumoral regulator of the sympathetic nervous system, was significantly increased in serum on the second day after exposure to 1 ppm O. Finally, O exposure causes changes in lipid metabolism and increases blood glucose. Miller [21] conducted an O exposure experiment on Wistar Kyoto rats, showing that O exposure can increase the glycolytic cycle metabolite, long-chain free fatty acids, and branched-chain amino acids, and reduce the circulating metabolite of 1,5-anhydrous sugar alcohol, bile acid and tricarboxylic acid (TCA). It can be seen that O exposure interferes with the normal glycogen synthesis and glycolytic pathway of the body. The increase of lipid and protein catabolic residual products in the circulation may play a role in peripheral IR. Vella et al. [29] also found that O exposure led to the increase of lipid and protein oxidation residual products in the BALF and serum, and these residual products increased muscle IR.
The concentrations of O used in this experiment were 0.1 ppm, 0.5 ppm and, 1.0 ppm, which are higher than the allowable occupational health limits stipulated by the state. However, studies have shown that mice need three to four times the amount of O to obtain the same amount of O as humans [34]. Therefore, the concentration of O used in our study to simulate the impact of acute O exposure on human blood glucose metabolism basically conforms to the exposure concentration of O in some actual jobs and environments. The exposure concentrations of the three groups in this experiment caused the rise of FBG and RBG in the body with the extension of the exposure time. The concentration of 1.0 ppm can cause the rise of the GTT blood glucose value by 120 min on the third and sixth days. O exposure has different effects on blood glucose levels, providing data references for further exploring the etiology and pathogenesis of T2MD. To prevent the effects of O exposure on the body’s blood glucose level, it is necessary to reduce the time and concentration of occupational O exposure, and strengthen exercise activities. Studies have shown that the glucose tolerance of sedentary rats will be impaired after O exposure [16]. Physical activity may be effective in reducing the burden of high FBG caused by T2DM and O exposure [14].
Conclusion
In this experiment, rats were exposed to O at different concentrations and times to detect FBG, RBG and GTT. Each exposure concentration and time induced elevated FBG and, RBG, and the exposure time had a cumulative effect on the elevated blood glucose level. At concentrations of 0.5 ppm and 1.0 ppm, the blood glucose of GTT was significantly affected. The results of this experiment provide data to support the hypothesis that O exposure increases the blood glucose level of the body. As the prevention of chronic noncommunicable diseases is better than treatment, the impact of our research on public health provides scientific evidence of the potentially harmful effects of O air pollution on blood glucose metabolism and the health of people. This experiment lacks the study of O on the mechanism of insulin tolerance and elevated blood glucose.
Footnotes
Conflict of interest
None to report.
References
1.
ZhuDWanWLiuJXueTGongJCZhangSQ. Interpretation of the revision of the WHO “Global Air Quality Guidelines.”Chinese Science Bulletin.2022; 67(8): 697-706.
2.
Ministry of Environmental Protection of the People’s Republic of China. GB 3095-2012 “Ambient Air Quality Standards.” Beijing: China Environmental Science Press. 2012; 3.
3.
General Administration of Quality Supervision, Inspection and Quarantine of the People’s Republic of China, Ministry of Health. GB/T18883-2002 “Indoor air quality standard.” Beijing: Standards Press of China. 2002; 2.
4.
LyuLZLiYOuXXGuoWQZhangYDuanSM, et al. Health effects of occupational exposure to printer emissions on workers in China: Cardiopulmonary function change. NanoImpact.2021; 21: 100289.
5.
PanXKGaoYXWangDJ, et al. Emission characteristics of pollutants from indoor laser printers. Environmental and Occupational Medicine.2017; 34(11): 953-957.
6.
WangXHJiaSLZhaiLJ, et al. Study on hazards of ozone and nitrogen oxides in photocopying workplaces. Chinese Journal of Preventive Medicine.2001; 2(3): 201-204.
7.
FengLYZhangHWZhengCMLiYLiuJ, et al. Investigation on the chemical factors of occupational disease hazards in horse racing enterprises in the areas without specified equine animal epidemics. Occupation and Health.2020; 36(13): 1736-1740.
8.
MaJWChenZXWangJWangYLiL, et al. Diffusion simulation, health risks, ozone and secondary organic aerosol formation potential of gaseous pollutants from rural comprehensive waste treatment plant. Chemosphere.2022; 286(3): 131857.
9.
GuoQHNiuXH. Investigation and evaluation of occupational health in a metal component factory. Occupational Health and Emergency Rescue.2014; 32(4): 243-244.
10.
ZhaoXSunZRuanYYanJMukherjeeBYangF, et al. Personal black carbon exposure influences ambulatory blood pressure: Air pollution and cardiometabolic disease (AIRCMD-China) study. Hypertension.2014; 63(4): 871-878.
11.
LiYLChuangTWChangPYLinLYSuCTChienLN, et al. Long-term exposure to ozone and sulfur dioxide increases the incidence of type 2 diabetes mellitus among aged 30 to 50 adult population. Environ Res.2021; 194: 110624.
12.
PaulLABurnettRTKwongJCHystadPvan DonkelaarABaiL, et al. The impact of air pollution on the incidence of diabetes and survival among prevalent diabetes cases. Environ Int.2020; 134: 105333.
13.
HernandezAMRuizGde PorrasDMarkoDWhitworthKW, et al. The association between PM2.5 and ozone and the prevalence of diabetes mellitus in the United States, 2002 to 2008. J Occup Environ Med.2018; 60(7): 594-602.
14.
LiuXTDongXKSongXQLiRYHeYLHouJMaoZXHuoWQ, et al. Physical activity attenuated the association of ambient ozone with type 2 diabetes mellitus and fasting blood glucose among rural Chinese population. Environmental Science and Pollution Research. 2022. doi: 10.1007/s11356-022-22076-y.
15.
BassVGordonCJJaremaKAMacphailRCCascioWEPhillipsPMLedbetterAD, et al. Ozone induces glucose intolerance and systemic metabolic effects in young and aged brown Norway rats. Toxicol Appl Pharmacol.2013; 273: 551-560.
16.
GordonCJPhillipsPMLedbetterASnowSJSchladweilerMC, et al. Active vs. sedentary lifestyle from weaning to adulthood and susceptibility to ozone in rats. Am J Physiol Lung Cell Mol Physiol.2017; 312(1): 100-109.
17.
LiAMeiYZhaoMXuJSeerySLiR et al. The effect of ambient ozone on glucose-homoeostasis: A prospective study of non-diabetic older adults in Beijing. Sci Total Environ.2021; 761: 143308.
18.
LaKindJSBurnsCJPottengerLHNaimanDQGoodmanJE, et al. Does ozone inhalation cause adverse metabolic effects in humans? A systematic review. Critical Reviews in Toxicology.2021; 51(6): 467-508. doi: 10.1080/10408444.2021.1965086.
19.
ZhangXXWuXLFuLZ, et al. Comparison of rapid glucose meter and biochemical meter in blood glucose test of normal rats and type 2 diabetic rats. World’s Latest Medical Information Digest.2018; 18: 84-86.
20.
OgurtsovaKHuangYLinnenkampUGuariguataLChoNH, et al. IDF Diabetes Atlas: Global estimates for the prevalence of diabetes for 2015 and 2040. Diabetes Res Clin Pract.2017; 128: 40-50.
21.
MillerDBKarolyEDJonesJC, et al. Inhaled ozone (O3)-induces changes in serum metabolomic and liver transcriptomic profiles in rats. Oxicology and Applied Pharmacology.2015; 286(2): 65-79.
22.
MillerDBSnowSJHenriquezASchladweilerMCLedbetterADRichardsJE, et al. Systemic metabolic derangement, pulmonary effects, and insulin insufficiency following subchronic ozone exposure in rats. Toxicol Appl Pharmacol.2016; 306(24): 47-57.
23.
DelfinoRJStaimerNTjoaTPolidoriAArhamiM, et al. Circulating biomarkers of inflammation, antioxidant activity, and platelet activation are associated with primary combustion aerosols in subjects with coronary artery disease. Environ. Health Perspect.2008; 116(5): 898-906.
24.
BaoALiangLLiF, et al. Effects of acute ozone exposure on lung peak allergic inflammation of mice. Frontiers in Bioscience.2013; 18(9): 838-851.
25.
JiangLQDuque-GuimaraesDEMachadoUF, et al. Altered response of skeletal muscle to IL-6 in type 2 diabetic patients. Diabetes.2013; 62(2): 355-361.
26.
KewalRGBilanPJKlipA. Muscle insulin resistance: Assault by lipids, cytokines and local macrophages. Curr Opin Clin Nutr Metab Care.2010; 13(4): 382-390.
27.
AlvarezHAOKubzanskyLDCarnpenMJSlavichGM. Early life stress, air pollution, inflammation, and disease: An integrative review and immunologic model of social-environmental adversity and lifespan health. Neurosci Biobehav Rev.2018; 92: 226-242.
28.
YingZAllenKZhongJChenMWilliamsKMWagnerJG, et al. Subacute inhalation exposure to ozone induces systemic inflammation but not insulin resistance in a diabetic mouse model. Inhalation Toxicology.2016; 28(4): 155-163.
29.
VellaREPillonNJZarroukiBCrozeMLKoppeLGuichardantM, et al. Ozone exposure triggers insulin resistance through muscle c-Jun N-terminal kinase activation. Diabetes.2015; 64(3): 1011-1024.
30.
GackiereFSalibaLBaudeABoslerOStrubeC. Ozone inhalation activates stress-responsive regions of the CNS. Journal of Neurochemistry.2011; 117: 961-972.
31.
ThomsonEMVladisavljevicDMohottalageSKumarathasanPVincentR. Mapping acute systemic effects of inhaled particulate matter and ozone: Multiorgan gene expression and glucocorticoid activity. Toxicol Sci.2013; 135: 169-181.
32.
ArjomandiMWongHDondeAFrelingerJDaltonSChingWPowerKBalmesJR. Exposure to medium and high ambient levels of ozone causes adverse systemic inflammatory and cardiac autonomic effects. Am J Physiol Heart Circ Physiol.2015; 308(12): H1499-H1509.
33.
MillersDBGhioAJKarolyEDBellLNSnowSJMaddenMC, et al. Ozone exposure increases circulating stress hormones and lipid metabolites in humans. American Journal of Respiratory and Critical Care Medicine.2016; 193(12): 1382-1391.
34.
HatchGESladeRHarrisLPMcDonnellWFDevlinRB, et al. Ozone dose and effect in humans and rats. A comparison using oxygen-18 labeling and bronchoalveolar lavage. American Journal of Respiratory and Critical Care Medicine.1994; 150(3): 676-683.