
Abstract
BACKGROUND:
Understanding the mechanical properties of aortic tissue is essential for developing numerical computation tools and assessing the risk of aortic aneurysm fractures. Tensile tests using aortic wall specimens allow for the determination of stress and strain depending on the location and direction of the sample.
OBJECTIVE:
The aim of this study was to perform a mechanical tensile test using canine aorta samples and create a numerical model of aortic tissue tension from the processed data.
METHODS:
Dogbone-shaped samples were dissected from canine aortic segments. The initial measurements were made at zero tension and the tensile tests were conducted at 10 mm/min until rupture. Force and stretch data were used to obtain engineering and true stress-strain curves. The true stress-strain curves were taken until the maximum strength was obtained, after which they were smoothed and fitted using a logistic function with three coefficients. These curves were then used as material mechanical properties for a numerical model of the aortic tissue tension. A simplified rectangle form was used to mimic the middle of the dogbone-shaped portion of the tissue specimen. Experimental displacement data were collected for the boundary conditions of the finite element 3D model.
RESULTS:
The experimental data processing revealed that the logistic function described the nonlinear behaviour of the aorta soft tissue with an accuracy of 95% from the start of the tension to the media layer rupture. By applying numerical simulations, we obtained a correspondence of the load curve with an RMSE
CONCLUSION:
The numerical investigation confirmed that the non-linear soft tissue was validated by applying a logistic function approach to the mechanical properties of the aortic wall.
Introduction
According to the European Society of Cardiology, cardiovascular diseases are responsible for 45% of all deaths in Europe [1]. These diseases include ruptures and blockages of blood vessels and aortic ruptures, which have a mortality rate of approximately 90% [2] and are often caused by aortic dissection [3], aneurysms [4, 5] and atherosclerosis [5, 6]. The aorta is the main elastic artery which supplies oxygen-saturated blood to the entire body by expanding in the systole phase and recoiling in the diastole phase. The aortic wall is anatomically divided into three layers: the tunica intima, the tunica media and the tunica adventitia [7]. An understanding of the mechanical properties of the aortic wall is required to develop and improve diagnostic tools and assess rupture risk.
Tensile tests on thoracic aortic tissue can determine the respective mechanical properties in the circumferential and longitudinal directions. Uniaxial tests measure tissue behaviour in one direction [8], while biaxial tests allow simultaneous tensile tests in two directions [9]. The inflation tension test is a biaxial test that is used to simulate loading in vivo [10]. These tests allow researchers to assess differences in mechanical properties based on age, location, sample orientation [10] and pathological effects. The most common finding of these studies was increased stiffness and strength in the circumferential direction compared to the axial direction. Histological studies reveal that collagen fibres tend to align in the circumferential direction, suggesting that collagen is involved in tissue strength [11].
The behaviour of the stress-stain curve of the tissues of the aorta can be divided into five different stages: initial elastic modulus stage, physiological elastic modulus stage, maximum elastic modulus stage, yield strength stage and finally ultimate tensile strength [12]. When researchers investigate the mechanical movement of aorta tissues in the physiological elastic modulus stage, they can use polynomial, for example [13], logarithmic, for example [14], exponential [15, 16] constitutive laws of aorta tissues or some of the more sophisticated mixtures of them without [17] or with asymmetry [18, 19, 20] properties of biological tissues. All these models are developed for modelling of first four stages of stress-strain curve of stretching aorta wall. Therefore, these models can describe good mechanical behaviour of the aortic wall at least in the maximum elastic modulus stage but modelling of the yield strength and the condition of the maximum tensile strength is critical to understanding the process of rapture of the aortic wall.
Animal models such as swine, sheep, primates and large dogs have been used to simulate cardiovascular disease, study pathological occurrence processes and assess treatment and preventive actions [21]. We chose to investigate dog aortic tissue samples because canine models have been established for the study of aortic dissection and aneurysm [22, 23].
Materials and methods
Preparation of specimen collection experiment
The aortas (Fig. 1) of two dogs, which were obtained from the Vilnius College Veterinary Clinic, were dissected during their necropsies. The dogs were elderly, 25–30 kg in weight and had been euthanised. The dissected aortic segments were processed and surrounding fat tissues were separated and removed. The tissue samples were stored in saline in a refrigerator at
Specimen measurements at zero tension
Specimen measurements at zero tension
Two canine aortas obtained from necropsies.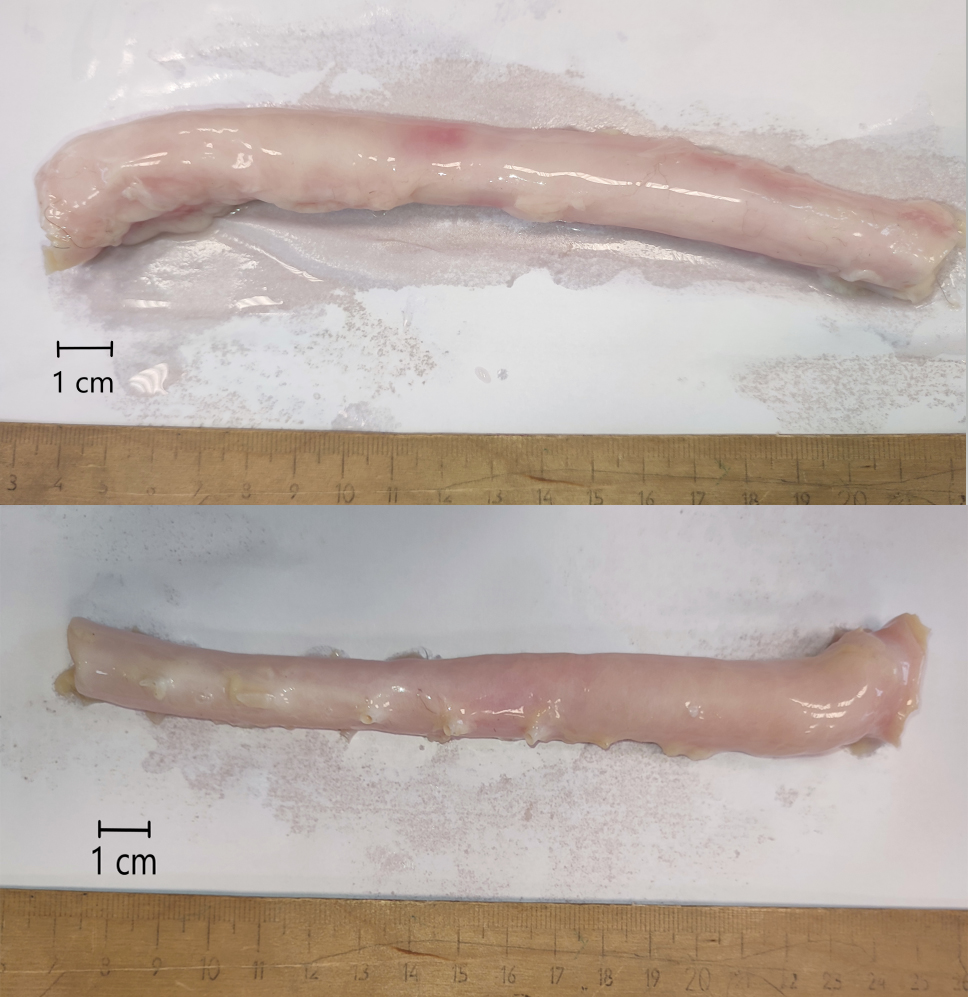
Tension tests were performed using a Mecmesin MultiTest 2.5-i test machine with an LSC-S 1000N load cell (Fig. 2). The force sensor (load sensor measurement error:
Mecmesin MultiTest 25-i test machine with LSC-S 1000N load cell and camera setup.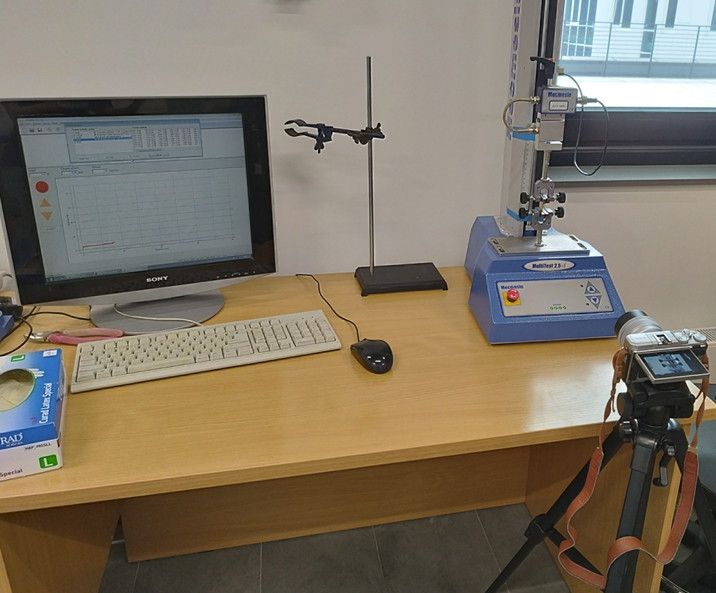
Dog-bone shaped aortic wall samples (scale in cm): A. LONGB, B. CIRCS, C. CIRCB and D. LONGS.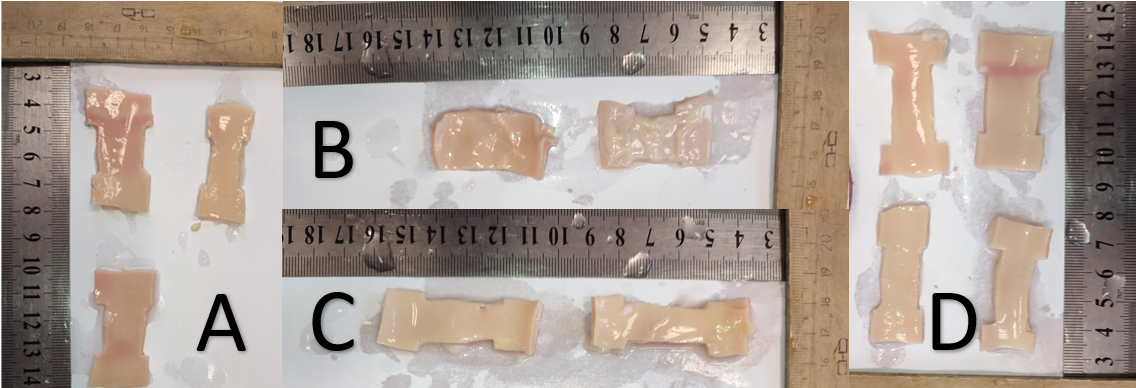
Force and stretch data were used to obtain engineering stress and strain curves for each specimen. Data processing was performed using the Matlab 2022b software [27]. Engineering stress was calculated as:
where
Engineering strain is the amount of material that deforms per unit of length in a tensile test. The engineering strain was calculated as:
where
True stress is the applied load divided by the actual cross-sectional area (A) of the material, which changes with time. True strain equals the natural log of the quotient of the current length over the original length for sequential deformations, with consideration of the influence of the deformation path. The assumption of arterial incompressibility implies a zero-volume change, and the true data can be related to the engineering data as follows [8]:
Where
Curve fitting
Stress-strain curve fitting was performed using the Curve Fitting toolbox of the Matlab software [28]. The curve was fit using the following logistic function with three coefficients:
The coefficients were calculated for each sample
Numerical simulation
Solidworks 2022 [29] software was used to model the tensile test and compare the load force results of the simulated and experimental data. The simplified rectangle form Fig. 3 was used to mimic the middle part of the dogbone-shaped sample. As boundary conditions, the true stress-strain fit curve, Poisson ratio (0.45) [30], material density (1080 kg/m
Ethical approval
All animal welfare and bioethical standards adhered to Regulation (EC) No 1069/2009 of the European Parliament and Council of 21 October 2009 and Regulation (EC) No 1774/2002 (Animal by-products Regulation) – 17 articles [32].
Results
Experiment data and results
Nine uniaxial tests were performed using samples taken from the longitudinal (
Curve fitting coefficients
Curve fitting coefficients
Simplified rectangle form for numerical simulation.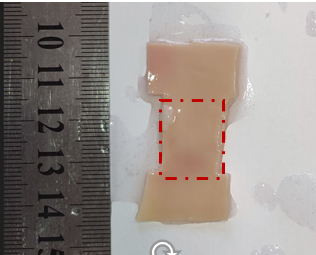
Engineering stress-strain curves of raw experimental data.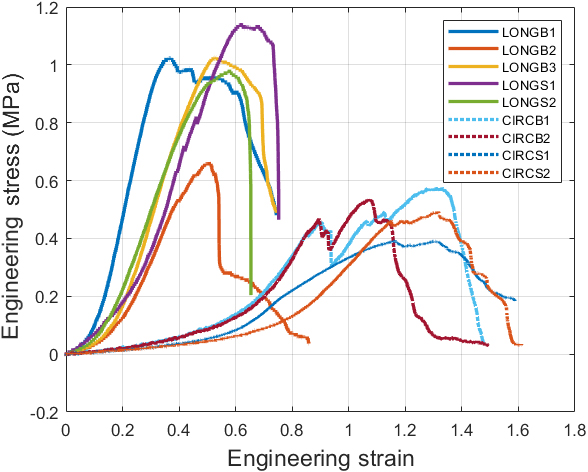
True stress-strain curves: Right – raw data until ultimate strength, left – smoothed data.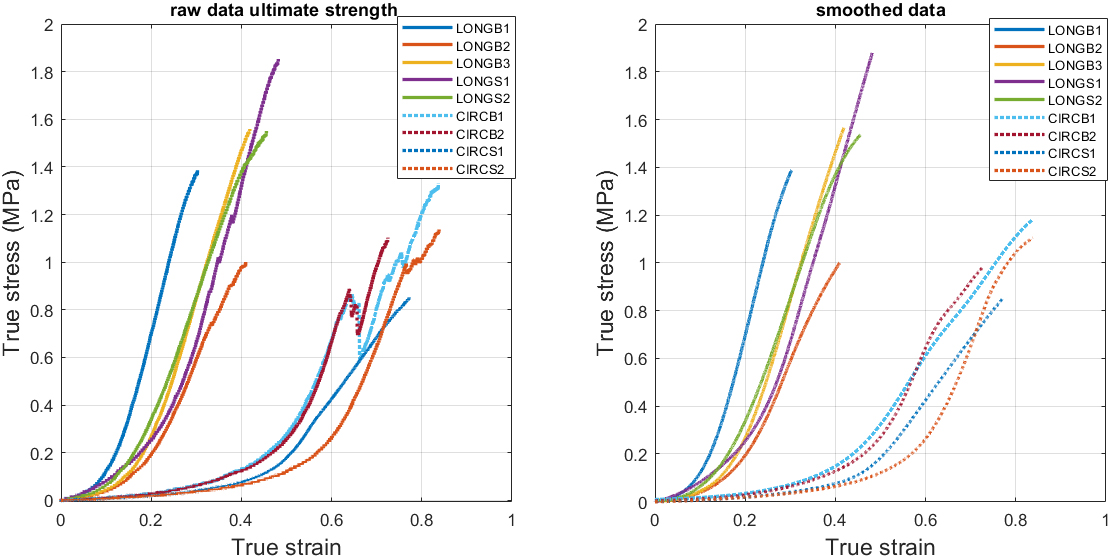
Engineering and true data comparison of one longitudinal sample.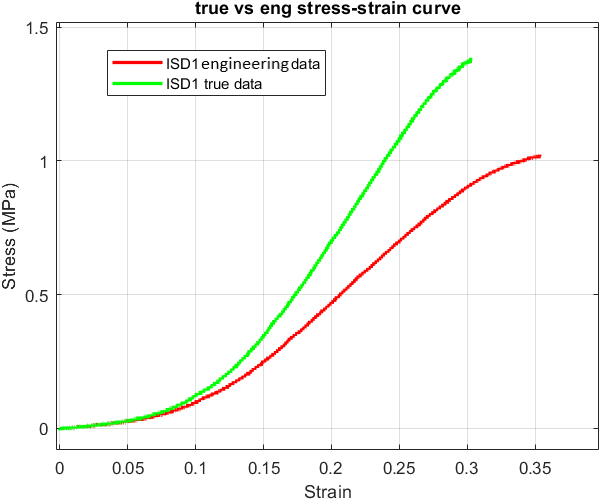
A. Von Mises stress, B. model displacement during numerical simulation.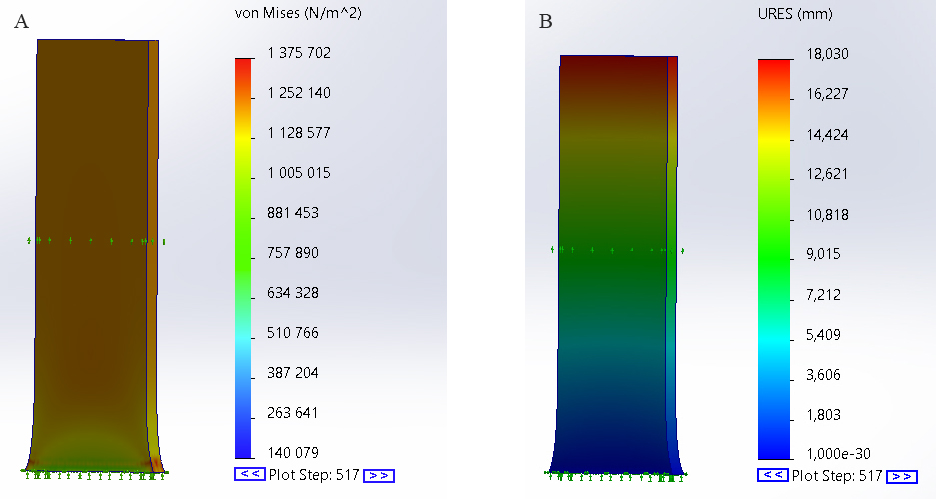
Reaction load force comparison between experimental data and numerical model.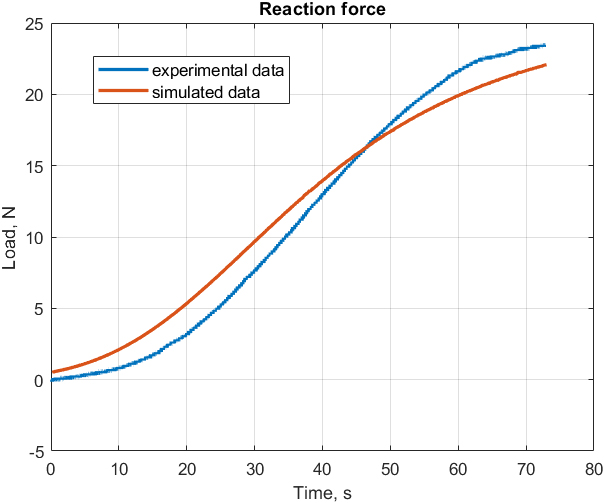
The results of the calculations are presented graphically using the constructed images. A nonlinear dynamic simulation was performed for a rectangular piece of the aortic wall using measurements obtained from the experimental data. During the study, stress and displacement plots were obtained for the aortic wall (Fig. 8A and B). The reaction force was measured at the non-fixed end of the sample and presented as a curve over time compared to the experimental load (Fig. 9). By applying a numerical simulation, we obtained a correspondence of the load curve with an RMSE
Discussion
This experimental study investigated longitudinal and circumferential deformation through an aortic wall model and evaluated the stress level until rupture by uniaxial tensile testing. Compared to the porcine aortic tensile test data of the adult pig ultimate tensile strength elastic modulus (9.42
The experimental measurements obtained were then used to fit the material parameters to the known function curve, and the logistic function described the nonlinear behaviour of the aorta soft tissue with an accuracy of 95%. Our fitted curves show the process from the start of tension to the extreme value of a layer, whereas exponential [35], linear [8] or polynomial fittings [10] have stress-strain curve fitting ranges which are smaller.
Limitations
There were certain limitations of the current study that should be noted. The data presented in this study were obtained using a small number of samples of the canine aortic wall samples; thus, an analysis of variance was performed to estimate the error limits of the properties. Eleven specimens were prepared, but due to severe slippage of the specimens in the metal grips and tears at the gripping point, two datasets were excluded from final analysis. Also, the video recording was made from a single angle which allowed one to track the elongation of the specimen, but did not allow to capture the rupture process of different layers of the aorta from different sides. The limitation of the theoretical simulation was description of the sample material as a whole without separating the aortic wall into layers, i.e. assigning common parameters for the wall, neither assigning to each layer its properties, will give closer results to the real biological material.
We recognise that the use of canine aortas is an important limitation of this study; however, canine aortas were preferred over porcine samples because of the challenges associated with obtaining a sample from an elderly pig that lives an active life. Animal aortas are used regularly in cardiovascular studies [36] because their mechanical properties and structures are comparable to those of humans [37] and samples are more accessible than those of human cadavers.
Conclusions
An experimental protocol was established. The preparation and storage methods for aortic tissue as well as the equipment used, presentation and processing methods of the results of the tensile experiment were analysed based on the scientific literature. During the experiment, engineering and true stress-strain curves were calculated, and curve fitting was performed using the logistic function with an accuracy of 95%. The processing of tensile experiment data revealed that the maximum stress was greater in the longitudinal than the circumferential direction, whereas strain was higher in the circumferential tensile direction. Validation of the experiment was conducted by the numerical modelling of a nonlinear dynamic problem. The load force curves of the experiment and the numerical model were compared. We obtained a correspondence of the tension force with an RMSE This study shows that the stress-strain curves of aortic tissue can be fitted using a function with three coefficients, thereby providing a detailed description of the non-linearity of the material.
Footnotes
Conflict of interest
None to report.