
Abstract
BACKGROUND:
Coronary heart disease (CHD) is the first cause of death globally. Hypertension is considered to be the most important independent risk factor for CHD. Early and accurate diagnosis of CHD in patients with hypertension can plays a significant role in reducing the risk and harm of hypertension combined with CHD.
OBJECTIVE:
To propose a non-invasive method for early diagnosis of coronary heart disease according to tongue image features with the help of machine learning techniques.
METHODS:
We collected standard tongue images and extract features by Diagnosis Analysis System (TDAS) and ResNet-50. On the basis of these tongue features, a common machine learning method is used to customize the non-invasive CHD diagnosis algorithm based on tongue image.
RESULTS:
Based on feature fusion, our algorithm has good performance. The results showed that the XGBoost model with fused features had the best performance with accuracy of 0.869, the AUC of 0.957, the AUPR of 0.961, the precision of 0.926, the recall of 0.806, and the F1-score of 0.862.
CONCLUSION:
We provide a feasible, convenient, and non-invasive method for the diagnosis and large-scale screening of CHD. Tongue image information is a possible effective marker for the diagnosis of CHD.
Introduction
According to a report released in 2020 by the International Collaborative Research on the Global Burden of Disease, coronary heart disease (CHD) is the number one cause of death worldwide, seriously endangering human life and health [1]. Hypertension is recognized as the most important independent risk factor for CHD and currently affects over 1.25 billion people worldwide [2, 3]. Studies have shown that the prevalence of hypertension in patients with stable CHD is as high as 60%, and the risk of cardiovascular death is significantly increased when the two diseases coexist [4, 5]. Early screening and diagnosis of CHD in hypertension patients are essential to reduce the risk and harm caused by the comorbidity of these two diseases. However, it is still an unsolved issue to find a suitable method for extensive screening and diagnosis of CHD in patients with hypertension [6].
Currently, the conventional methods used in the clinical diagnosis of CHD include biochemical blood indicators, electrocardiogram, cardiac stress test, computed tomography angiography (CTA), and coronary angiography (CAG). Among them, CAG is considered to be the “gold standard” for the clinical diagnosis of CHD [7]. However, as an invasive examination, CAG is taken with surgical procedures which may cause inconvenience and risks for patients, and also has high examination cost. There is a dilemma in the early diagnosis of CHD at this stage: although in-depth examination is essential for accurate diagnosis, it is troublesome and causes unnecessary cost in medical resources. Therefore, there is an urgent need for a sensitive, non-invasive, convenient, and low-cost diagnostic technology to supplement diagnostic gaps in large-scale CHD screening [8].
Previous research suggests that the tongue may have diagnostic value for CHD [9]. Tongue diagnosis is an important part of traditional Chinese medicine (TCM). As a terminal human organ, the tongue closely relates to the circulatory system, but its possible predictive value for CHD has been consistently ignored. The tongue’s color, shape, and coating contain much physiological and pathological information [10]. Studies have shown that diagnosing diseases through tongue features is effective [11, 12]. Although the tongue has such crucial diagnostic value, the relationship between the changes in tongue images and CHD and the value of tongue images in the diagnosis and screening of CHD has not yet been studied. which is exactly what we want to explore.
Given that tongue imaging is a non-invasive and low-cost diagnostic tool that is well-suited for large-scale screening, we conducted a prospective clinical study to further evaluate the value and stability of tongue imaging in the diagnosis of CHD. In recent years, the continuous development of tongue image research and analysis techniques has provided a foundation for our study [13], allowing us to observe the features of the tongue and objectively describe it. At the same time, the rapid development of artificial intelligence (AI) has provided tremendous assistance for screening, diagnosing, and treating various diseases. As the core AI method, machine learning has been widely used in the medical field [14, 15, 16]. Traditional machine learning technology has good performance in mining structured feature data of tongue images, whereas deep learning is a subfield of machine learning that can mine richer semantic information. Deep learning technology can learn valuable features of the original images for classification tasks through training [17, 18]. Although the use of AI to assist in the diagnosis of cardiovascular diseases has been increasingly studied by scholars [19, 20], a tongue-based diagnostic model for CHD has never been established.
In this study, we used the TFDA-1 tongue diagnosis instrument to collect standardized tongue images and studied the non-linear relationship between the features of the tongue and CHD. Tongue Diagnosis Analysis System (TDAS) was used to extract features of the tongue image, including color, texture, and coating area. We applied ResNet-50 as the deep learning backbone to extract deep features with neural networks, and used XGBoost to achieve the two features’ fusion, which led to a customized algorithm for diagnosing CHD in patients with hypertension. This study revealed the reference value of the tongue image on CHD diagnosis and explored a new method for non-invasive diagnosis of CHD.
Materials and methods
Data sources
The data was from March 2019 to September 2019, a total of 360 participants with a clinical diagnosis of hypertension were recruited, including 125 patients without CHD and 235 patients with CHD (Table 1). Written informed consent was obtained from all participants prior to inclusion. Using the random seed number of 0, 80% of the data was selected as the training set and the remaining 20% was the test set.
Basic information of participants
Basic information of participants
According to the experimental procedure, we trained a group of professionals to take tongue images of participants in a standard posture. The tongue image acquisition equipment was TFDA-1 (Fig. 1), and the tongue images were collected 2 hours after meals. The participants were asked to sit down in front of the instrument, be relaxed, place their chin on the support platform, and straighten the tongue to make it flatten naturally. We took a total of 2 tongue images for each participant. The quality of photos was controlled by removing those with fogging, low resolution, staining of tongue coating, overexposure, and abnormal tongue shapes.
The tongue diagnosis instrument. 1: lens hood, 2: ring light source, 3: camera lens, 4: mandible support plate.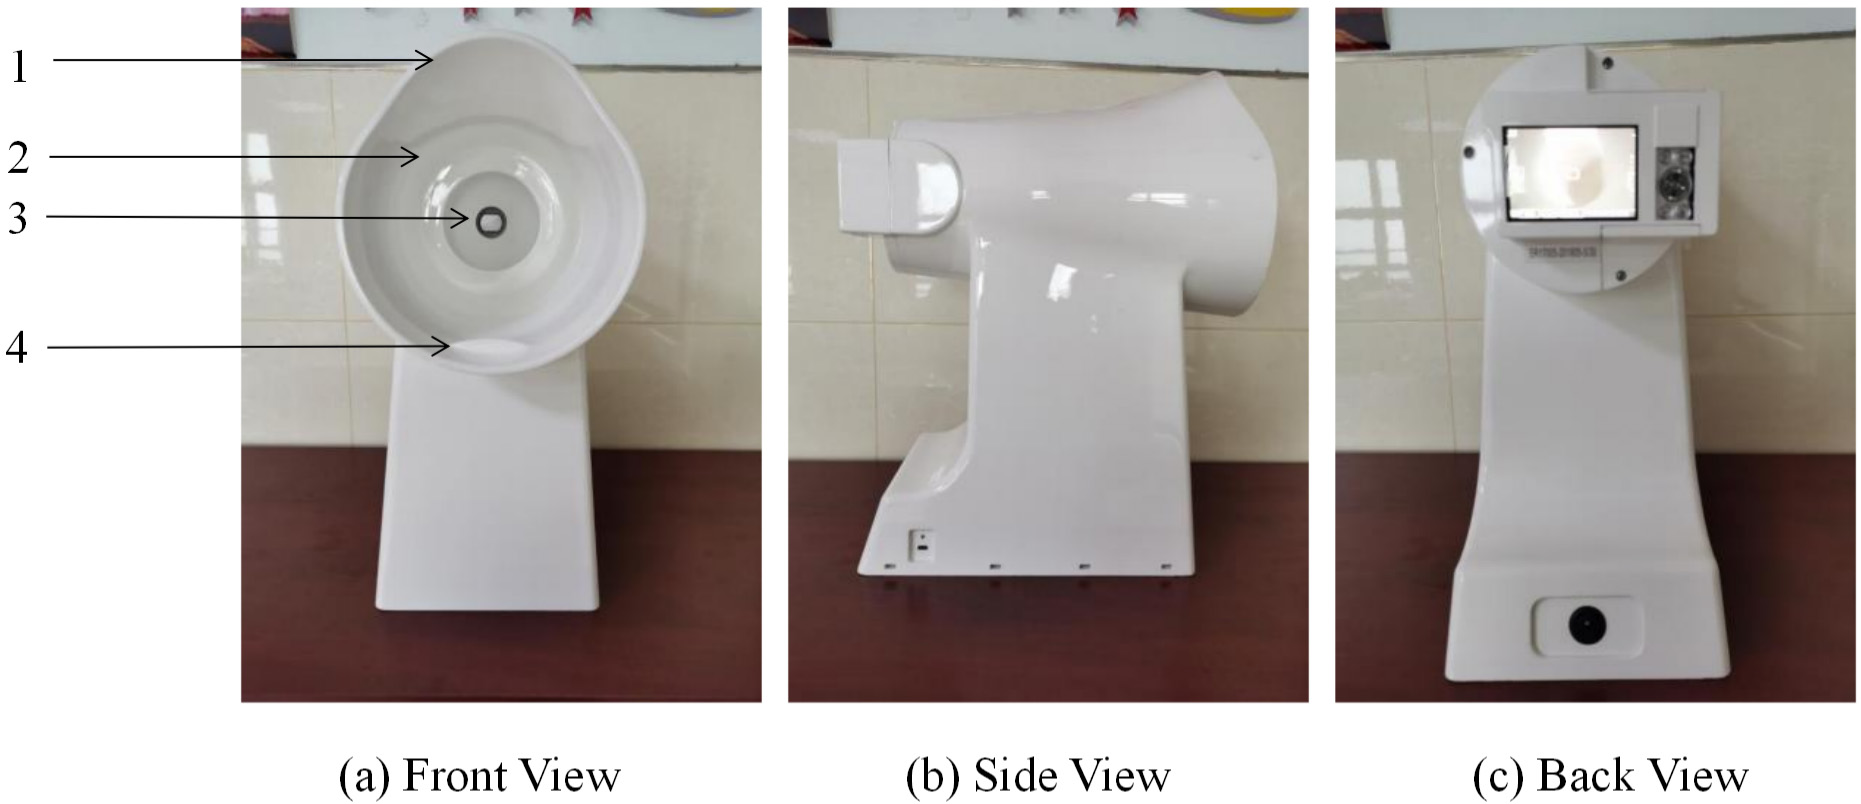
The Institutional Review Board (IRB) of Shuguang Hospital affiliated to the Shanghai University of Traditional Chinese Medicine reviewed and approved the study protocol (IRB number: 2018-626-55-01). The study was registered under clinical trial registration number ChiCTR1900026008. All participants signed informed consent forms and the study was conducted in accordance with the Declaration of Helsinki. All source code and data analyzed during the current study are available from the corresponding author upon reasonable request.
The annotation mainly includes the diagnosis of hypertension and CHD. The diagnostic criteria of hypertension refers to the China Guidelines for the Prevention and Treatment of Hypertension [21]. The CHD diagnosis is based on patients’ CAG results which is the “gold standard.” In this study, patients with coronary stenosis by more than 50% were diagnosed with CHD. The label of hypertensive patients without CHD was marked as 0, and the label of hypertensive patients with CHD was marked as 1.
Extraction tongue features by TDAS
Statistical analysis of tongue features
Statistical analysis of tongue features
Note: TB is tongue body, TC is tongue coat, R represents red, G represents green, B represents blue, H represents hue, I represents intensity, S represents saturation, L represents luminance, a represents the range from red to green, b represents range from yellow to blue. Compared with the hypertension group,
The process of extracting the color, texture and coating area features of the tongue image by TDAS.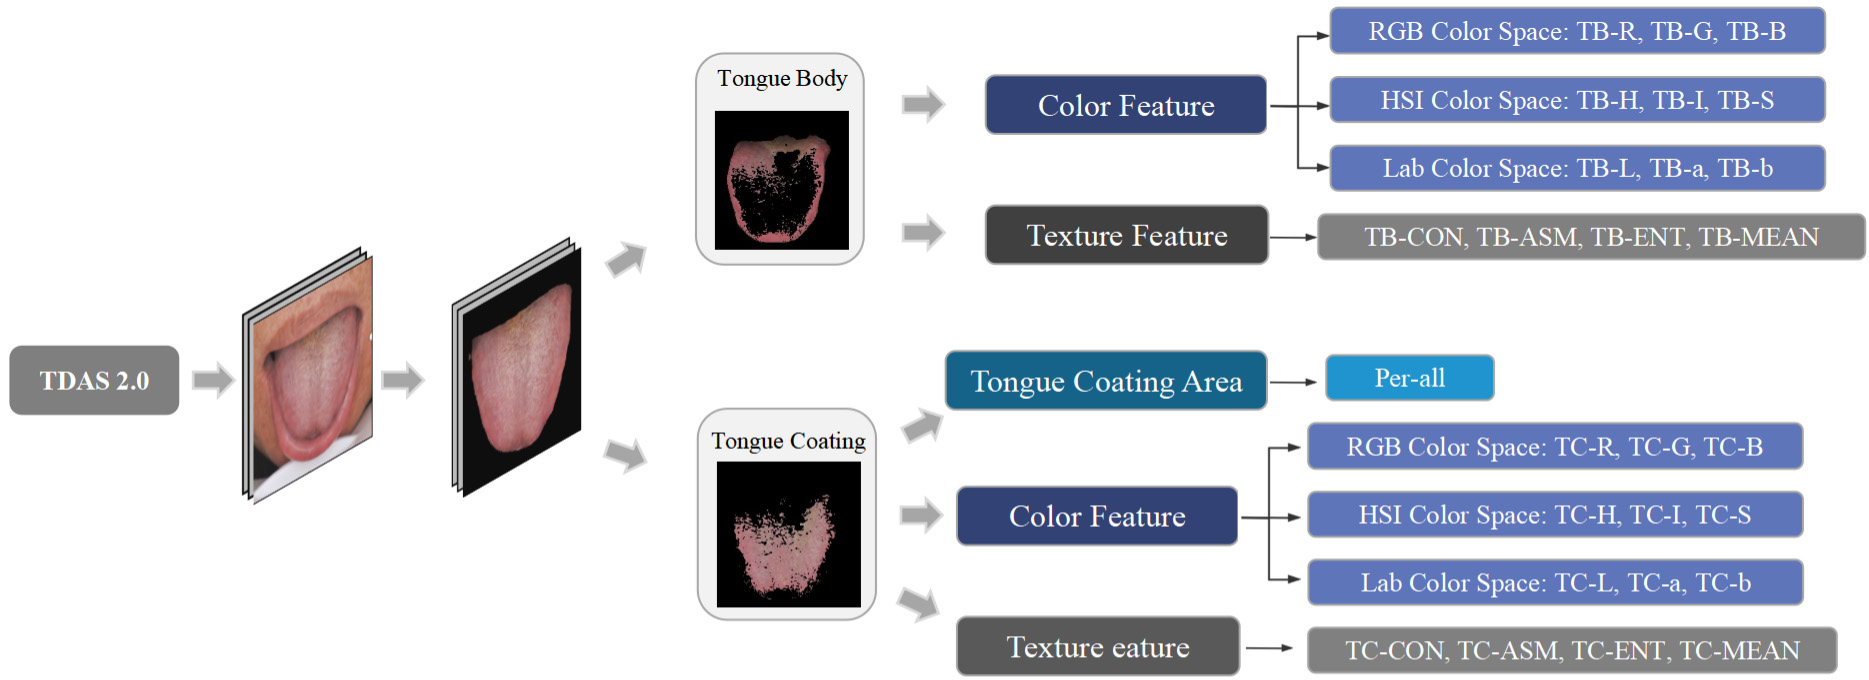
TDAS, a self-developed tongue feature analysis system, can analyze standardized tongue images into features of medical diagnostic significance. Our study used TDAS to extract the tongue’s color, texture and coating area features. Figure 2 shows the extraction process of tongue image features by TDAS. The division-merging algorithm and chrominance threshold method were combined to separate the tongue body and tongue coating. Detailed algorithm was referred to the relevant literature [22]. We calculated the color of the tongue body and tongue coating separately and used color spaces RGB, HSI and Lab to describe color features. The method is to calculate the RGB value of each pixel point and then take the average of the total pixels. Considering the visualization of color and the feasibility and practicability of classification, we transformed RGB chroma space into Lab and HIS [23]. The obtained parameters included red (R), green (G), blue (B), hue (H), saturation (S), intensity (I), lightness (L), red-green (a) and yellow-blue (b). TDAS applied gray scale differential algorithm to describe the texture of body and coating. Texture features include indexes contrast (CON), angular second moment (ASM), entropy (ENT) and mean value [24]. The index perAll reflects the size of the coating area, and the calculation method is tongue coating area/tongue body area. Specifically, these features were TB-R, TB-G, TB-B, TC-R, TC-G, TC-B, TB-H, TB-S, TB-I, TC-H, TC-S, TC-I, TB-L, TB-a, TB-b, TC-L, TC-a, TC-b, TB-CON, TB-ASM, TB-ENT, TB-MEAN, TC-CON, TC-ASM, TC-ENT, TC-MEAN and per-All. To investigate whether there are any medically diagnostic-value feature differences between the tongue images of two groups of participants, we conducted statistical analysis on these feature indexes analyzed using TDAS (Table 2).
Pretreating of tongue feature indexes
We have performed pretreatment on the tongue feature indexes analyzed using TDAS. Firstly, since the tongue feature has a few missing values (less than 5%), we filled the missing values by the mean value. Then, to make the model more robust, Turkey’s test was used to detect and eliminate outliers. By Turkey’s Method, minimum is the lowest data point
Where
Where
Since deep learning models are prone to overfitting in small datasets, training a well-performing model requires a large amount of tongue image data. This study used data augmentation techniques to obtain sufficient training data, thus the original 360 labeled tongue diagnosis images was increased to 21,600 for network training. To complete the data augmentation, we applied the following transformation: first, the image was horizontally flipped once. Then, it was translated by 50 pixels in both the horizontal and vertical directions. Next, the image was scaled by 50%. Finally, it was rotated by 45 degrees, 135 degrees, 225 degrees, 315 degrees, and 0 degrees once each. The original tongue image and the enhanced tongue image are shown in Fig. 3.
The original tongue image Data Augmentation. (a) The original tongue image after image segmentation. (b) Tongue image rotations. (c) Tongue image translations. (d) Tongue image flips. (e) Tongue image scalings.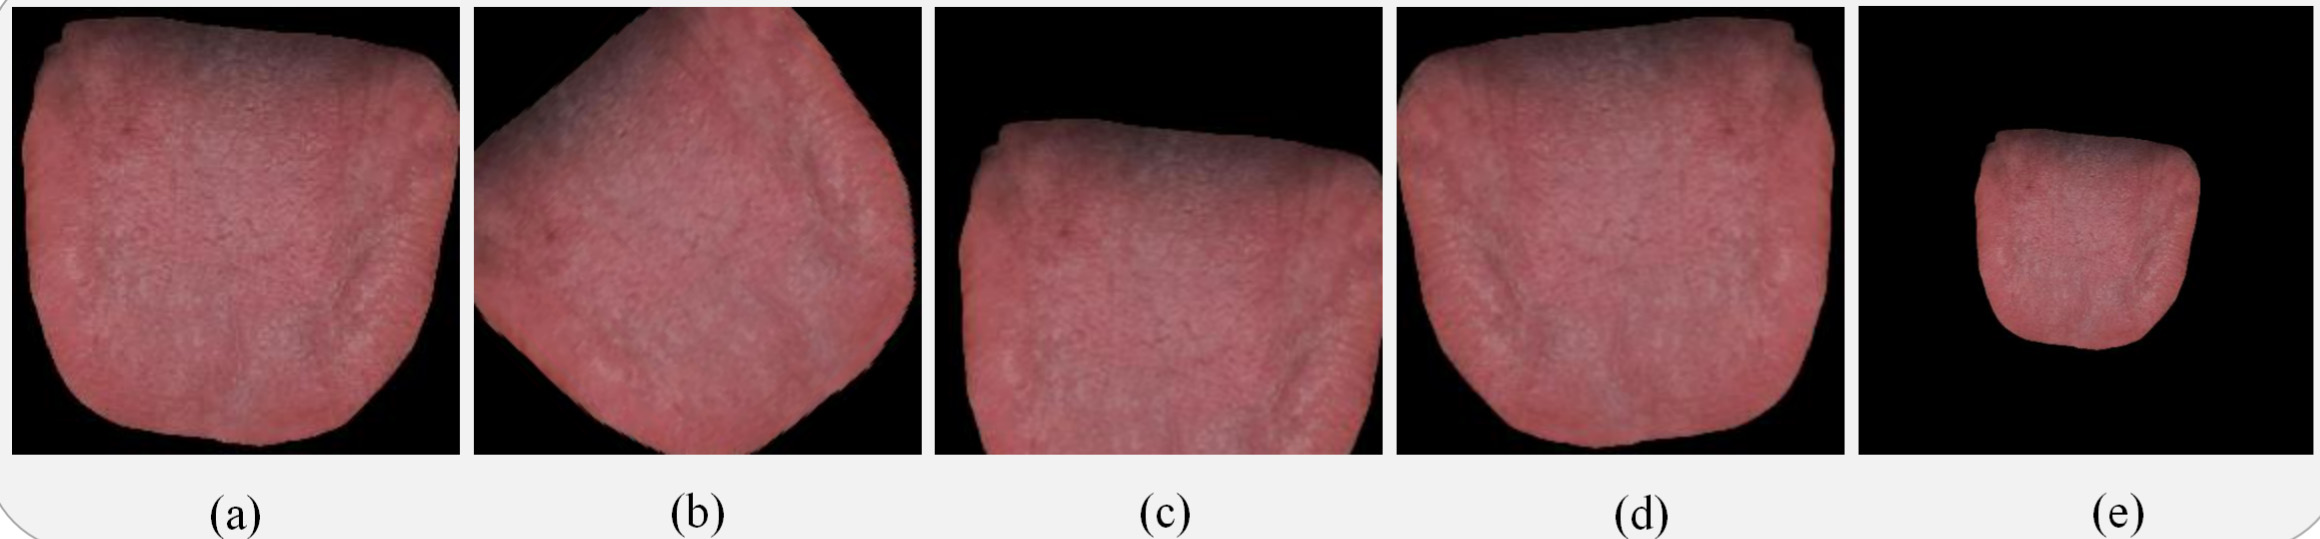
The statistical tools used in this study were SPSS 23 and Sklearn package in Python. When the data fit the normal distribution, we used
Deep feature extraction
We applied deep migration learning to classification tasks, which not only effectively avoided the decline in model performance caused by insufficient samples but also improved the stability and classification accuracy of the network model. When extracting deep learning from the segmented tongue image, we compared the performance of several commonly used convolutional neural networks (CNN) models, including ResNet-50, AlexNet, VGG-16, and GoogLeNet-v1. Finally, we used ResNet-50 as the backbone network for tongue image deep feature extraction in our study, for it showed better performance than other common CNN models (Fig. 4 and Table 3).
Firstly, ResNet-50 is trained based on transfer learning to improve the model’s accuracy, and the pre-trained weights are loaded on the ImageNet of the model to initialize the network. Then, using segmented and enhanced tongue images as input to a trained CNN, the backbone network extracts
The structure of the ResNet-50.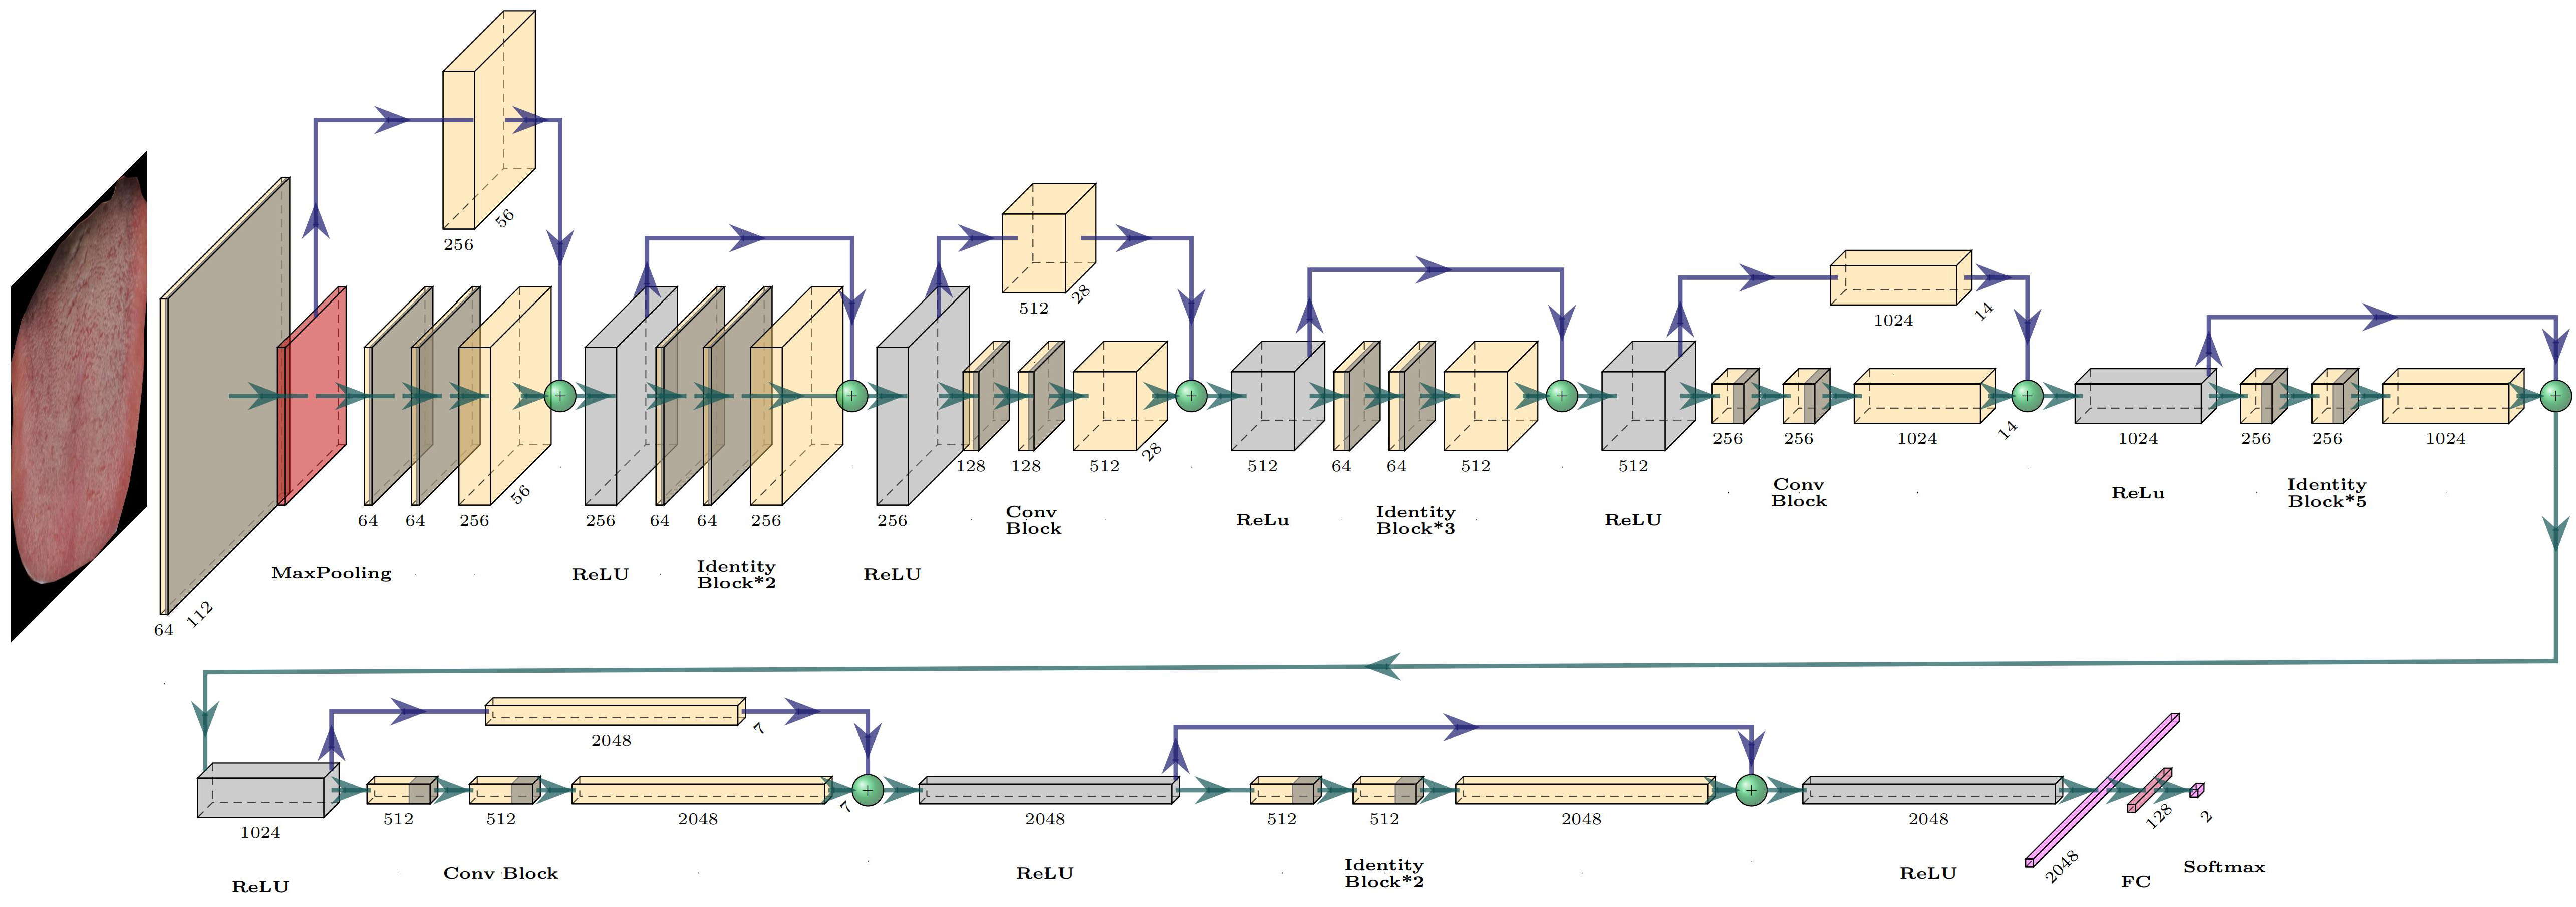
convolutional feature maps through global average pooling, which are then pooled into a visual field map global features. Finally, the multi-layer perceptron outputs a 2-dimensional vector, and the softmax function is used to output the probability of a diagnosis of CHD. The objective function of this method is the cross-entropy loss function, and the network uses the backpropagation algorithm with small batch data to update the model parameters.
The performance comparison of different CNN models on the test set
Algorithm selection
We applied Decision Tree (DT), Random Forest (RF), K-NearestNeighbor (KNN), Logistic Regression (LR), Support Vector Machine (SVM), Artificial Neutral Network (ANN), and XGBoost as algorithms to achieve feature fusion and evaluate their performance. These seven algorithms are machine learning models widely used in medical diagnosis classification tasks. DT uses a tree-like structure to make predictions. It recursively partitions the data based on selected features and assigns a label to each tree branch. RF makes predictions by building and combining multiple decision trees. KNN predicts the category of a test sample based on the categories of the k nearest training samples to the test sample. LR is used for binary classification problems, optimising the likelihood function to minimize the error and using a logistic function to transform probabilities. SVM maps the data into a high-dimensional space and finds the best separating hyperplane, called the decision boundary, based on the support vectors. ANN is a computational model inspired by the structure and function of biological neural networks. It consists of interconnected nodes and learning algorithms that adjust the connection strengths to solve complex problems. XGBoost is an ensemble learning method that combines multiple weak learners and iteratively enhances them to create a powerful machine learning model. It belongs to the category of gradient boosting algorithms, which aim to minimize a predefined loss function by fitting multiple weak learners to the residuals of previous learners. We employed a random search strategy to optimize the model parameters in model implement. Among the seven algorithms, XGBoost performed best (Table 4), so it was chosen as the final model.
The performance comparison of different features fusion algorithm on the test set
The performance comparison of different features fusion algorithm on the test set
We applied the XGBoost to calculate each feature’s importance. The importance of a feature was calculated by counting the number of times this feature used as a basis for partitioning in all base classifiers. This study has 27 features related to color, texture, and tongue coating area, and 2048 deep features extracted based on ResNet-50. The deep feature has too many dimensions, which is not practical for data fusion directly. Thus, PCA was used to reduce the dimensions of deep features before performing feature fusion.
To be specific, we first calculated the feature importance according to the input of TDAS features. At this time, the most important 9 features are: TC-L
Features importance calculated by the XGBoost model with input tongue features extract by TDAS.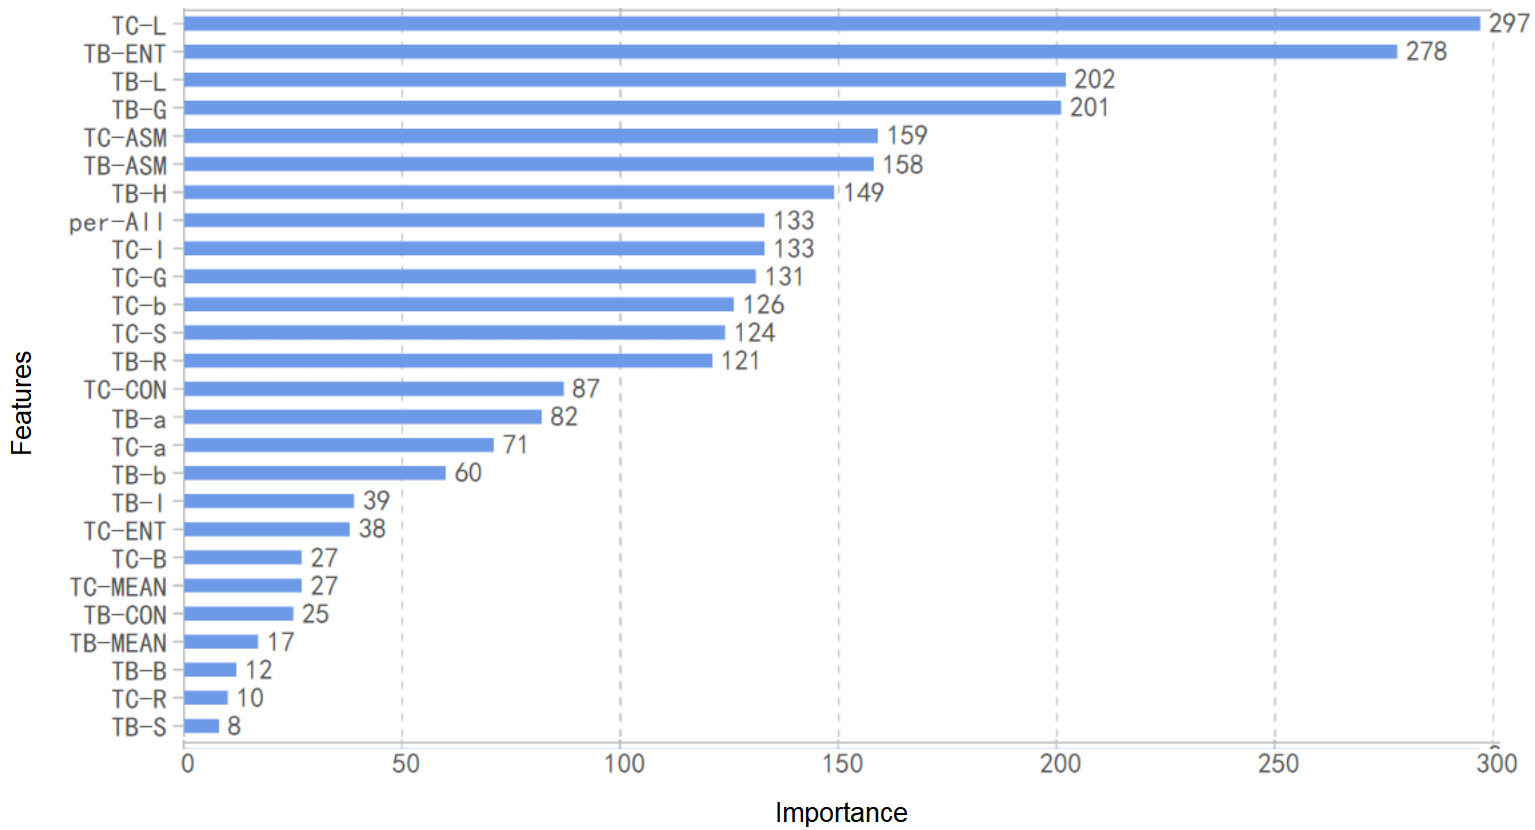
Features importance calculated by the XGBoost model with input fusion features.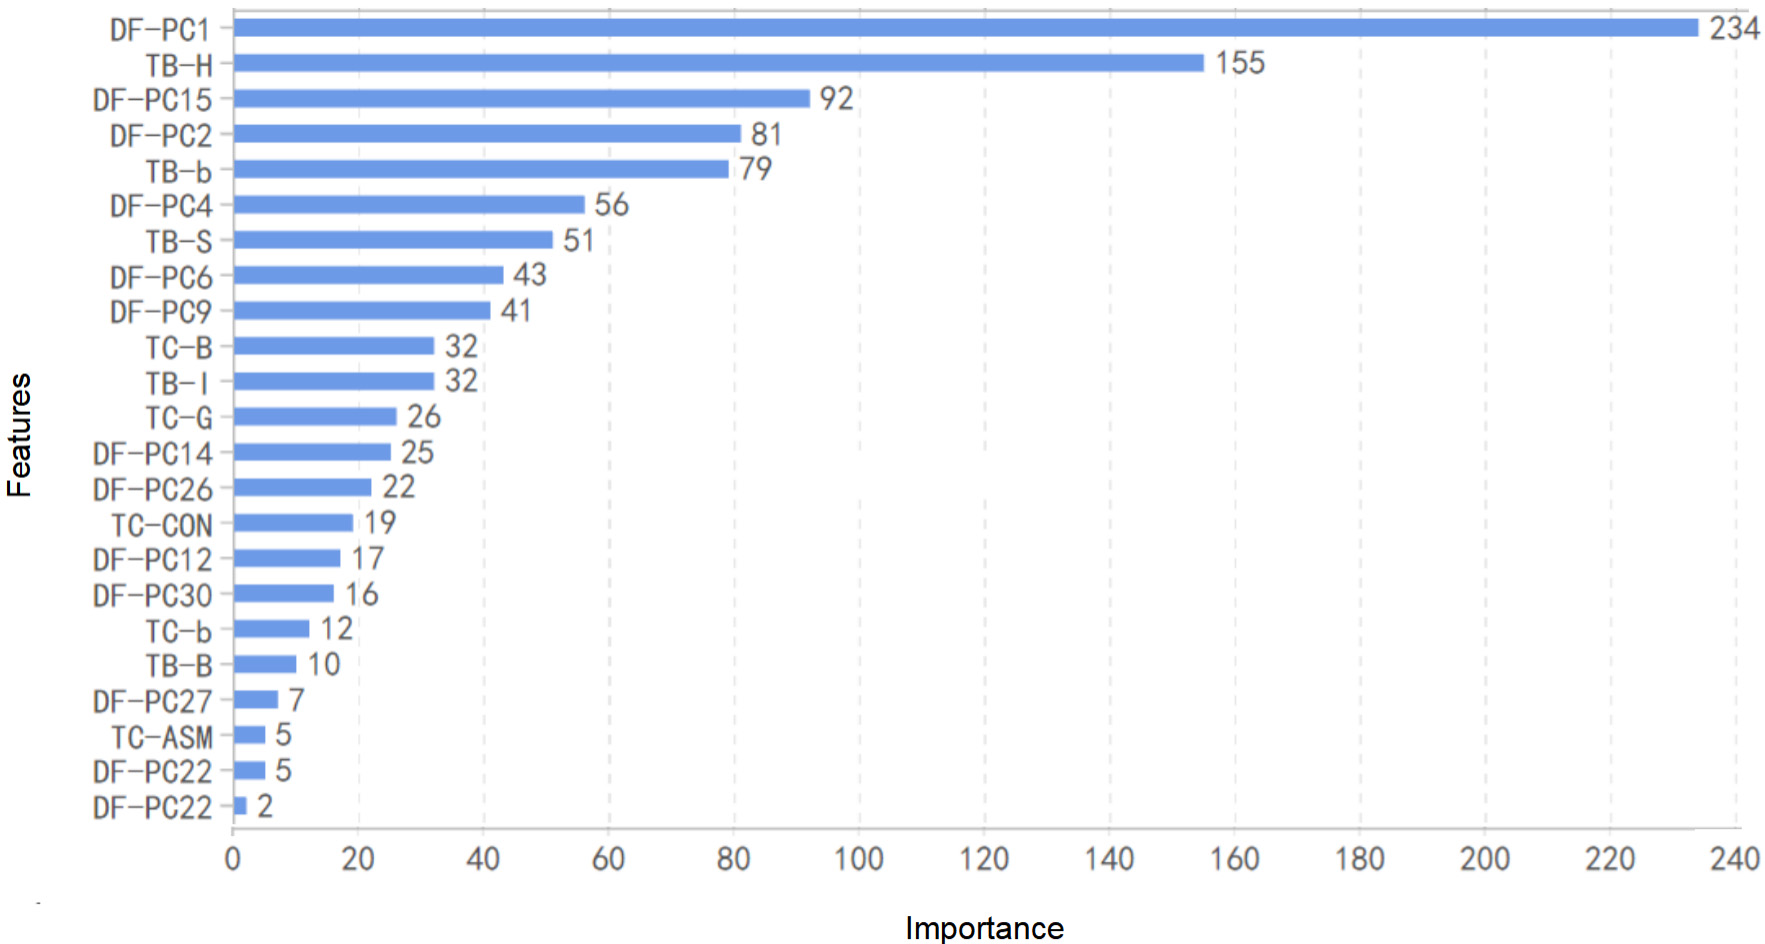
In this study, TDAS was used to extract tongue features, including color, texture, and coating area, ResNet-50 was used to extract deep features, and the XGBoost was used to fuse the features. The 27 medically significant features extracted by TDAS were fused with 30 deep features after dimensionality reduction, which were used as model input to achieve XGBoost model training. The fusion of deep features and TDAS features is the key to establishing a superior CHD diagnostic model (Fig. 7).
Flowchart of tongue image feature fusion strategy.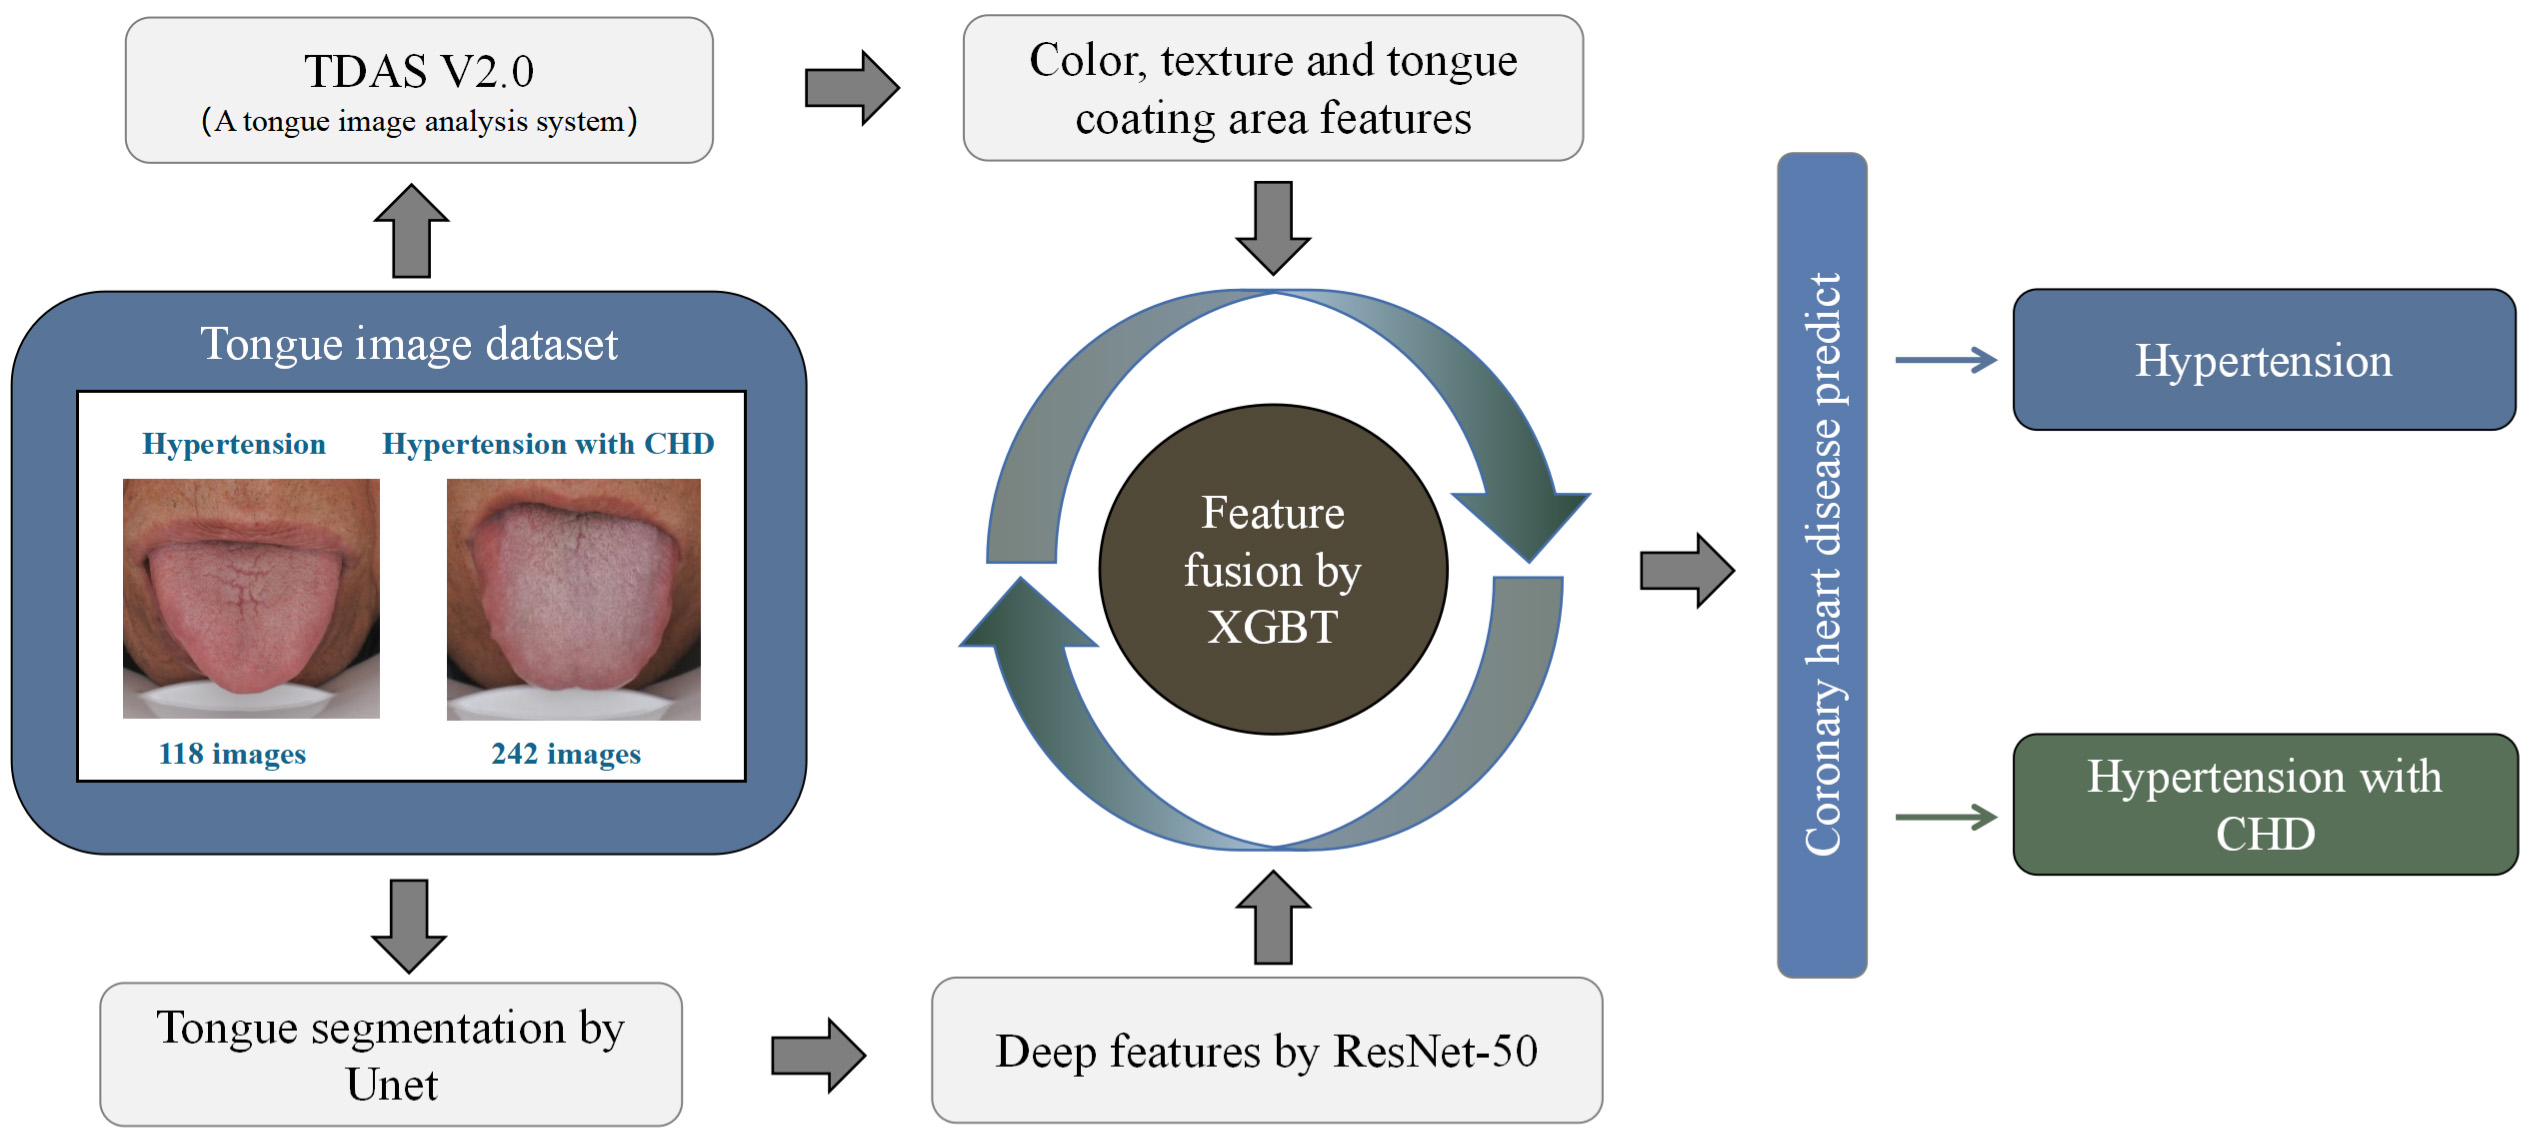
We used accuracy, AUC, AUPR, precision, recall, and F1-Score to evaluate the model performance. AUC can be used to comprehensively evaluate a model’s sensitivity and specificity. AUPR can be used to comprehensively describe a model’s accuracy and recall rate. In addition, we performed a 10-fold cross-validation on the training set to evaluate the model’s effectiveness.
The cases can be divided into four categories according to their actual types and the predicted categories: True Postive (TP), False Positive (FP), False Negative (FN), and True Negative (TN).
CHD tongue features
As shown in Table 2, there were significant differences in tongue features between the CHD group and non-CHD group for hypertensive patients. The results obtained by comparing the index Per-all indicated that patients with CHD had a thinner tongue coating. With respect to the texture index, the ASM value of CHD patients was lower, and the other index values were higher, indicating that the tongue texture was rougher in the group with CHD. By comparing the color index, it was found that the CHD group showed lower brightness for both the tongue body and the tongue coating.
Training set results
The features extracted from TDAS, deep features and fused features were used as input to construct the diagnostic model, and cross-validation was applied to evaluate the model on the training set. The accuracy, recall, and AUC of the model with TDAS features as input were 0.694, 0.640, and 0.767, respectively; and they were slightly better when using deep features as the input (accuracy
Summary of cross validation result on the training set
Summary of cross validation result on the training set
We also evaluated the final models’ performance on the test set. The model with color, texture, and tongue coating area features as input has the same precision as the model with deep features as input. But in terms of other evaluation indicators (accuracy, AUC, AUPR, recall, and F1-score), the latter performed slightly better. It is worth noting that, similar to the results of cross-validation, the model’s performance with fused features as input was obviously better, with AUC of 0.957, AUPR of 0.961, and Precision of 0.926. When the final model with fused feature as inputs was used for the diagnosis of CHD, the true positive rate is high (recall
The result of XGBoost algorithm on the test set
The result of XGBoost algorithm on the test set
10-fold cross validation results of different types of features on the training set.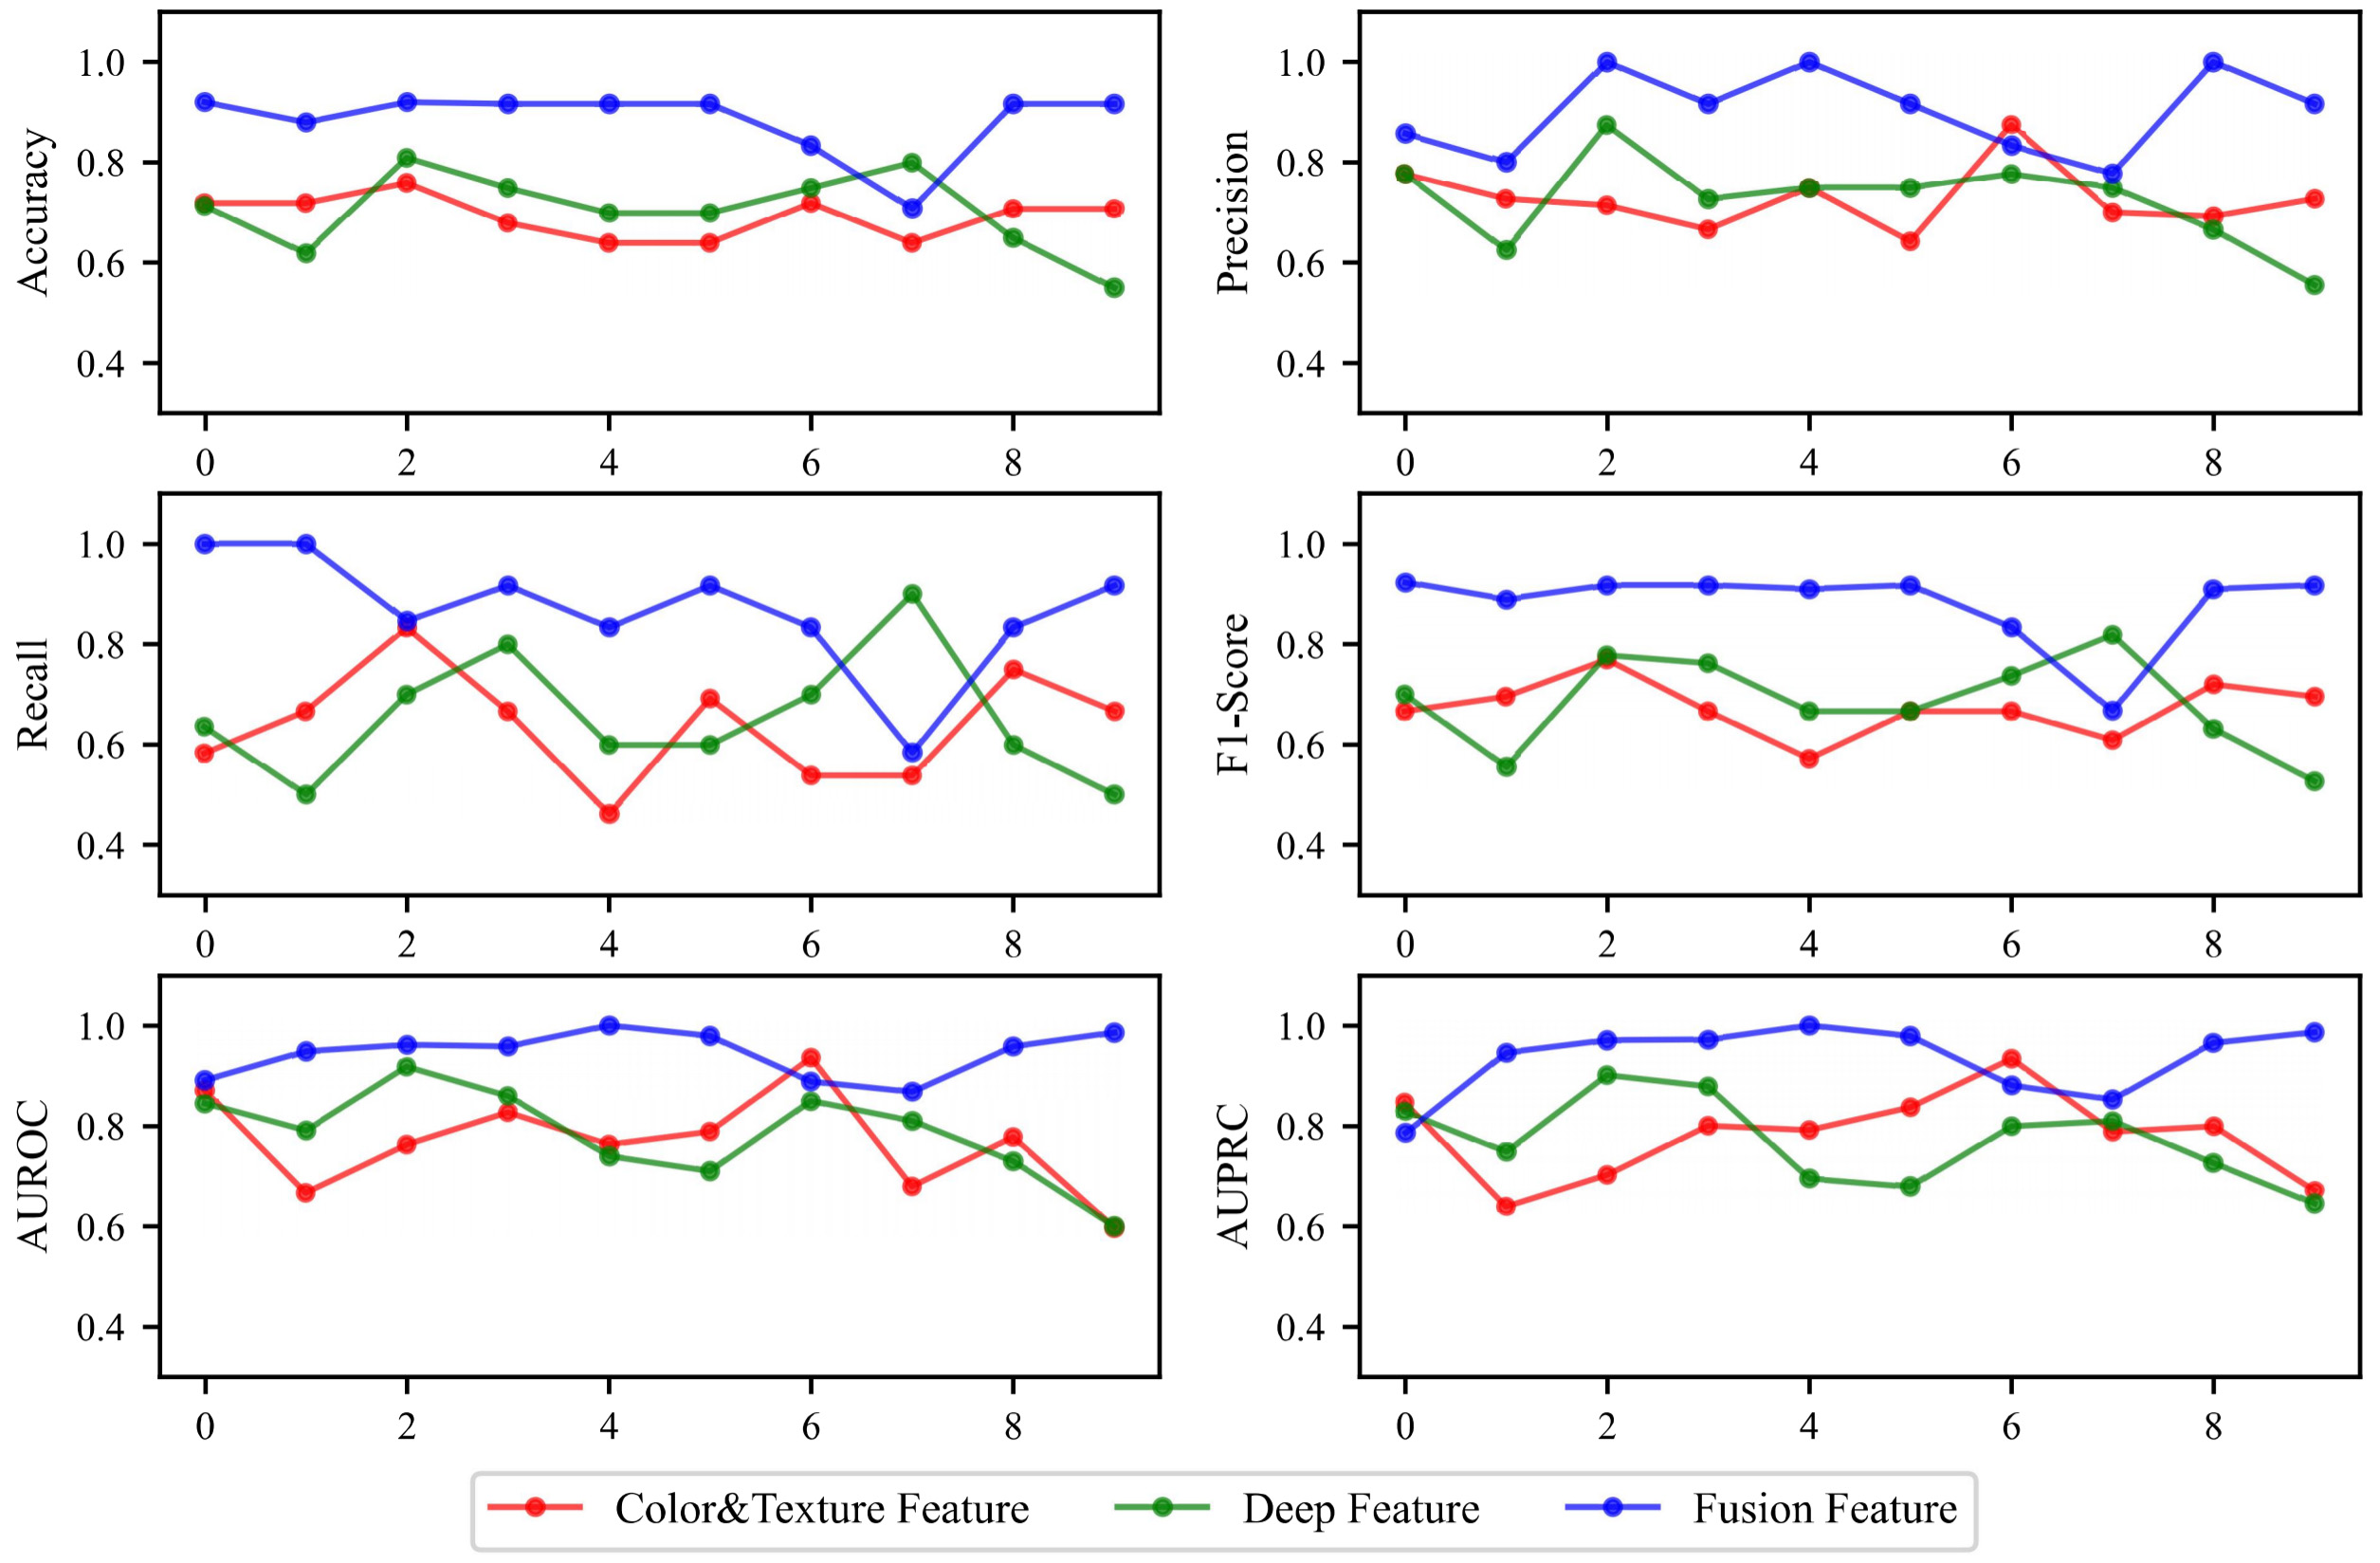
The ROC curve of XGBoost algorithm on test set.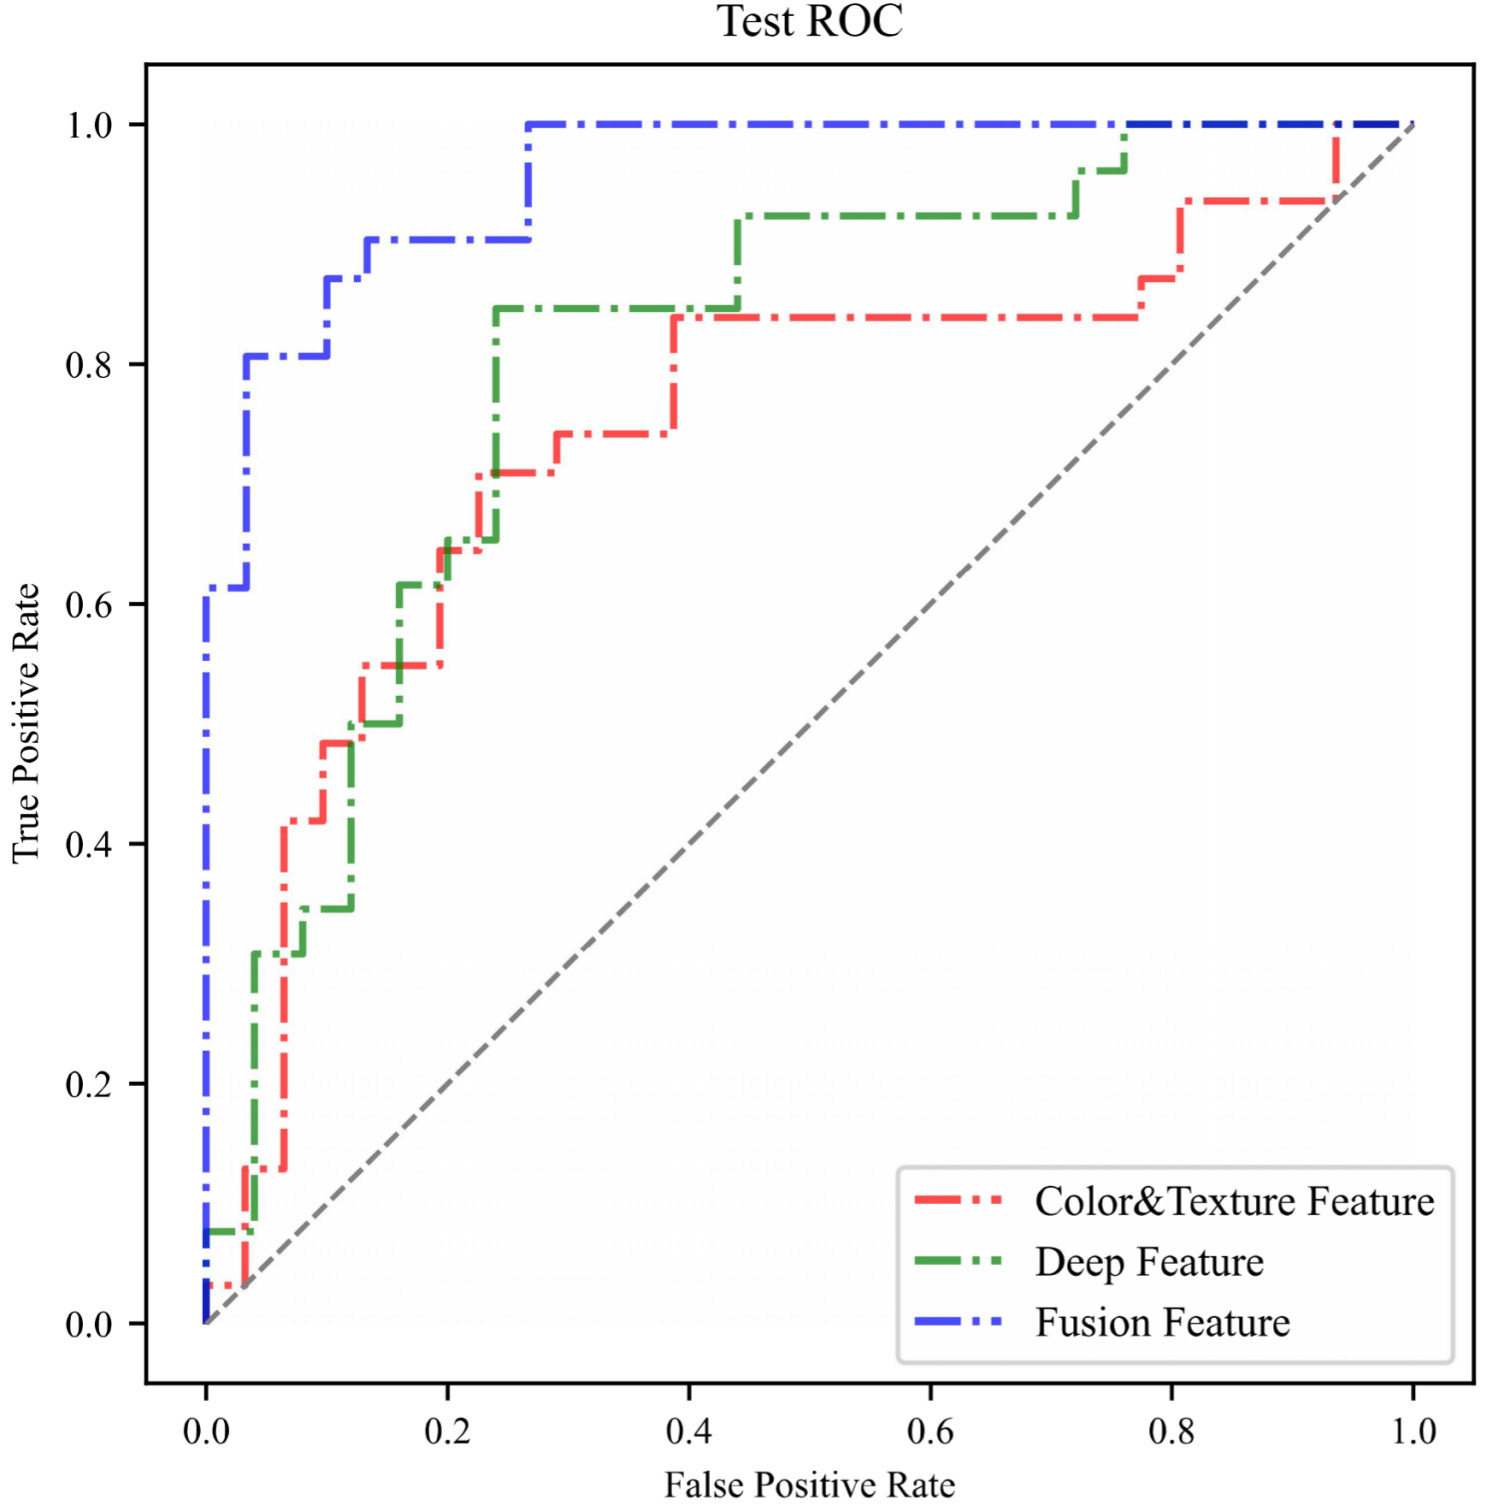
Tongue diagnosis is an essential diagnostic approach in TCM, which contains a lot of important physiological and pathological information. TCM often observes and diagnoses patients through the tongue’s color, texture, and coat features. Traditional tongue diagnosis is based on a doctor’s judgment and is heavily influenced by personal experience, which easily leads to bias. To avoid this error, our research has established strict standards for tongue image acquisition and uniformly utilizes TDAS for feature analysis. The tongue features selected by TDAS are based entirely on the theory of tongue diagnosis in TCM. These indexes have good interpretability and can accurately reflect tongue characteristics, with high clinical diagnostic value. In our study, we used TDAS to extract 27 tongue features that could be interpreted as indexes. Compared with the two groups, there were significant differences in 24 indexes, with 16 of them being highly significant (Table 2). The differences could be interpreted as a darker red color of the tongue body, thinner and darker tongue coating, and rougher tongue texture in patients with CHD. These results indicate that there are significant differences in tongue features between hypertension patients with and without CHD. This suggests that tongue features are sensitive to the diagnosis of CHD and may serve as a new biological marker for the diagnosis of this condition.
Although the method of extracting tongue features using TDAS has many advantages, these features cannot cover all the tongue features that are meaningful for the diagnosis of CHD. In our research, we attempted to use TDAS features to implement a diagnostic model for CHD. However, the performance of this model was less than ideal, with an accuracy of 0.694 on the training set and 0.742 on the testing set. These results indicate that using only TDAS features to implement a diagnostic model requires further optimization in performance. Therefore, our study conducted further extraction of tongue features. With the explosive growth of different forms of information in various fields, it is difficult for traditional processes and technologies to further mine the practical information in the data. Data-driven deep learning has developed rapidly in recent years. It is a branch of machine learning that can effectively solve the problem of insufficient data mining [25]. ResNet-50 applied in our study is a deep residual CNN widely used in feature extraction [26]. It can learn complex features in unstructured tongue image data and discover hidden features that TDAS cannot obtain. In our research, we used Resnet-50 to extract deep features of the tongue and use it to diagnose CHD. We found that compared with TDAS features, deep features had better diagnostic ability, with an accuracy of 0.759. However, the performance of this model was still not satisfactory.
To achieve better diagnostic performance of the model, we attempted to perform feature fusion by XGBoost to combine TDAS features with deep features. XGBoost is a gradient ascending tree model that can achieve effective classification through an ensemble learning approach [27]. Due to its high computational efficiency and accuracy, it is widely used in many data mining tasks [28]. When ranking feature importance (Figs 5 and 6), the first nine indexes simultaneously include both deep features and TDAS features, which means that for tongue image information mining, deep features and tongue diagnostic features can complement each other. The feature fusion method can simultaneously play the role of medical experience and the data mining advantage of deep learning. The encouraging result is that the diagnosis model based on fused features showed stable performance and higher accuracy on the testing set (0.869), indicating that feature fusion is a valuable method for improving the diagnostic model’s performance. It should also be noted that, considering the instability of AI models, we used seven commonly used machine learning models to implement the diagnostic model. While the diagnostic performance of other models may not be as high as that of XGBoost, their accuracy rates are all above 0.7. This result indicates that tongue images can be used as a stable diagnostic tool for CHD, regardless of which AI learning model, further validating the reliability of our algorithm customization process.
Using the tongue to diagnose CHD can be considered a novel approach, and the appearance changes of the tongue caused by coronary artery stenosis may be related to abnormal blood flow [29]. As an important terminal organ rich in blood vessels, the appearance of tongue often changes when there are problems with blood circulation [30]. Therefore, diagnosing diseases using the tongue is very timely. The method of diagnosing CHD using tongue imaging only requires taking a photo of the participant’s tongue sticking out, a process that takes only a few minutes, is non-invasive, and does not incur any additional laboratory costs. This makes it a highly suitable screening method for hypertension populations with large numbers. This non-invasive CHD diagnosis method based on the tongue image is very inexpensive, which can lower the threshold for patients to receive diagnosis and enable more potential CHD patients to be diagnosed, enabling earlier detection and treatment. Moreover, this method also has the advantage of being quick and efficient, reducing medical costs while improving medical efficiency.
In summary, we have found that for hypertension patients, tongue images have significant diagnostic value for CHD screening, and a CHD diagnostic model has been implemented using tongue images. This model has the advantages of being non-invasive, inexpensive, and convenient, making it highly suitable for large-scale CHD screening, helping patients receive appropriate treatment earlier and reducing the harm caused by CHD. This study provides a new perspective for diagnosing CHD and may help other researchers engaged in non-invasive diagnosis of CHD consider using tongue images as one of the diagnostic criteria to optimize their diagnostic models.
However, there are still some shortcomings to our research. This study only included a Chinese population, and the applicability of the findings to other ethnic groups needs to be further verified. In addition, this study mainly explored the feasibility of using tongue images for non-invasive diagnosis of CHD. It did not involve other risk factors of CHD when building the diagnostic model, which may reduce the clinical significance of this method. Furthermore, although we have adopted a standardized process for tongue image acquisition, the stability of tongue features is inevitably affected by the subject’s tongue-stretching posture and habits. Finally, although we employed data augmentation techniques, this still does not constitute a large enough dataset for building a robust diagnostic model. Therefore, there is room for further optimization in this study.
Conclusion
Based on the study of tongue features, we summarized the tongue expression of CHD patients and customized a diagnostic algorithm, which performed well in hypertensive patients with an accuracy of 0.869 and an AUC of 0.957. This algorithm is fully based on tongue images to predict the risk of hypertension patients developing CHD, with the advantages of being non-invasive, simple, and accurate. It is very suitable for large-scale screening and risk assessment of CHD. This experimental result also provided evidence for the clinical value of the tongue in diagnosing CHD, suggesting that tongue image information is a very effective marker. Furthermore, we also demonstrated the great potential of deep learning frameworks for auxiliary disease diagnosis. As a powerful toolset, we expect deep learning to promote tongue diagnosis in the field of non-invasive disease diagnosis.
Author contributions
Mengyao Duan: Data collection, Methodology, Software, Validation, Formal analysis, Investigation, Writing original draft. Yiming Zhang: Conceptualization, Methodology, Validation, Plotting figures, Supervision. Yixing Liu: Revising draft, Methodology, Data curation. Boyan Mao: Revising draft, Validation, Investigation, Funding. Gaoyang Li: Revising draft, Methodology, Software. Dongran Han: Data collection, Conceptualization, Methodology, Investigation, Validation, Resources, Supervision, Funding. Xiaoqing Zhang: Editing, Conceptualization, Methodology, Investigation, Supervision, Funding.
Funding
The study was supported by the National Natural Science Foundation of China (grant number 12102064) and the Ministry of Science and Technology of the People’s Republic of China (grant numbers 2017FYC1703300 and 2022YFC3502300).
Footnotes
Acknowledgments
We would like to thank all participants and their family members for participating in this study.
Conflict of interest
The authors declare that the research was conducted in the absence of any commercial or financial relationships that could be construed as a potential conflict of interest.