
Abstract
BACKGROUND:
Alzheimer’s disease (AD) endangers the physical and mental health of the elderly, constituting one of the most crucial social challenges. Due to lack of effective AD intervention drugs, it is very important to diagnose AD in the early stage, especially in the Mild Cognitive Impairment (MCI) phase.
OBJECTIVE:
At present, an automatic classification technology is urgently needed to assist doctors in analyzing the status of the candidate patient. The artificial intelligence enhanced Alzheimer’s disease detection can reduce costs to detect Alzheimer’s disease.
METHODS:
In this paper, a novel pre-trained ensemble-based AD detection (PEADD) framework with three base learners (i.e., ResNet, VGG, and EfficientNet) for both the audio-based and PET (Positron Emission Tomography)-based AD detection is proposed under a unified image modality. Specifically, the effectiveness of context-enriched image modalities instead of the traditional speech modality (i.e., context-free audio matrix) for the audio-based AD detection, along with simple and efficient image denoising strategy has been inspected comprehensively. Meanwhile, the PET-based AD detection based on the denoised PET image has been described. Furthermore, different voting methods for applying an ensemble strategy (i.e., hard voting and soft voting) has been investigated in detail.
RESULTS:
The results showed that the classification accuracy was 92% and 99% on the audio-based and PET-based AD datasets, respectively. Our extensive experimental results demonstrate that our PEADD outperforms the state-of-the-art methods on both audio-based and PET-based AD datasets simultaneously.
CONCLUSIONS:
The network model can provide an objective basis for doctors to detect Alzheimer’s Disease.
Introduction
Alzheimer’s disease (AD) is a kind of neurodegenerative disease, which seriously endangers the physical and mental health of the elderly. According to statistics from World Alzheimer Report 2022,1
Studies have shown that the stage before the dementia stage of AD is called Mild Cognitive Impairment (MCI). At this time, patients have objective cognitive impairment, but the ability of daily living has not been significantly affected. It is very important to conduct automatic early detection of AD, especially in the MCI phase. At present, artificial intelligence is widely used in heart rate estimation [1], COVID-19 infection detection [2], malignant lymphoma detection [3], and medical devices integration [4]. According to the literature [5], people’s language comprehension and cognitive process originates from a semantic network formed in the mind consisting of nodes and relations, containing both transient and long-term memory encoding processes. This process lays the foundation of the neural network cognitive model in artificial intelligence. Relevant studies have shown that artificial intelligence can be used to model different behavior of AD patients (i.e., logical reasoning and spatial navigation ability [6]), so as to predict the possibility of people suffering from AD.
The existing literature of surveys show that the automatic AD detection based on artificial intelligence is possible. For example, Garcia et al. [7] gave statistics on the representative methods of AD intervention using artificial intelligence, speech and language methods from 2000 to 2019, and made an in-depth review from the research details, data analysis, methodology, and clinical application. Besides, Filiou et al. [8] conducted an in-depth comparative study on the six types of features most affected in AD discourse in the context of picture description, including the multidimensional change patterns in the fields of production, grammar, vocabulary, fluency, semantics and discourse. Furthermore, Billeci et al. [9] listed the representative machine learning methods for the AD detection and emphasized the importance of multi-modal AD detection combined with image analysis. In addition, Pulido et al. [10] analyzed the monitoring of AD patients based on spontaneous speech and speech analysis technologies. More specifically, some audio-based features (i.e., percentage of silence duration, number of speech segments, log-Mel) and linguistic-based features (i.e., n-gram, syntactic) can be employed to perform AD detection.
Currently, the image-based AD detection is relatively easy compared with audio-based AD detection since the image modality is easy to obtain. However, the audio-based AD dataset is scarce since the speech collection is a time-consuming task. Therefore, the motivation of this paper is to investigate whether the audio modality can be transferred to context-enriched Spectrogram/Mel-spectrogram/MFCC image modality as shown in Fig. 1 as the input of current pre-trained image classification framework instead of using the traditional context-free audio matrix. Therefore, audio-based AD and image-based AD detection with the pre-trained image classification framework has been conducted under a unified image modality simultaneously.
Transfering audio modality to image modality.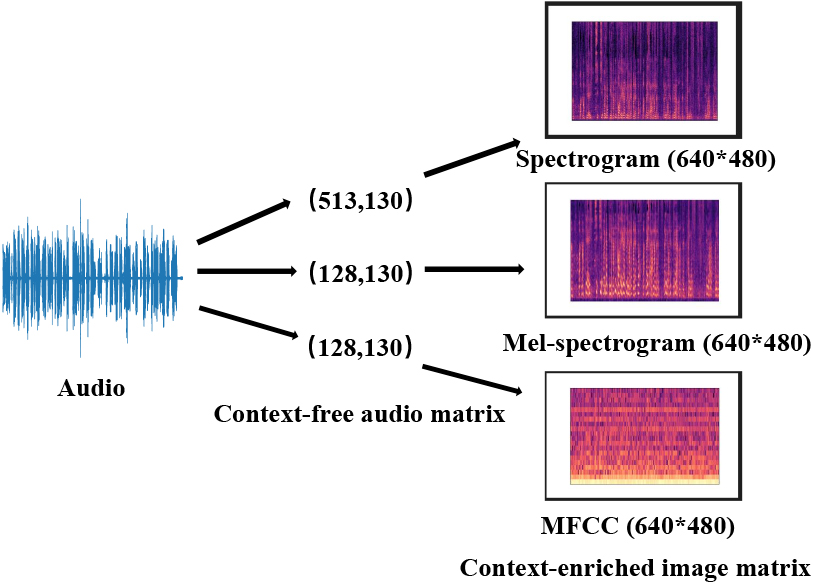
Different from the existing AD detection models, a novel pre-trained ensemble-based AD detection (PEADD) framework with three base learners (i.e., ResNet, VGG, and EfficientNet) for both audio-based and PET-based AD detection is developed under a unified image modality. The context-enriched image modality instead of a context-free audio matrix is taken as the input to the pre-training image classification framework for the audio-based AD detection. Furthermore, different voting methods (i.e., hard voting and soft voting) for applying an ensemble strategy has been verified in detail. Experimental results on the two benchmark AD datasets demonstrate that our PEADD significantly outperforms the state-of-the-art methods.
The major contributions of this paper are two-folds, as follows:
The proposed model systematically studies the early detection of AD from a unified image modality for both audio-based and PET-based AD detection. The effectiveness of context-enriched image modality instead of the traditional context-free audio matrix for the audio-based AD detection is inspected in detail. A simple and efficient image denoising strategy for both the initial audio-based and PET-based images is proposed. In addition, different voting methods (e.g., hard voting and soft voting) for applying an ensemble strategy has been verified, and demonstrate that our model significantly outperforms the state-of-the-art approaches on two benchmark audio-based and PET-based AD datasets simultaneously.
The rest of this paper is organized as follows. We review related work in Section 2. In Section 3, the model PEADD is presented in detail. In Section 4, experiments to investigate the performance of our proposed PEADD are conducted, including experimental setting and result analysis. The limitations and deployment are discussed in Section 5. Finally, we conclude the paper and discuss future research in Section 6.
Approaches for automatic AD detection can be categorized into three subgroups (i.e., feature-based methods, deep learning-based approaches, and hybrid models). Following subsections will explain representative models of these three subgroups in detail.
Feature-based methods
Abdalla et al. [11] explored the function of specific rhetorical structures in the discourse expression of AD patients using ANOVA (Analysis of Variance). Besides, Qiao et al. [12] studied the effectiveness of seven key audio-based features (i.e., percentage of silence duration, average duration of phrase segments, average duration of silence segments, number of speech segments, the number of long pauses, the ratio of hesitation/speech counts, and the ratio of short pauses/speech counts) in the AD detection. In addition, Ahangar et al. [13] carried out SPSS analysis and
Deep learning-based approaches
Lopez-de-Ipina et al. [21] proposed a nonlinear multi-task model based on automatic speech analysis, extracted some novel features (i.e., Castiglioni fractal dimension and multi-scale permutation entropy), and employed a multi-layer perception and convolutional neural network for AD detection. In addition, Martinc et al. [22] proposed a multi-modal AD detection model based on BERT, which verified the temporal interaction between the acoustics (i.e., duration, embedding velocity, centroid velocity) and the text features (i.e., bag-of-n-grams). Besides, Zhu et al. [23] proposed a transfer learning-based AD detection model with YAMNet, Mockingjay and BERT to alleviate the limited AD voice data problem. Mahajan and Baths [24] proposed an end-to-end AD detection model based on CNN-LSTM, which combined text features and audio features simultaneously. Furthermore, Sarawgi et al. [25] proposed a multi-modal AD detection model based on multi-layer perception, which deeply explored various acoustic, cognitive and linguistic features, and achieved F1 performance of 0.83 on the ADReSS dataset. Similarly, Yuan et al. [26] proposed an ERNIE-based AD detection model, and showed that the frequency of usage of UM tone in AD patients is much lower than that usage of UH tone. Moreover, Fritsch et al. [27] and Palo and Parde [28] proposed a LSTM-based and CNN-based AD detection models respectively. Also, Karlekar et al. [29] proposed three neural models based on CNN, LSTM-RNN and their combinations for AD detection, and further analyzed the discrimination of these neural models on the speech characteristics of AD patients through activation clustering and first derivative saliency technology. Other similar work can be found in literatures [30, 31].
Hybrid models
Two AD detection models were proposed in Balagopalan et al. [32], one is a domain knowledge-driven model which can extract a large number of clinically relevant linguistic and acoustic features, and another one is a BERT-driven transfer learning model. Lindsay et al. [33] investigated the function of different features (i.e, task related features, syntactic features, semantic features and prosodic features) in AD detection, and performed non parametric Kruskal Wallis H-Test and correlation analysis. They also employed logistic regression, SVM and MLP classifiers to conduct AD detection. Furthermore, Haulcy and Glass et al. [34] employed various acoustic features (i.e., i-vectors and x-vectors) and text features (i.e., word vectors, linguistic inquiry and word count), and conducted AD detection with LDA, decision tree, KNN, SVM, random forest, LSTM, CNN classifiers. In addition, literature [35] compared the performance of two AD detection methods (i.e., domain-based and BERT-based methods) in detail on the ADReSS dataset.
Different from the above representative AD detection models, a novel pre-trained ensemble-based AD detection (PEADD) framework with three base learners (i.e., ResNet, VGG, and EfficientNet) for both the audio-based and PET-based AD simultaneously is proposed under a unified image modality. This work tries to conduct AD detection from different context-enriched image modality instead of the traditional context-free audio matrix, along with simple and effective image denoising strategies.
Proposed model
Figure 2 shows the framework of our AD detection model PEADD. As it shows, the whole model consists of four components. The first component is the feature extractor, the second one is the image denoising, the third one is the feature learner, and the last one is the ensemble learner. If source inputs are in audio format, the context-enriched image modality of audio will be generated through the component of feature extractor; otherwise, the PET-based inputs can be directly fedded into image denoising component. And then, the output of the feature learner will be fedded into ensemble learner to predict the final label (i.e., AD, MCI, HC). In the following paragraphs, major components inside PEADD, i.e., feature extractor, image denoising, feature learner, and ensemble learner, will be explained in detail.
The framework of our PEADD.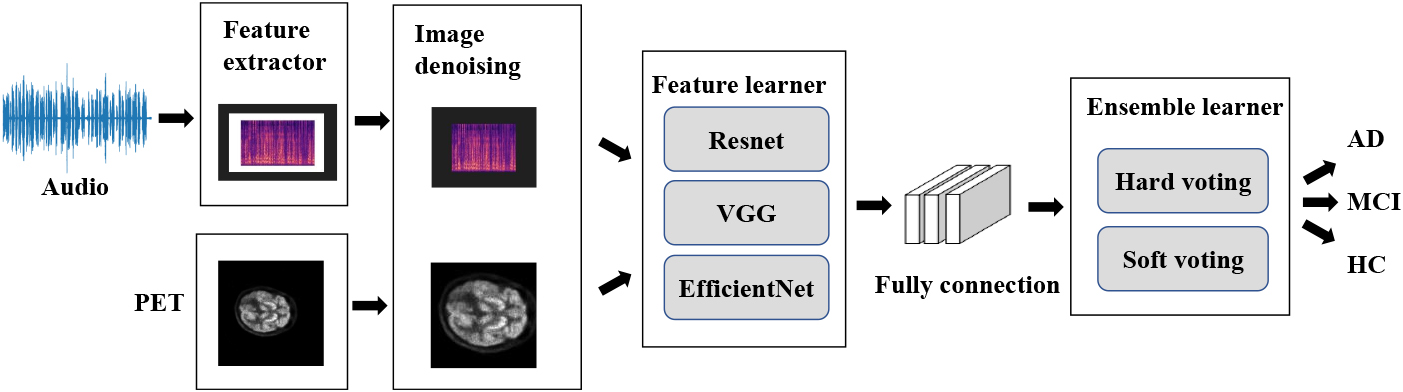
Feature extractor
This feature extractor component is designed for the audio-based AD detection. Specifically, three kinds of image modality of audio-based features, e.g., Spectrogram, Mel-spectrogram, and Mel-Frequency Cepstral Coefficients (MFCC), is adopted.
Spectrogram
The spectrogram is obtained from the original audio through pre-emphasis, framing, windowing and short-time Fourier transform as shown in Eq. (1) where
Mel-spectrogram
The Mel-spectrogram is also known as FBank as shown in Eq. (2). The spectrogram passes through a series of Mel filter banks. Because of the overlap of adjacent filters, the characteristic correlation of Mel-spectrogram is high. On the basis of the extracted sound spectrum, the energy spectrum is obtained by squaring it, the energy in each filter band is superposed, and the output power spectrum of the
MFCC
Mel-Frequency Cepstral Coefficients is a kind of popular speech feature as shown in Eq. (3) where
Generally, the above three audio-based features (i.e., Spectrogram, Mel-spectrogram, and MFCC) are context-free matrix of audio modality. The context-free matrix definitely loss some key information. Therefore, this paper tries to investigate the context-enriched image modality of these audio-based features. Compared with the context-free audio matrix format, the context-enriched image modality has rich representation. The amplitude in the Mel-spectrogram demonstrates the energy of the people. Generally, the energy of AD, MCI and HC should be different. Therefore, the context-enriched image modality instead of the context-free audio matrix is taken as the input of base learners. What’s more, image denoising is also conducted as shown in the Figs 3 and 4 respectively as following.
Image denoising for the Mel-spectrogram.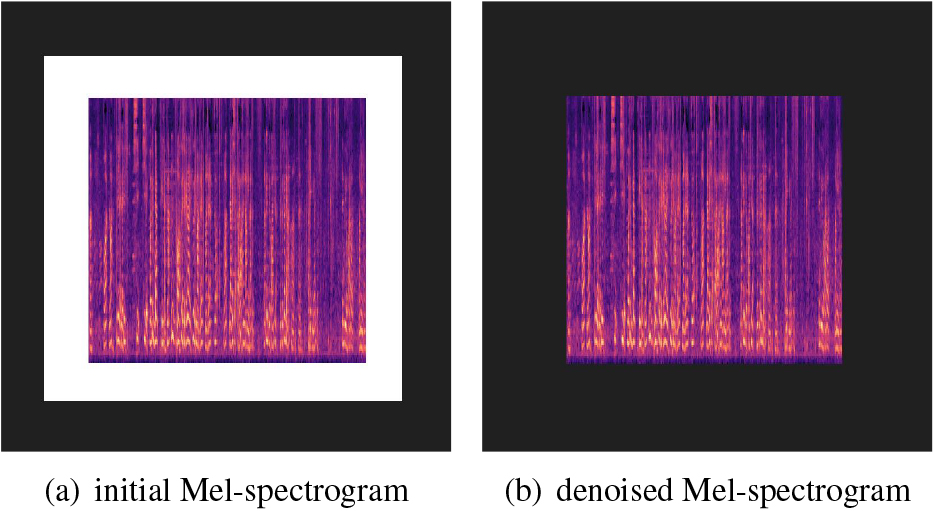
Image denoising for the PET.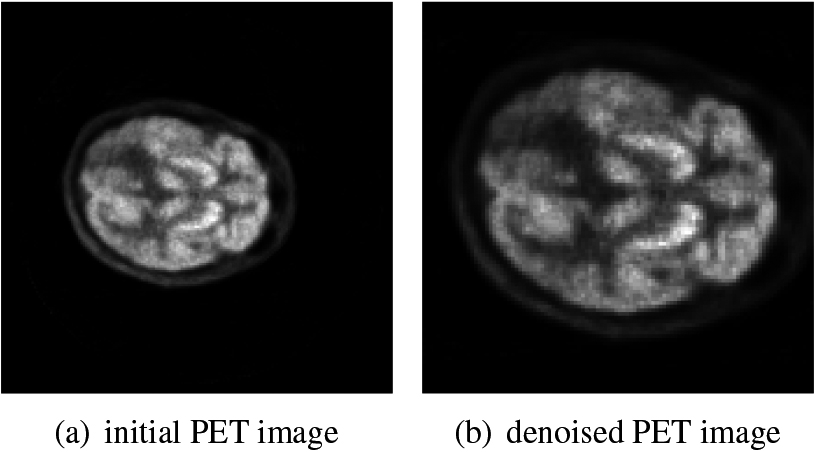
Image denoising
To be more specific, the Fig. 3a is the initial Mel-spectrogram modality, and the Fig. 3b is the denoised Mel-spectrogram modality named Mel-spectrogram_Denoising. Similarly, Fig. 4a is the initial PET image, and the Fig. 4b is the denoised PET image. For the Mel-spectrogram modality, the points with pixel value less than 255 are detected. the white frame surrounding the Mel-spectrogram after using matplotlib utility to generate its image is removed in order to reduce the noise. For the PET (Positron Emission Tomography) modality, since the images of the initial PET are all standard squares, the pre-processing process is to detect the square shape of brain from four directions. After the brain region is detected, the cutting process is performed. At this time, because the brain image is not round and the initial position of the brain is random (that is, the position of the brain relative to the original black background is random), most of the images obtained after the cutting process are rectangular. To ensure that the training input is uniform, Information is lost (or noise is introduced) without proportional deformation, and then the processed rectangle is filled into a square. The specific method is to take the longest side of the rectangle as the side length, and fill the short side into the same length to make a square, so as to perfectly avoid changing the proportion when resizing. The performance of this simple and efficient image denoising can be demonstrated through our extensive experimental results.
More specifically, algorithm 3 shows the detail process for both the audio-based and PET-based image denoising.
[!h] : algorithm of image denoising[1] initial Spectrogram/Mel-spectrogram/MFCC image, initial PET image denoised Spectrogram/Mel-spectrogram/MFCC image, denoised PET image each initial Spectrogram/Mel-spectrogram/MFCC image Detect points with pixel value<255 Remove the white surrounding frame Cropping the initial image
each initial PET image Detect points with pixel value
Feature learner
As shown in Fig. 3, existing three popular pre-trained image classification models (i.e., ResNet, VGG and EfficientNet) are adopted to perform AD detection. Specifically, for the ResNet model [36], it has two basic blocks (e.g., Conv Block and Identity Block). The input and output dimensions of Conv Block are different, so they cannot be concatenated consecutively. Its role is to change the dimensions of the network; Identity Block has the same input dimension and output dimension, which can be concatenated to deepen the network. In fact, the ResNet model is also a kind of deep convolution. On the basis of deepening the network, residual unit is introduced to reduce and solve the problem of network degradation when training deep network to a certain extent.
For the VGG model [37], it contains 19 hidden layers (e.g., 16 convolution layers and 3 full connection layers). The structure of VGG network is very consistent, they adopt 3x3 convolution and 2x2 max pooling throughout the whole framework.
For the EfficientNet model [42] which was presented by Google. The interior of EfficientNet model is realized through multiple MBConv convolution blocks with DropConnect module. The difference between DropConnect and Dropout is that in the process of training the neural network model, it does not randomly discard the output of hidden layer nodes, but randomly discards the input of hidden layer nodes.
Ensemble learner
As Fig. 3 illustrates, two different ensemble strategies (i.e., hard voting and soft voting) to predict the final label (e.g., AD, MCI, HC) are adopted. For the hard voting strategy, the final label can be classified using majority voting. For the soft voting strategy, the average value of the probability that all three models (i.e., ResNet, VGG, and EfficientNet) prediction samples belong to a certain category is taken as the final label.
In this section, the performance of our proposed framework PEADD will be investigated, including datasets description, experimental settings and results analysis.
Datasets
This paper conducts our experiments on the two benchmark AD datasets. One is the audio-based AD dataset, and the other is PET-based AD dataset. The audio-based AD dataset consists of audio from three kinds of people, e.g., AD, MCI and HC (Healthy Contrast) released by the AD contest group in the 16th National Conference on Man-Machine Speech Communication (NCMMSC 2021).2
Statistics of the two AD datasets
The cookie theft picture.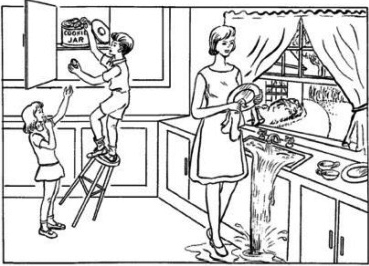
The librosa4
Baselines for audio-based AD detection
following five baseline models for audio-based AD detection are adopted in the experiment. The baseline 2 to baseline 5 won the top 4 of the audio-based AD contest in the NCMMSC 2021. Since the training and testing set splitting are same, this work just report their performance directly.
Baseline 1
The organizer of the AD contest group in the NCMMSC 2021 conference released the official baseline Ncmmsc2021_baseline_svm.5
Baseline 2
Yuan et al. [39] adopt wav2vec in a fine-tuning framework to conduct AD detection. They split the longer audio into many 6-second sections, and obtained the best 3-way classification performance in the audio-based AD contest.
Baseline 3
Hui et al. [40] proposed a cross-voting based feature selection (CVFS) to detect AD which can reduce over-fitting issue in current machine learning framework. They obtained the second place in the audio-bsed AD contest.
Baseline 4
Zhen et al. [41] proposed a temporal convolutional network (TCN)-based AD detection model TCN_SE_SpatialDroupout which can effectively integrate a novel structure residual block and self-attention mechanism.
Baseline 5
Liu et al. [42] proposed a convolutional neural network (CNN)-based AD detection model CNN_AD based on audio features and multi-feature fusion, along with ensemble learning strategy.
Baseline 6
Alić et al. [43] and Veljović [44] proposed a similar artificial neural network (ANN) based framework to predict metabolic syndrome and antimicrobial activity for new compounds, respectively. The only difference exists in the number of neurons (i.e., 14 neurons in paper 2 and 26 neurons in paper 4), donating as ANN_14 and ANN_26, respectively.
Baselines for PET-based AD detection
Following four baseline systems for the PET-based AD detection are adopted in the experiment.
Baseline 1
The official ResNet-34 baseline PET-baseline for the PET-based AD detection contest.6
Baseline 2
VGG (Visual Geometry Group) [36] adopts many small convolution kernel instead of using using a large convolution kernel, which has more activation functions, richer features and stronger discrimination ability. The VGG-19 is adopted as a baseline model.
Baseline 3
ResNet [37] is a modified version based on VGG through adding residual unit, solving the problem of network degradation when training deep network. The ResNet-50 is adopted as a baseline model.
Baseline 4
The EfficientNet [38] adopts NAS (Neural Architecture Search) technology to search the reasonable configuration of three parameters (e.g., image input resolution, network depth depth and channel width). It obtains better performance compared with VGG and ResNet on many tasks. The EfficientNet-b8 is adopted as a baseline model, along with iterative fine tuning and 5-cross validation strategy.
Baseline 5
The ANN_14 and ANN_26 based models in Alić et al. [43] and Veljović [44], respectively.
Evaluation metrics
Similar to existing literature, this paper will investigate the performance of our proposed framework and other comparing models in terms of accuracy, precision, recall and F1-score.
Results on audio-based AD detection
Table 2 shows the performance of 3-way AD detection using different modalities with different base learners. Since the testing set are same, the results of baselines are directly taken from their paper, respectively. It can be seen that the performance of image modality outperforms the speech modality, which indicates the efficiency of the context-enriched image instead of the context-free audio matrix. In addition, following observations can be obtained.
The efficiency of 3-way AD detection using different modalities with different base learners on the audio dataset
The efficiency of 3-way AD detection using different modalities with different base learners on the audio dataset
For the speech modality, Mel-spectrogram outperforms other two features (i.e., Spectrogram and MFCC). Compared with MFCC image, it can be seen that spectrogram form pixels have more information (features) and less noise, which can be better learned by the model. The frequency spectrum image (Mel-spectrogram) after performing Mel filtering is further processed to remove some noise, making Mel-spectrogram easier to learn, obtaining the best performace as shown in Fig. 6. Also, the combination of different speech features can improve the AD detection performance due to different function can be extracted from audio.
Image modality of three different audio-based features. For the three base learners (i.e., ResNet-50, VGG-19, EfficientNet-b8), EfficientNet-b8 obtains the best performance. The reason is that the EfficientNet increases the network width, network depth and input network resolution simultaneously. The EfficientNet can adjust the parameters in width, depth, image resolution and scaling coefficient at the same time, which improves the accuracy compared with the single improvement (e.g., ResNet or VGG). The performance improvement of image denoising is very efficient, which can obtain the performance increment from 5% to 10%. In fact, the denoised image through removing the white frame surrounding the original Mel-spectrogram can reduce the noise of the initial image.
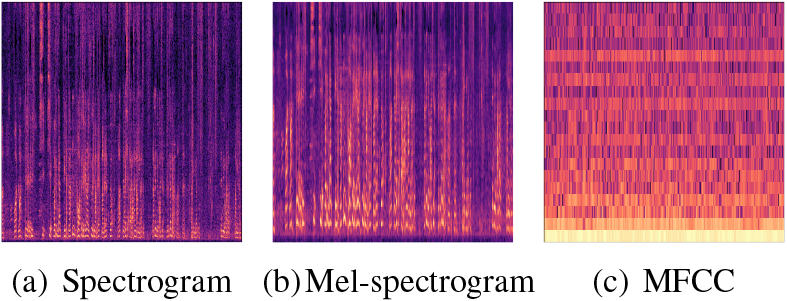
Table 3 shows the performance of all systems on the audio-based AD testing set. It can be seen that our model outperforms all the state-of-the-art approaches in terms of accuracy metric. Among the six baseline systems, the ANN-based baseline performs the worst, the SVM-based baseline performs second-to-last, and other four deep learning-based models obtain comparable performance. Since all of the four deep learning-based models adopt the context-free audio matrix instead the image as the input modality, our image modality based model performs better than these models. It is strange that the ANN with audio-based feature performs better than with Mel-spectrogram denoising feature. The potential reason is that ANN only has a single channel which is quite different with three channels (e.g., RGB) within a CNN, resulting in performance degradation. In addition, among the two voting methods, the hard voting is better than soft voting. For this audio-based AD dataset, the basic model prediction error is mainly in AD and MCI, which has a strong bias. In this case, it may be one of the reasons for hard voting integration to achieve better results since it integrates a violent solution in the algorithm.
Audio-based AD detection results
PET-based AD detection results
The confusion matrix of our best model on the audio-based dataset.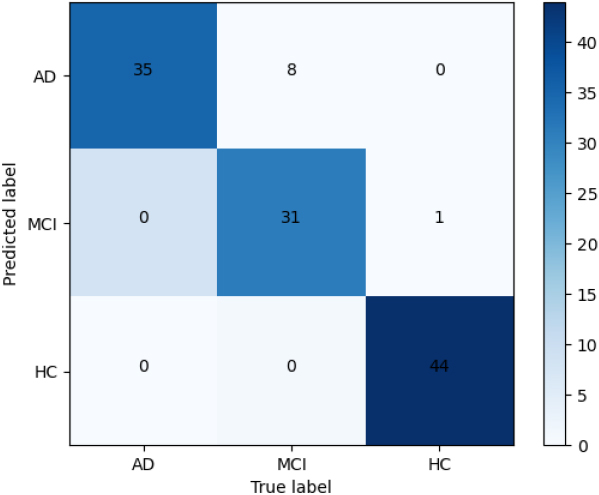
Figure 7 shows the confusion matrix of our best performance. It can be seen that all AD can be successfully detected by our model. Only 1 HC is mis-classified to MCI. Since the MCI is much more closer to AD, 8 MCI is mis-classified to AD. Therefore, the performance of MCI detection improvement should be one of our future work.
Results on PET-based AD detection
Table 4 shows the performance of all systems on the PET-based AD dataset. It can be seen that our model significantly outperforms all the state-of-the-art approaches in terms of accuracy metric. All the three pre-trained baseline models (i.e., VGG-19, ResNet-50,EfficientNet-b8) obtain comparable high performance. Again, the denoised PET image performs better than the initial PET image. Since the three pre-trained base learners obtain quite similar performance on the denoised PET image, therefore hard voting and soft voting obtain similar performance.
Figure 8 shows the confusion matrix of our best performance. Similarly, it can be seen that only 1 AD is mis-classified to MCI, 2 AD is mis-classified to HC, 1 MCI is mis-classified to AD, and 6 HC is mis-classified to MCI. Our model obtains better performance on the PET-based AD detection compared with audio-based AD detection.
The confusion matrix of our best model on the PET-based dataset.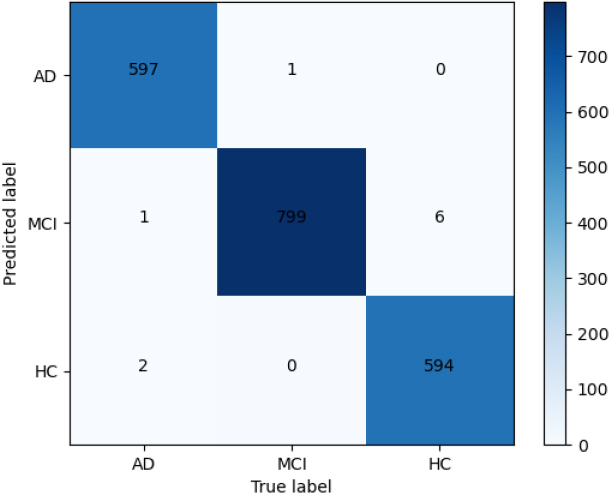
Limitations
This work has two limitations as following.
(1) Limited generalizability: Our experiments were conducted on specific datasets and may not fully represent the characteristics of other Alzheimer’s disease detection scenarios or platforms. Generalizability to different datasets and languages needs to be further explored. (2) Absence of real-time evaluation: Our evaluation primarily focused on offline performance measures, and we did not consider real-time or dynamic evaluation scenarios. Future work should investigate the model’s performance in real-time Alzheimer’s disease detection settings.
Deployment
For the practical using of our method or deployment, a PET image or a phonetic fraction collected from candidates can be fed into our proposed end-to-end Alzheimer’s disease detection model directly. Our model will predict a 3-way (e.g., AD, MCI, HC) classification results.
Conclusions and future work
This work proposed using three pre-trained image classification base learners (i.e., ResNet, VGG, and EfficientNet) to create ensembles for both audio-based and PET-based AD simultaneously under a unified image modality. We examined the effectiveness of context-enrichedl image modality instead of the traditional context-free audio matrix for the audio-based AD detection. In addition, different voting methods for applying an ensemble along with simple and effective image denoising strategies are investigated in detail. Experimental results on two benchmark AD datasets demonstrate that our proposed model PEADD significantly outperforms the state-of-the-art methods. In the future, we would like to create ensembles for other supervised AD models, along with different image and audio features.
Footnotes
Acknowledgments
The authors would like to thank anonymous reviewers for their insightful comments on this paper.
Conflict of interest
The authors declare that they have no conflict of interest.
Funding
This research was supported by the National Natural Science Foundation of China under Grants 62162031, 62066020 and 62266023, Key Project of Jiangxi Natural Science Foundation under Grant 20224ACB202010, and Jiangxi Province Degree and Graduate Education Teaching Reform Research Project under Grant JXYJG-2021-056.