
Abstract
BACKGROUND:
The incidence of type 2 diabetes is rapidly increasing worldwide. Studies have shown that it is also associated with cancer-related morbidities. Early detection of cancer in patients with type 2 diabetes is crucial.
OBJECTIVE:
This study aimed to construct a model to predict cancer risk in patients with type 2 diabetes.
METHODS:
This study collected clinical data from a total of 5198 patients. A cancer risk prediction model was established by analyzing 261 items from routine laboratory tests. We screened 107 risk factors from 261 clinical tests based on the importance of the characteristic variables, significance of differences between groups (
RESULTS:
Compared with 16 machine learning classifiers, five classifiers based on the decision tree algorithm (CatBoost, light gradient boosting, random forest, XGBoost, and gradient boosting) had an area under the receiver operating characteristic curve (AUC) of
CONCLUSION:
The constructed model can predict the risk of cancer in patients with type 2 diabetes based on tumor biomarkers and routine tests using machine learning algorithms. This is helpful for early cancer risk screening and prevention to improve patient outcomes.
Introduction
Over the past two decades, the incidence of type 2 diabetes and its complications have rapidly increased worldwide, accounting for 90% of all diabetes cases [1]. As this trend continues, the incidence of cancer among patients with type 2 diabetes has increased significantly [2]. A number of large-scale epidemiological studies and meta-analyses have demonstrated that type 2 diabetes is associated with the development of various cancers, including pancreatic, colorectal, thyroid, esophageal, and gynecological cancers [3, 4, 5, 6, 7]. Moreover, research indicates that this association may be attributed to hyperglycemia and hyperinsulinemia [8]. Since different cancers have different manifestations and characteristics, they are difficult to identify in patients with diabetes through routine screening. If one can comprehensively analyze and fully utilize the relevant laboratory indicators in patients with type 2 diabetes, the risk of cancer in patients with type 2 diabetes can be predicted.
Machine learning, an important field of artificial intelligence, is a general term for a class of algorithms that can learn from numerous datasets to predict the characteristics of new samples and perform required tasks [9]. A previous study by Choudhury [10] demonstrated the effectiveness of artificial intelligence algorithms in evaluating the early diagnosis and prognosis of tumors. Furthermore, artificial intelligence has been shown to assist greatly in cancer screening even when using the clinical data of patients alone [11]. Compared to traditional statistical methods, machine learning performs more objectively in classification and prediction, with better classification results. Currently, there are various machine learning algorithms based on different weak learners, such as logistic regression, naive Bayes, support vector machines, and decision tree classifiers. A previous study found that a sub-discipline of machine learning requiring less user input but more data and processing power has provided great promise in assisting physicians in achieving accurate diagnoses [12]. Furthermore, classifiers such as the multilayer perceptron (MLP), random forest (RF), and decision tree (DT) can accurately predict the survival of patients with cancer [13]. More and more machine learning methods have been applied in cancer diagnosis and prognosis and have shown great potential [14, 15, 16].
This study aimed to establish a machine-learning prediction model by selecting important features and predicting the risk of cancer in patients with type 2 diabetes based on tumor markers and other routine laboratory tests.
Materials and methods
Sample information
The data for this study were collected from June 2013 to September 2022 from all hospitalized patients diagnosed with type 2 diabetes at the Shaanxi Provincial People’s Hospital. This study was approved by the Ethics Committee of the Shaanxi Provincial People’s Hospital. All participants were fully informed about the study and provided written informed consent.
Of the 100120 cases, 9352 (9.34%) were patients with cancer. According to statistics, the cancer types mainly included intestinal (20.4%), lung (16.2%), prostate (9.9%), breast (8.4%), liver (8.1%), gastric (6.9%), bladder (5.2%), pancreatic (4.9%), bone (4.6%), lymphoma (4.0%), kidney (2.5%), ovarian (1.8%), esophageal (1.7%), thyroid (1.4%), cervical (0.9%), leukemia (0.8%), glioma (0.7%), thymoma (0.7%), nasopharyngeal (0.3%), and pituitary (0.2%) cancer, comprising 20 different types of cancer (Fig. 1).
Percentages of 20 different types of cancer in this study.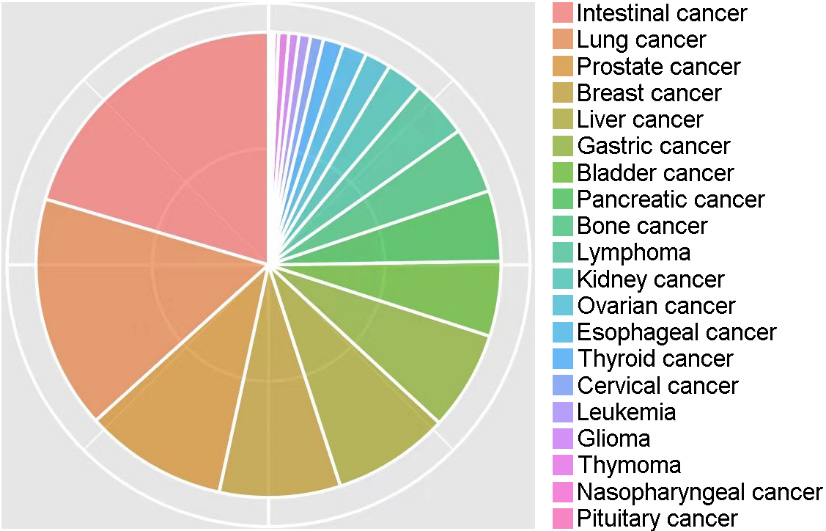
Missing value control and filling
A total of 1381 variables of relevant clinical data were extracted. Variables with missing values exceeding 50% in the both groups were gradually excluded. Patients were excluded if the missing value rate exceeded 20%. Adjacent individual values were used for quantitative variables. For categorical variables, missing values were randomly filled in using the proportion of categories.
Data matching
The K-means algorithm cluster matching method was used to match the data of the cancer and non-cancer groups based on age and sex. The basic method of cluster matching is to use the K-means algorithm to cluster the observation group into different subgroups and obtain the grouping rules. According to grouping rules, control patients were grouped based on the lowest value of the same type ratio (1:1) as cases [20].
Feature selection
Feature selection methods are used to remove redundant features from all available features to improve the efficiency of machine-learning models and reduce overfitting. Important feature combinations were effectively identified and validated by combining significance tests (
The MDL algorithm considers each relevant variable as a simple predictive model and compares and scores these individual models using their respective MDL measures to determine the relevant variables. The formula used was: Si (Modeli, D)
Ultimately, the following criteria were used to select important features (laboratory indicators) for modeling: 1) features discovered by the feature selection algorithm are preferred features; 2) selected features should cover as many different aspects of routine checks as possible, such as blood routine, liver and kidney function, and electrolytes; 3) selected features should be as independent of each other as possible, i.e., they should reduce multicollinearity and multivariate correlation as much as possible; 4) the number of features should be proportional to the amount of data; and 5) medical expertise and practical experience should be considered.
Construction of the machine-learning predictive model.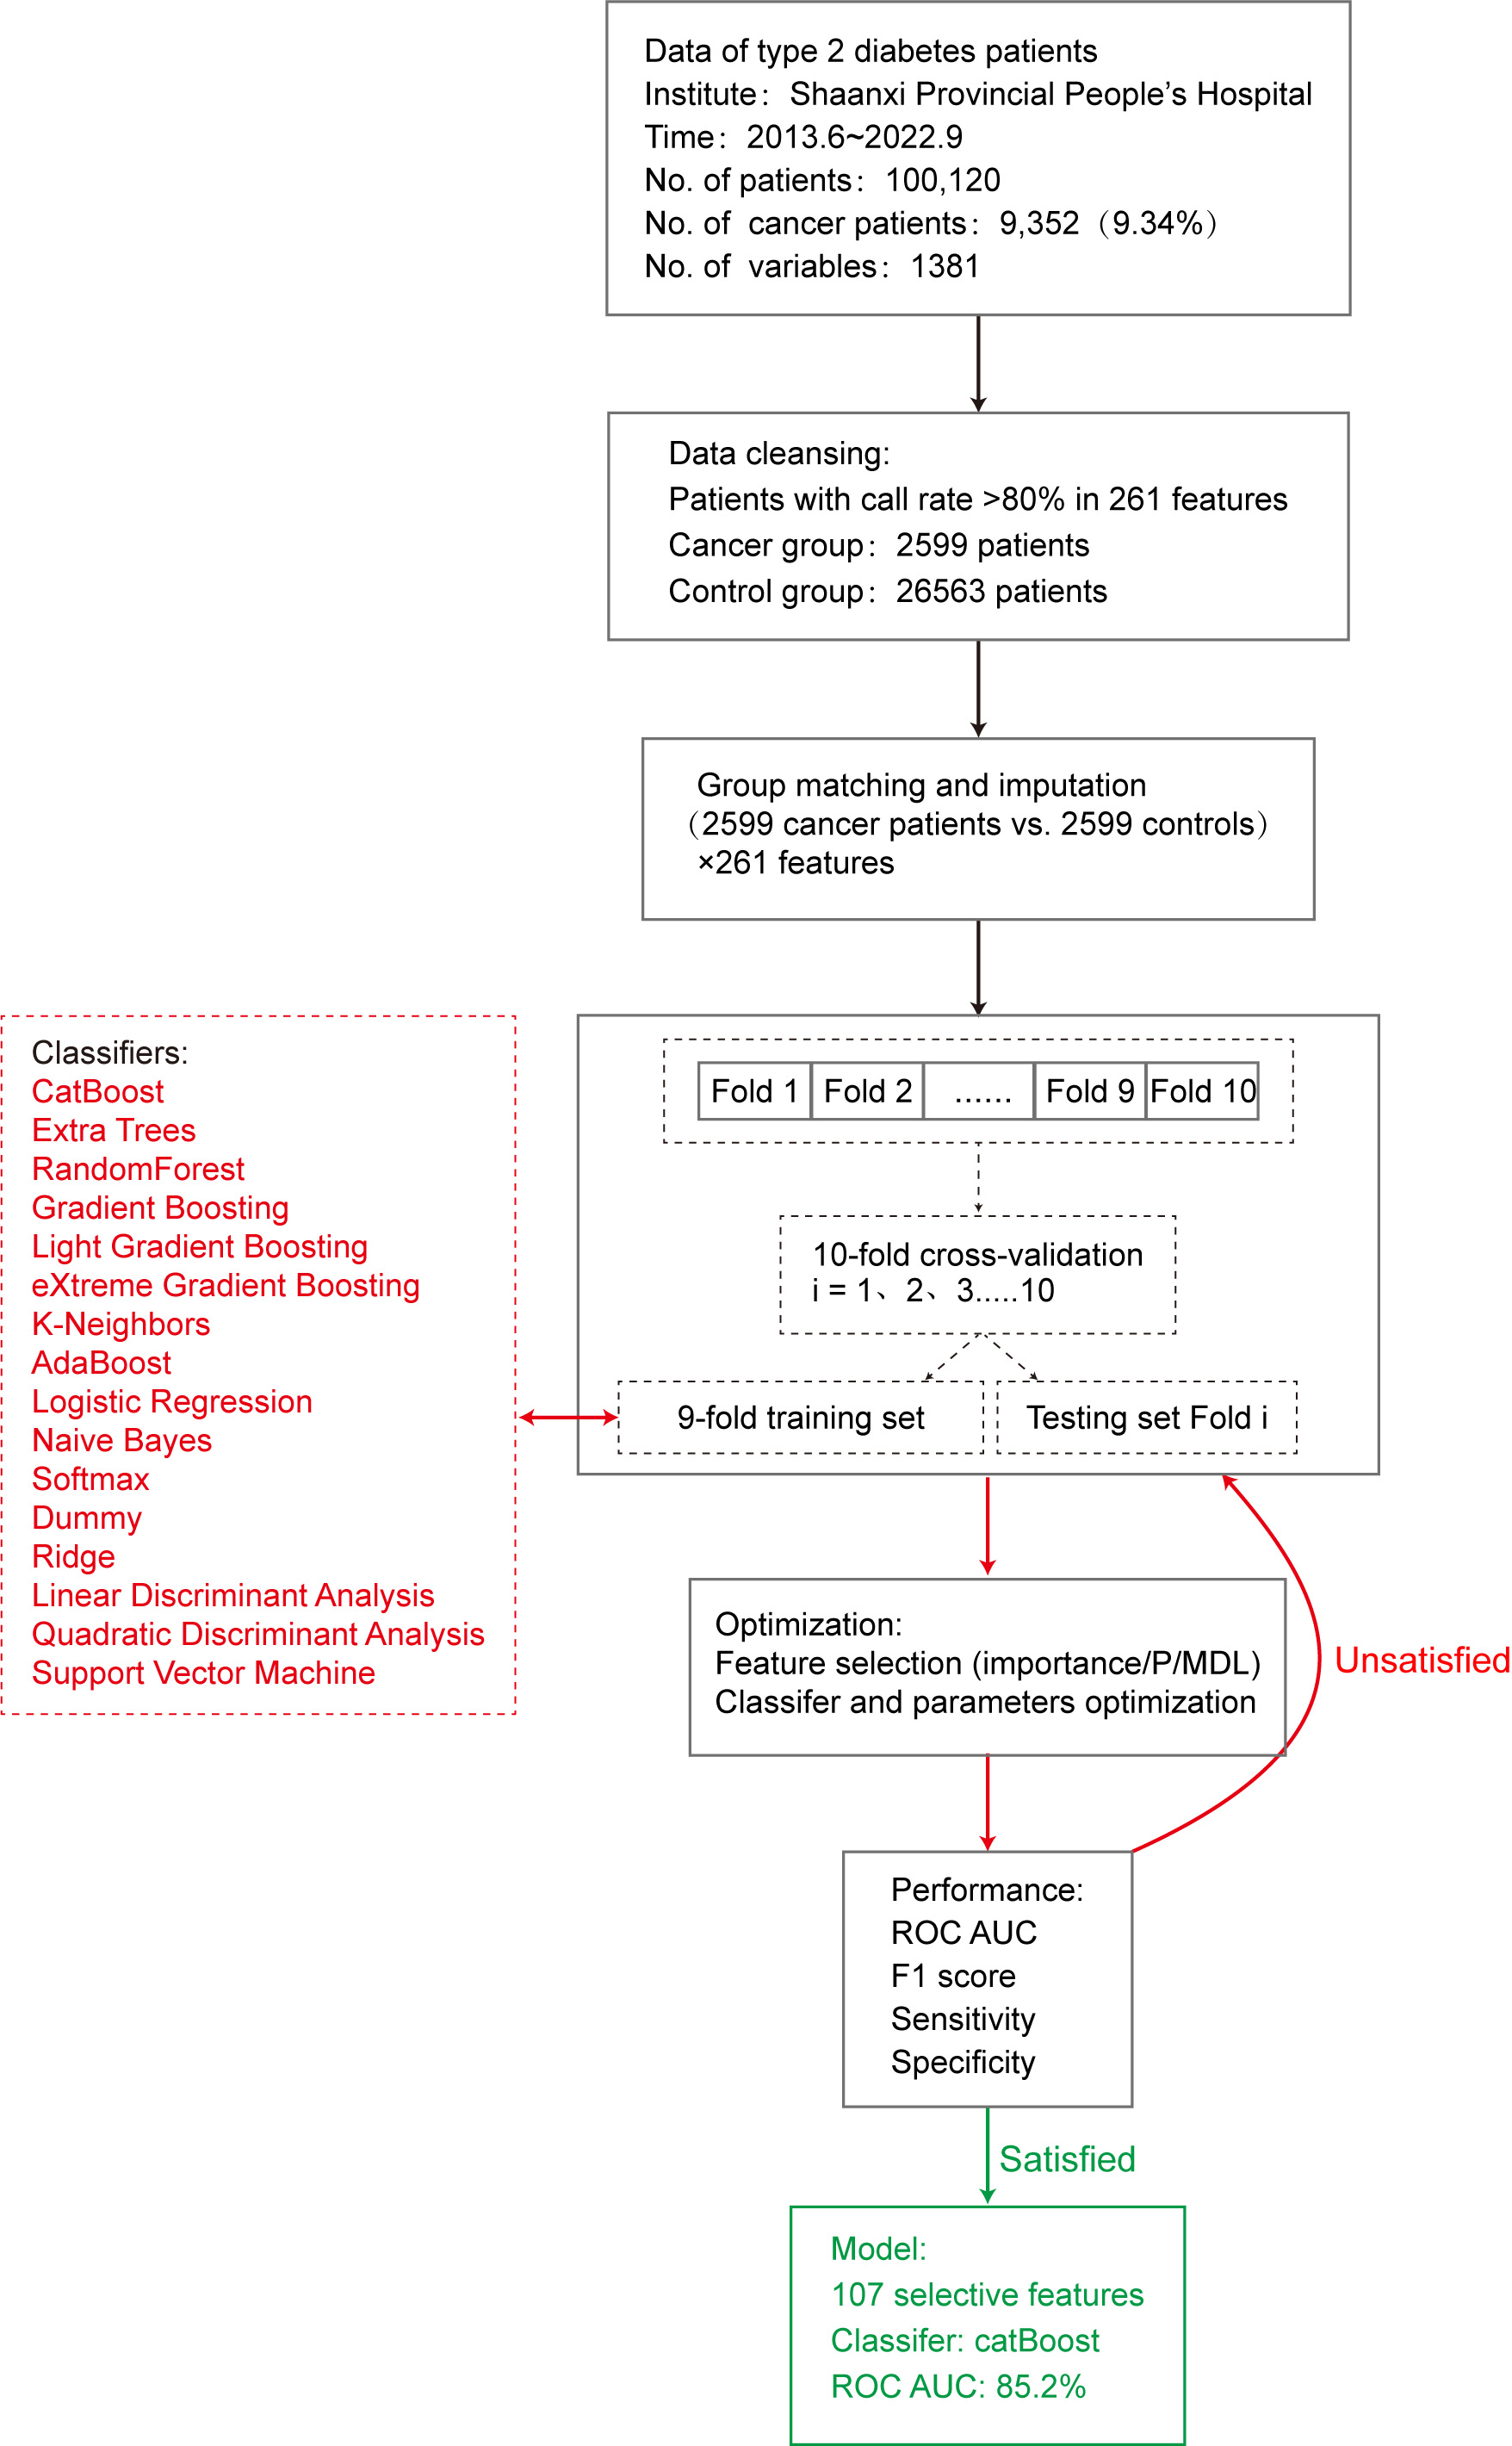
This study used 16 machine learning algorithm classifiers, including logistic regression, softmax, and dummy classifiers based on the principles of logistic regression, linear discriminant analysis, quadratic discriminant analysis, ridge, support vector machine (SVM), k-neighbors, naive Bayes, and decision tree classifiers such as random forest, adaptive boosting (AdaBoost), CatBoost, extra trees, light gradient boosting, gradient boosting, and extreme gradient boosting (XGBoost). Figure 2 shows the specific modeling process using the 10-fold cross-validation method with 90% of the data as the training set and 10% as the test set. The following is a brief introduction to different types of classifiers.
Logistic regression
Logistic regression [22] estimates the probability of an event occurring by fitting the data to a sigmoid function. For probability values between 0 and 1, a prediction of 1 was made when the probability was greater than 0.5, whereas a prediction of 0 was made when the probability was less than 0.5. The R
Linear discriminant analysis
Linear discriminant analysis and quadratic discriminant analysis have similar algorithmic features and can determine whether to use a quadratic model based on whether the covariance matrices of different classification samples are the same. Ridge regression is based on the principle of least squares and has practical value for overcoming the problem of feature collinearity by simultaneously imposing regularization constraints on each feature coefficient.
Naive Bayes
The naive Bayes model [23] is based on the Bayesian theorem of conditional independence, which assumes that each input variable can be independently estimated as a one-dimensional variable. The posterior probability distribution is calculated for a given test set by learning the prior and conditional probability distributions from the training dataset. The classification with the maximum posterior probability is the result. In this study, the naive Bayes function in the klaR package was used to build the prediction model.
SVM
SVM [24] can theoretically achieve optimal classification of linearly separable data. Their basic model defines a linear classifier with the maximum margin in the feature space, which can be transformed into a convex quadratic programming problem to be solved. The SVM function in the e1071 package in R
Decision tree
Various classifiers based on decision trees have been developed, including random forest, AdaBoost, and gradient boosting. Random forest [25] is a bagging ensemble algorithm based on the decision tree algorithm, which separately models each sample using resampling methods to generate multiple decision trees. The result is the mode of the predicted result. Overfitting is less likely to occur owing to the characteristics of random forests. The model was built using the importance function, replicate function, and random forest function in randomForest
AdaBoost is a representative boosting ensemble algorithm. It iteratively trains weak classifiers (usually decision trees), and assigns higher weights to misclassified samples from the previous layer of weak classifiers during training. The dataset was redefined for training, and the results were obtained by weighting each weak classifier. The model was built using the boosting function in the adabag package of R
Gradient-boosting ensemble algorithms, such as CatBoost and XGBoost, achieve accurate classification results through iterative calculations of weak classifiers and aggregates the conclusions of multiple decision trees as the final prediction result. It is suitable for running large-scale data; however, its computation is relatively time-consuming.
Evaluation of prediction models
Following completion of model construction, the model performance was evaluated. In this study, 10% of data randomly selected from the original queue data was used as the test set to evaluate the classification performance of the model using parameters such as accuracy, sensitivity, specificity [26], and F1 score [27]. In addition, we used the area under the curve (AUC) of the receiver operating characteristic (ROC) curve [28] to evaluate model efficiency. The AUC of the ROC is between 0 and 1, and the closer the AUC value is to 1, the better the classification performance of the model.
Results
Preliminary model performance
To construct the model, the cancer group included cases diagnosed with type 2 diabetes and various types of cancer (excluding heart disease, kidney disease, hypertension, arteriosclerosis, and hyperlipidemia). A total of 2599 patients with 261 routine clinical laboratory indicators were included, with a detection rate of
To predict the possibility of cancer occurrence in patients with type 2 diabetes, we introduced 16 machine learning classifiers and constructed and evaluated a risk prediction model for cancer in patients with type 2 diabetes using 5198 patients with 261 clinical variables. First, all 261 feature variables were included in the model and the accuracy of the 16 classifiers varied from 0.508 (dummy) to 0.739 (CatBoost). The AUC values ranged from 0.530 to 0.818. To further improve model performance and reduce the impact of possible overfitting on classification performance, we conducted a feature selection process.
Feature selection
We extracted 107 important features through a comprehensive comparison of differences in
Statistics and importance of the 107 selected features
Statistics and importance of the 107 selected features
By continuously adding feature variables and testing classifier performance, we found that the model classification performance peaked when 107 feature variables were used. The mean AUC values of the top 10 classifiers was 0.770 (0.691–0.852), as shown in Fig. 3.
Change of ROC AUC curve along with gradually added features.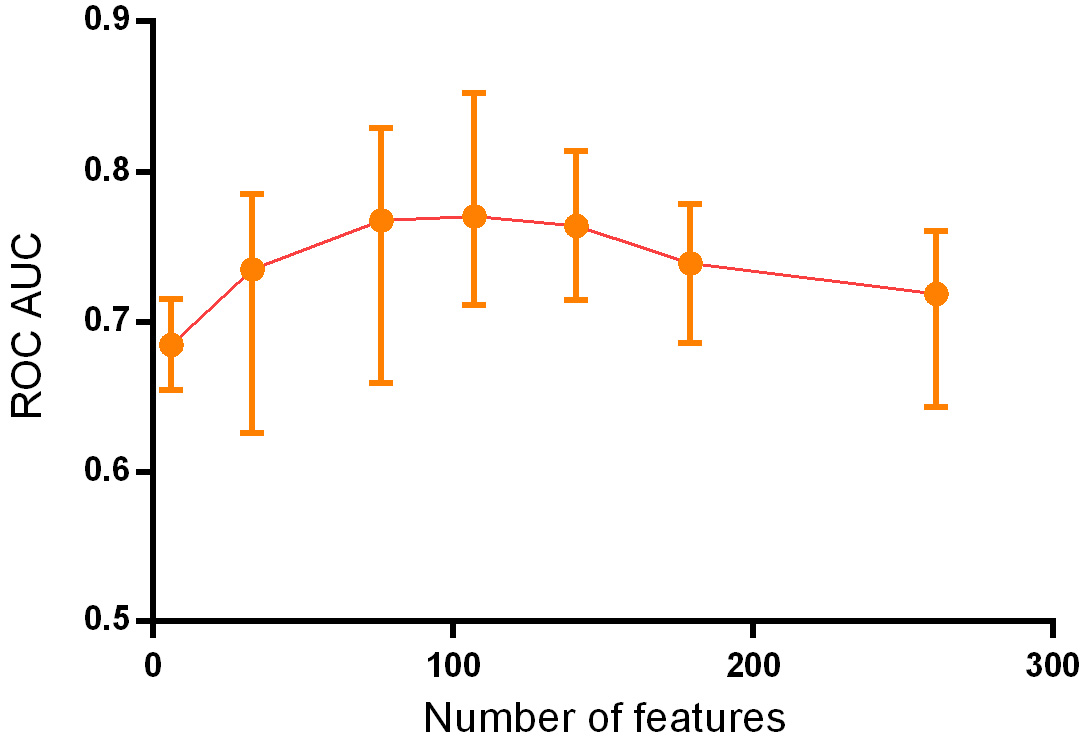
Parameters of the five best classifiers
Based on the principle of decision trees, the five best classifiers were obtained: random forest, CatBoost, light gradient boosting, gradient boosting, and XGBoost models, as listed in Table 2. The AUC values of the five classifiers were all
ROC curves of the five superior classifiers.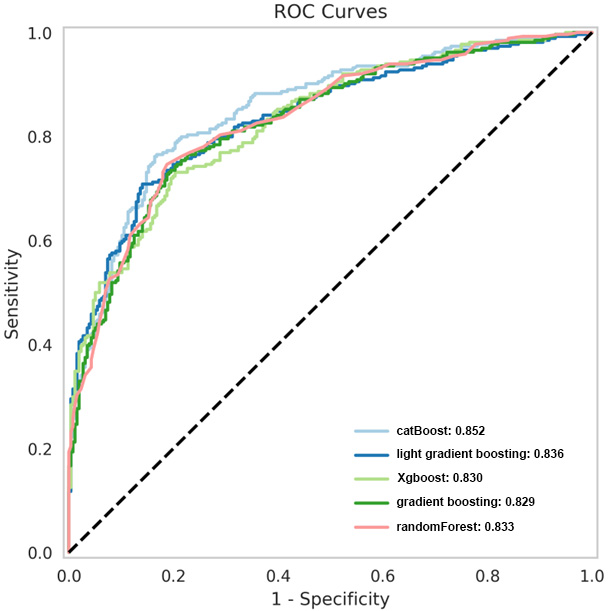
Many studies have been conducted on cancer complications in patients with type 2 diabetes. The main mechanisms by which diabetes increases the risk of cancer are as follows: 1) Diabetes and cancer share common risk factors, such as family history (genetics), obesity, high-calorie diet, smoking, and alcohol consumption. 2) High blood glucose in patients with diabetes leads to a decrease in insulin sensitivity, compensatory hyperinsulinemia, and elevated levels of insulin-like growth factor (IGF). High concentrations of growth factors activate insulin receptors, thereby activating the insulin/IGF axis signaling pathway, which, in turn, activates signaling pathways to promote the proliferation and metastasis of cancer cells. 3) Long-term hyperglycemia provides sufficient energy for cancer cell proliferation, which can cause oxidative stress and promote cancer cell proliferation [17, 18, 19, 20]. Many studies have shown that diabetes increases the risk of liver, breast, throat, endometrial, bladder, and kidney cancers. A large study in the United States demonstrated that the risk and type of cancer in patients with type 2 diabetes varies by sex and organ system [19]. These studies do not completely agree on the results of cancer in different organ systems, and the disparities may be due to differences in patient populations, regions, course of disease, and selected analysis factors.
Currently, early screening for cancer is mainly based on a comprehensive evaluation of medical history, family history, imaging data, and blood tumor markers. Imaging diagnosis still requires a subjective assessment by a doctor, but omissions or misjudgments can occur. Blood tumor markers are one of the most commonly used screening methods for early-stage cancer. However, high levels are only present in some patients, and sensitivity is lacking in patients with low concentrations [21]. The diagnosis of cancer using a single test method has limitations, while comprehensive judgment based on clinical data extraction has great advantages. A previous study by Sharma et al. indicated that including data such as age, blood glucose level, and weight change in the model could predict the cancer risk of patients with diabetes and achieved good results with a sensitivity of 78%, specificity of 80%, and AUC of 0.87 [22]. In addition, a British study showed that models including age, BMI change, smoking, diabetes medication, proton pump inhibitors, hemoglobin, total cholesterol, and other indicators could predict the occurrence of pancreatic cancer in high-risk groups, with a sensitivity of 11%, specificity of 99.7%, and AUC of 0.82 [23]. Moreover, Ben et al. demonstrated that glucose level alone could be used as an indicator of pancreatic cancer risk [24]. We therefore considered that artificial intelligence could be used to extract disease-related data from patients to establish a simple, efficient, and population-adaptable pre-screening model, and subsequently established a prediction model using multiple classifiers and data from patients’ routine clinical tests. This can significantly increase the population participation rate and improve the screening efficiency for the disease, thereby improving patient prognosis.
The present study is similar to Choudhury’s study [10] in that multiple classifiers were used to construct models based on clinical data for early cancer diagnosis. Classifiers include MLP, voted perceptron, Clojure classifier, kernel logistic regression, stochastic gradient descent, AdaBoost, Hoeffding tree, and a primal estimated sub-gradient solver for support vector machines (s-Pegasos) [10]. In Choudhury’s study, the classification accuracy of AdaBoost was 71.29%, which was better than that of the other algorithms. However, the diagnostic efficiency obtained in our study differed because the number and category of indicators entered into the model were different. This study used 261 clinical characteristic variables and 16 machine learning algorithms based on the optimal combination of 107 characteristics to establish a prediction model. Our study used blood tumor markers as the main input, combined with routine blood, liver and kidney function, and other routine laboratory tests to establish a more sensitive and specific prediction model. In our study, the AUC values were all
The 16 machine-learning algorithms used in this study are commonly used in many research projects, and different algorithms have different advantages and disadvantages owing to their different principles. The random forest model performed well in this study because of its randomness, which makes it less prone to overfitting and able to handle high-dimensional input samples without dimensionality reduction, thereby achieving an AUC of 0.833. In addition, boosting algorithms are mainly divided into AdaBoost and gradient-boosting decision trees, with the CatBoost and XGBoost algorithms optimized based on a gradient boosting decision tree and known for their parallel computing and ability to simulate nonlinear effects, achieving high efficiency and accuracy in processing large datasets. These optimized algorithms can be applied in future studies to further improve model accuracy and stability. The specificity indicators of the three models (CatBoost, gradient boosting, and random forest) exceeded 80%, whereas the sensitivity indicators of the top five models did not reach 80%, possibly because of the large number of cancer types and relatively insufficient sample size, which made the model less effective for extracting the characteristic features of these patients. This can be improved in the future by increasing the sample size, thereby enabling the model to extract more typical features for modeling different types of cancer. In summary, using the 107 routine examination indicators selected in this study as variables for modeling enabled us to predict a high-risk population of cancer in patients with type 2 diabetes based on routine examination indicators. This can help in early intervention and prevention of cancer in clinical practice.
Conclusion
This study used routine laboratory data from patients with type 2 diabetes to construct a predictive model for cancer risk using 16 machine learning classifiers. The catBoost classifier model displayed good sensitivity and specificity, and could promote early risk screening and cancer prevention, thereby improving patient outcomes. Due to the large number of cancer types, the current number of atients is relatively insufficient to achieve high-efficiency prediction.
Funding
This work was supported by the Key Research and Development Program of Shaanxi Province (2017ZDXM-SF-064), Natural Science Basic Research Project of Shaanxi Province (No.2022JQ-925), and Shaanxi Provincial People’s Hospital Incubation Fund (2021YJY-03).
Supplementary data
The supplementary files are available to download from http://dx.doi.org/10.3233/THC-230385.
Footnotes
Acknowledgments
None to report.
Conflict of interest
The authors declare no conflict of interest.