
Abstract
Background
We investigated the
Methods
RBCs and plasma were collected from 26 patients with type 2 diabetes at first clinical onset and 19 age-matched non-diabetes subjects as controls.
Results
We found that, when compared with controls,
Conclusions
Keywords
Background
In mammals, the arginase pathway is quantitatively most important for
NO plays a critical role in vascular homeostasis. 6 NO can be enzymatically synthesized in a reaction catalysed by NOS. 7 Three isoforms of NOS are described: neuronal NOS (nNOS or NOS1), inducible NOS (iNOS or NOS2) and endothelial NOS (eNOS or NOS3). A mitochondrial NOS isoform (mtNOS) is still under debate. Despite controversy, 8 recent data 9 have shown that NOS3 is expressed in RBCs and is potentially used as vascular source of NO. The non-enzymatic NO synthesis is activated when NO production from NOS is impaired. 10 This alternative route involves nitrite-derived production of NO particularly under ischaemia conditions. 11 Enzyme-independent NO formation has been described both in different tissues 10 and erythrocytes (RBCs). 12
Endothelial dysfunction is accompanied by decreased plasma concentrations of
In the current study, we investigated the
Methods
Subjects
Subjects characteristics.
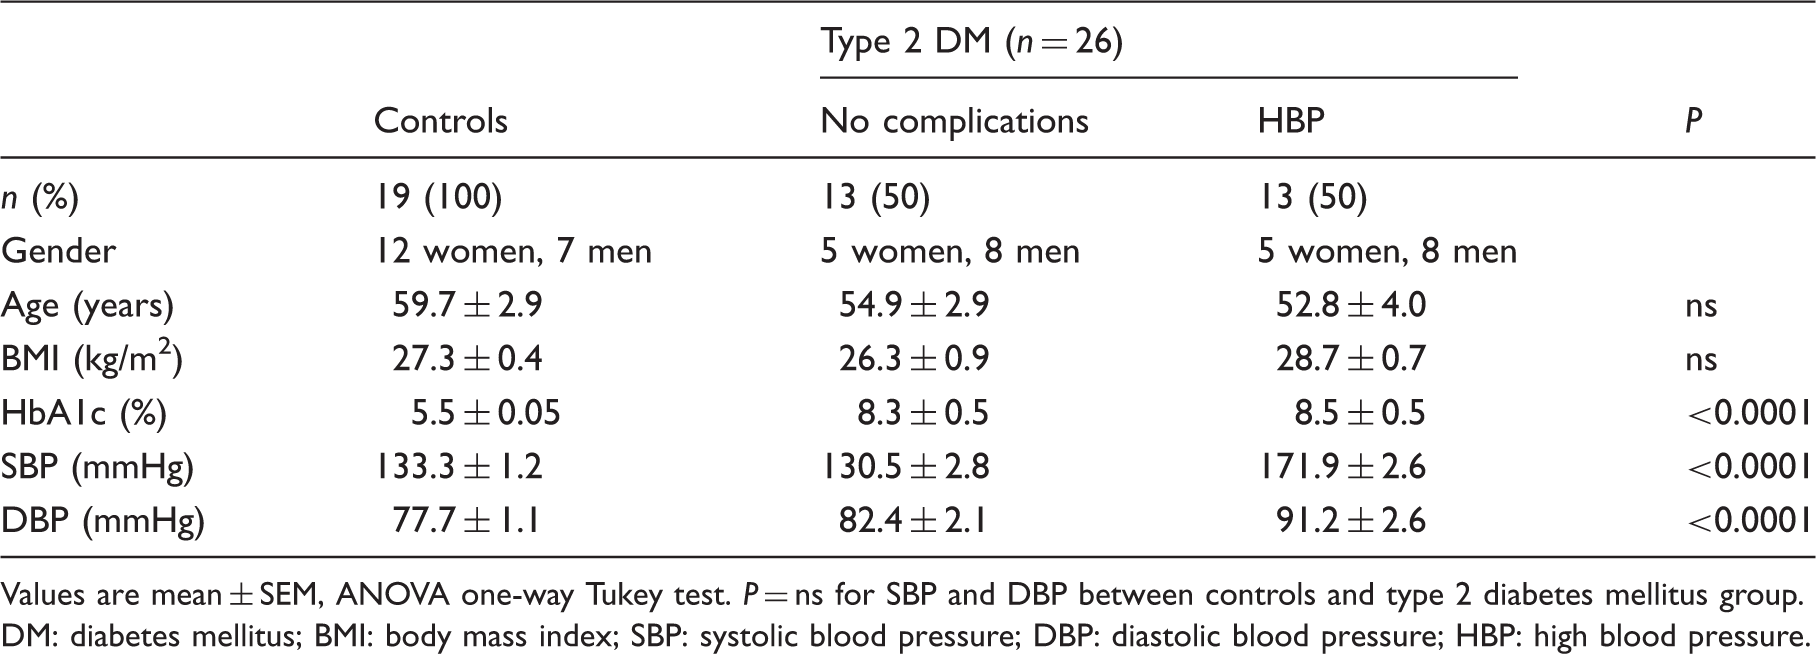
Values are mean ± SEM, ANOVA one-way Tukey test. P = ns for SBP and DBP between controls and type 2 diabetes mellitus group.
DM: diabetes mellitus; BMI: body mass index; SBP: systolic blood pressure; DBP: diastolic blood pressure; HBP: high blood pressure.
Sample processing
Following overnight fasting, blood samples (5 mL) were collected into tubes containing lithium-heparin. After centrifugation (2000 g, 15 min, room temperature [RT]), the plasma was retained on ice, and the remaining RBCs were washed three times with 0.9% NaCl and lysed (1:1) in ultrapure water.
16
The samples were stored at −80℃ until further analysis.
Arginine detection
A stock solution of internal standard (I.S.) homoarginine (1 mmol/L dissolved in 10 mmol/L of HCl) was prepared and stored at −80℃.
17
Work 100 µM homoarginine standards were used for reactions. Plasma (100 µL) was mixed with 50 µL (100 µmol/L) of I.S. homoarginine, and 300 µL of acetonitrile/ammonia (90/10) were then added to precipitate the proteins. After centrifugation (3000 g, 5 min), the clear supernatant was kept.
17
The RBC lysates were mixed with 50 µL (100 µmol/L) of I.S. homoarginine, and the proteins were precipitated with a mixture of chloroform/ethanol (vol/vol, 33.33/66.66).
16
The upper, clear aqueous layer was collected. Both supernatants were then evaporated under a nitrogen stream, and the residues were re-dissolved with 200 µL of ultrapure water and injected into the system.
17
Assay for arginase activity
This was performed based on urea production in the sample. 19 Briefly, RBC lysates or plasma samples (50 µL) were first placed in a mixture containing 0.1 M glycine buffer of pH 9.5, 0.4 M MnCl2 and 1 mM 2-mercaptoethanol. The mixture was then activated by incubation – for 1 h at 37℃. Next, 0.9 M arginine solution, pH 9.5, was added, and the mixture was incubated for 10 min. The reaction was stopped by adding 0.33 mmol/L perchloric acid. The mixture was centrifugated for 15 min at 3500 rotations per minute (rpm). To evaluate the basal urea concentration, a blank solution was prepared by dissolving each sample in a mixture containing 0.1 M glycine buffer of pH 9.5 and perchloric acid 0.33 mmol/L followed by centrifugation – 15 min at 3500 rpm. The urea concentration in each sample supernatant was measured spectrophotometrically by an automatic analyser (Cobas Mira Plus; Roche Diagnostics, Switzerland) at 578 nm by the urease method according to the manufacturer’s recommendations (Dialab, Austria). One unit represents the activity that produces 1 µmol urea for 1 min at 37℃.
Nitrate and nitrite analysis
This was performed in all samples after protein precipitation. Plasma samples (100 µL) were mixed with ethanol (500 µL), and the proteins were precipitated after centrifugation (10,000 g, 15 min, RT). 20 RBC proteins were precipitated with a mixture of ethanol/chloroform, as previously described. 16 Nitrate and nitrite analysis was conducted spectrophotometrically by an assay that combined reduction of nitrate with vanadium (III) and measurement of nitrite in a single step. 20 Reactions were carried out at 37℃, bearing in mind that, at temperatures below 80℃, nitrate reduction by vanadium (III) is suspended following nitrite formation. Griess reagents [N-1-Naphthylethylenediamine dihydrochloride (NEDD) and sulphanilamide (SULF)] (Promega, WI, USA) were used as trapping agents for the simultaneous detection of nitrite and nitrate. Briefly, for standard curve, a nitrate standard solution (50 µL) was serially diluted (from 100 to 5 µM) in duplicate in a 96-well flat-bottomed, polystyrene microtiter plate (Corning, NY, USA). After loading the plate with 50 µL samples, addition of a saturated solution of VCl3 (40 mg in 5 mL HCl 1 M) to each well (50 µL) was immediately followed by addition of SULF 2% in HCl 1 M (25 µL) and NEDD 0.1% in dH2O (25 µL). The samples were then incubated for 40 min at 37℃, and the total nitrite and nitrate (NOx) content was measured spectrophotometrically at 540 nm. The VCl3 solution and the Griess reagents were freshly prepared immediately prior to application to the plate. Sample blank values were obtained by substituting diluting medium for Griess reagent. Nitrite was similarly measured, except that samples and nitrite standards were only exposed to Griess reagents.
HbA1c
HbA1c was assayed by standardized immunoturbidimetry (Cobas Integra; Roche, Switzerland) according to the manufacturer’s recommendations. 21
Statistical analysis
Data analysis was performed using GraphPad InStat software package (GraphPad Software Inc., CA, USA). Differences between groups were computed using ANOVA parametric (Tukey test) or non-parametric tests (Kruskal–Wallis test). A P < 0.05 was considered statistically significant.
Results
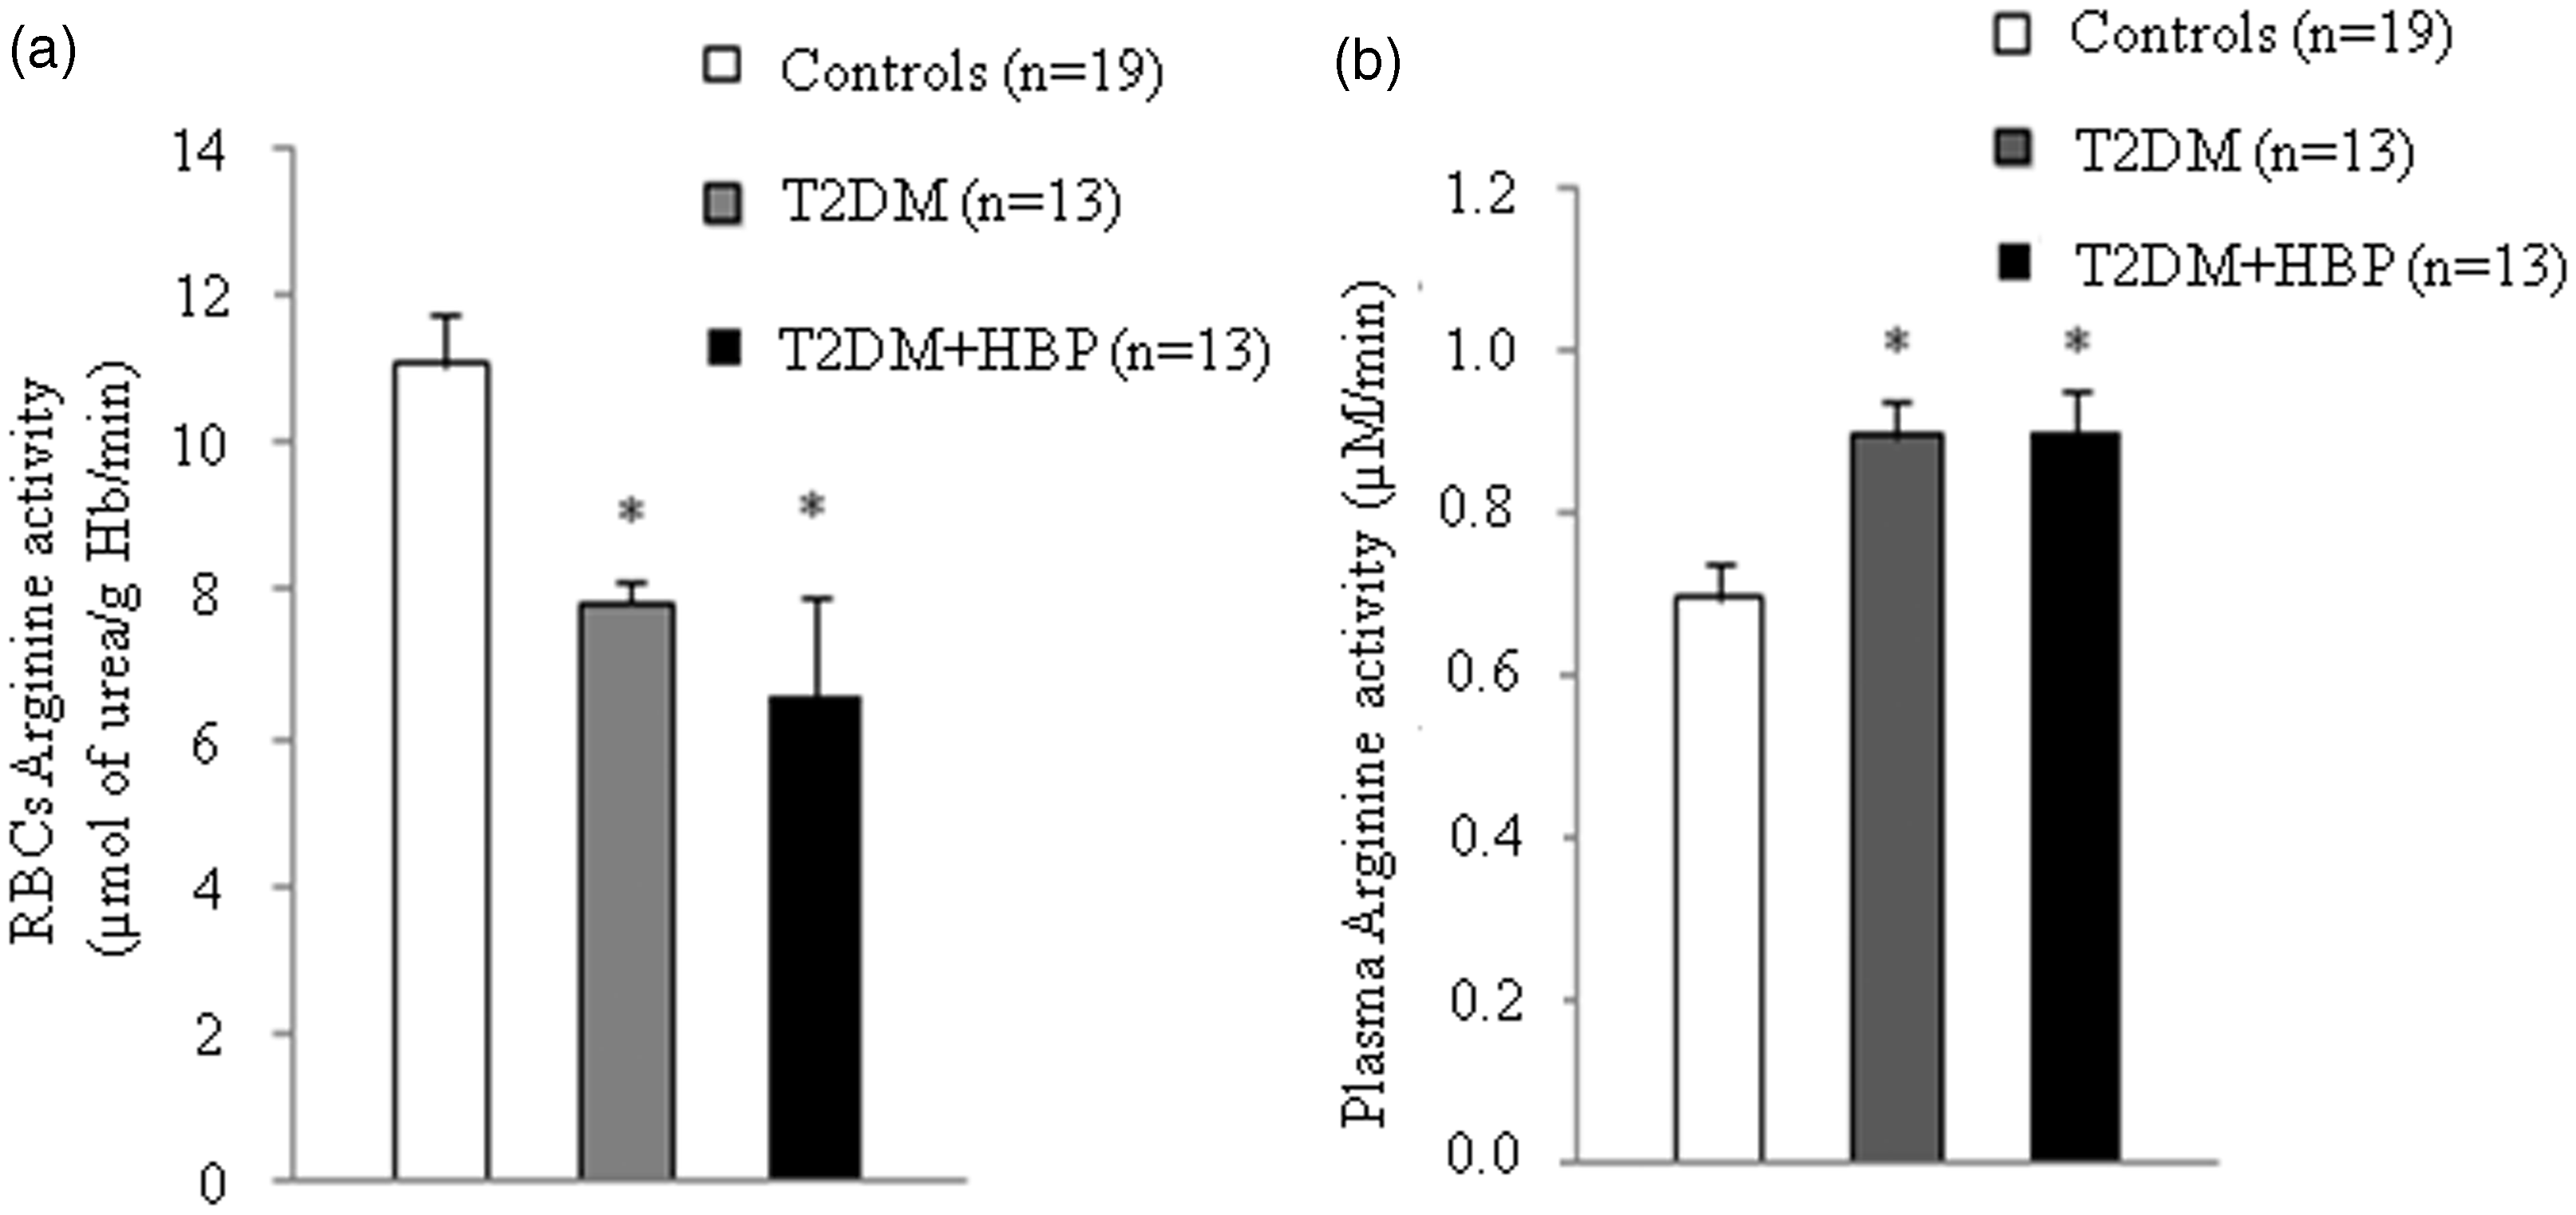
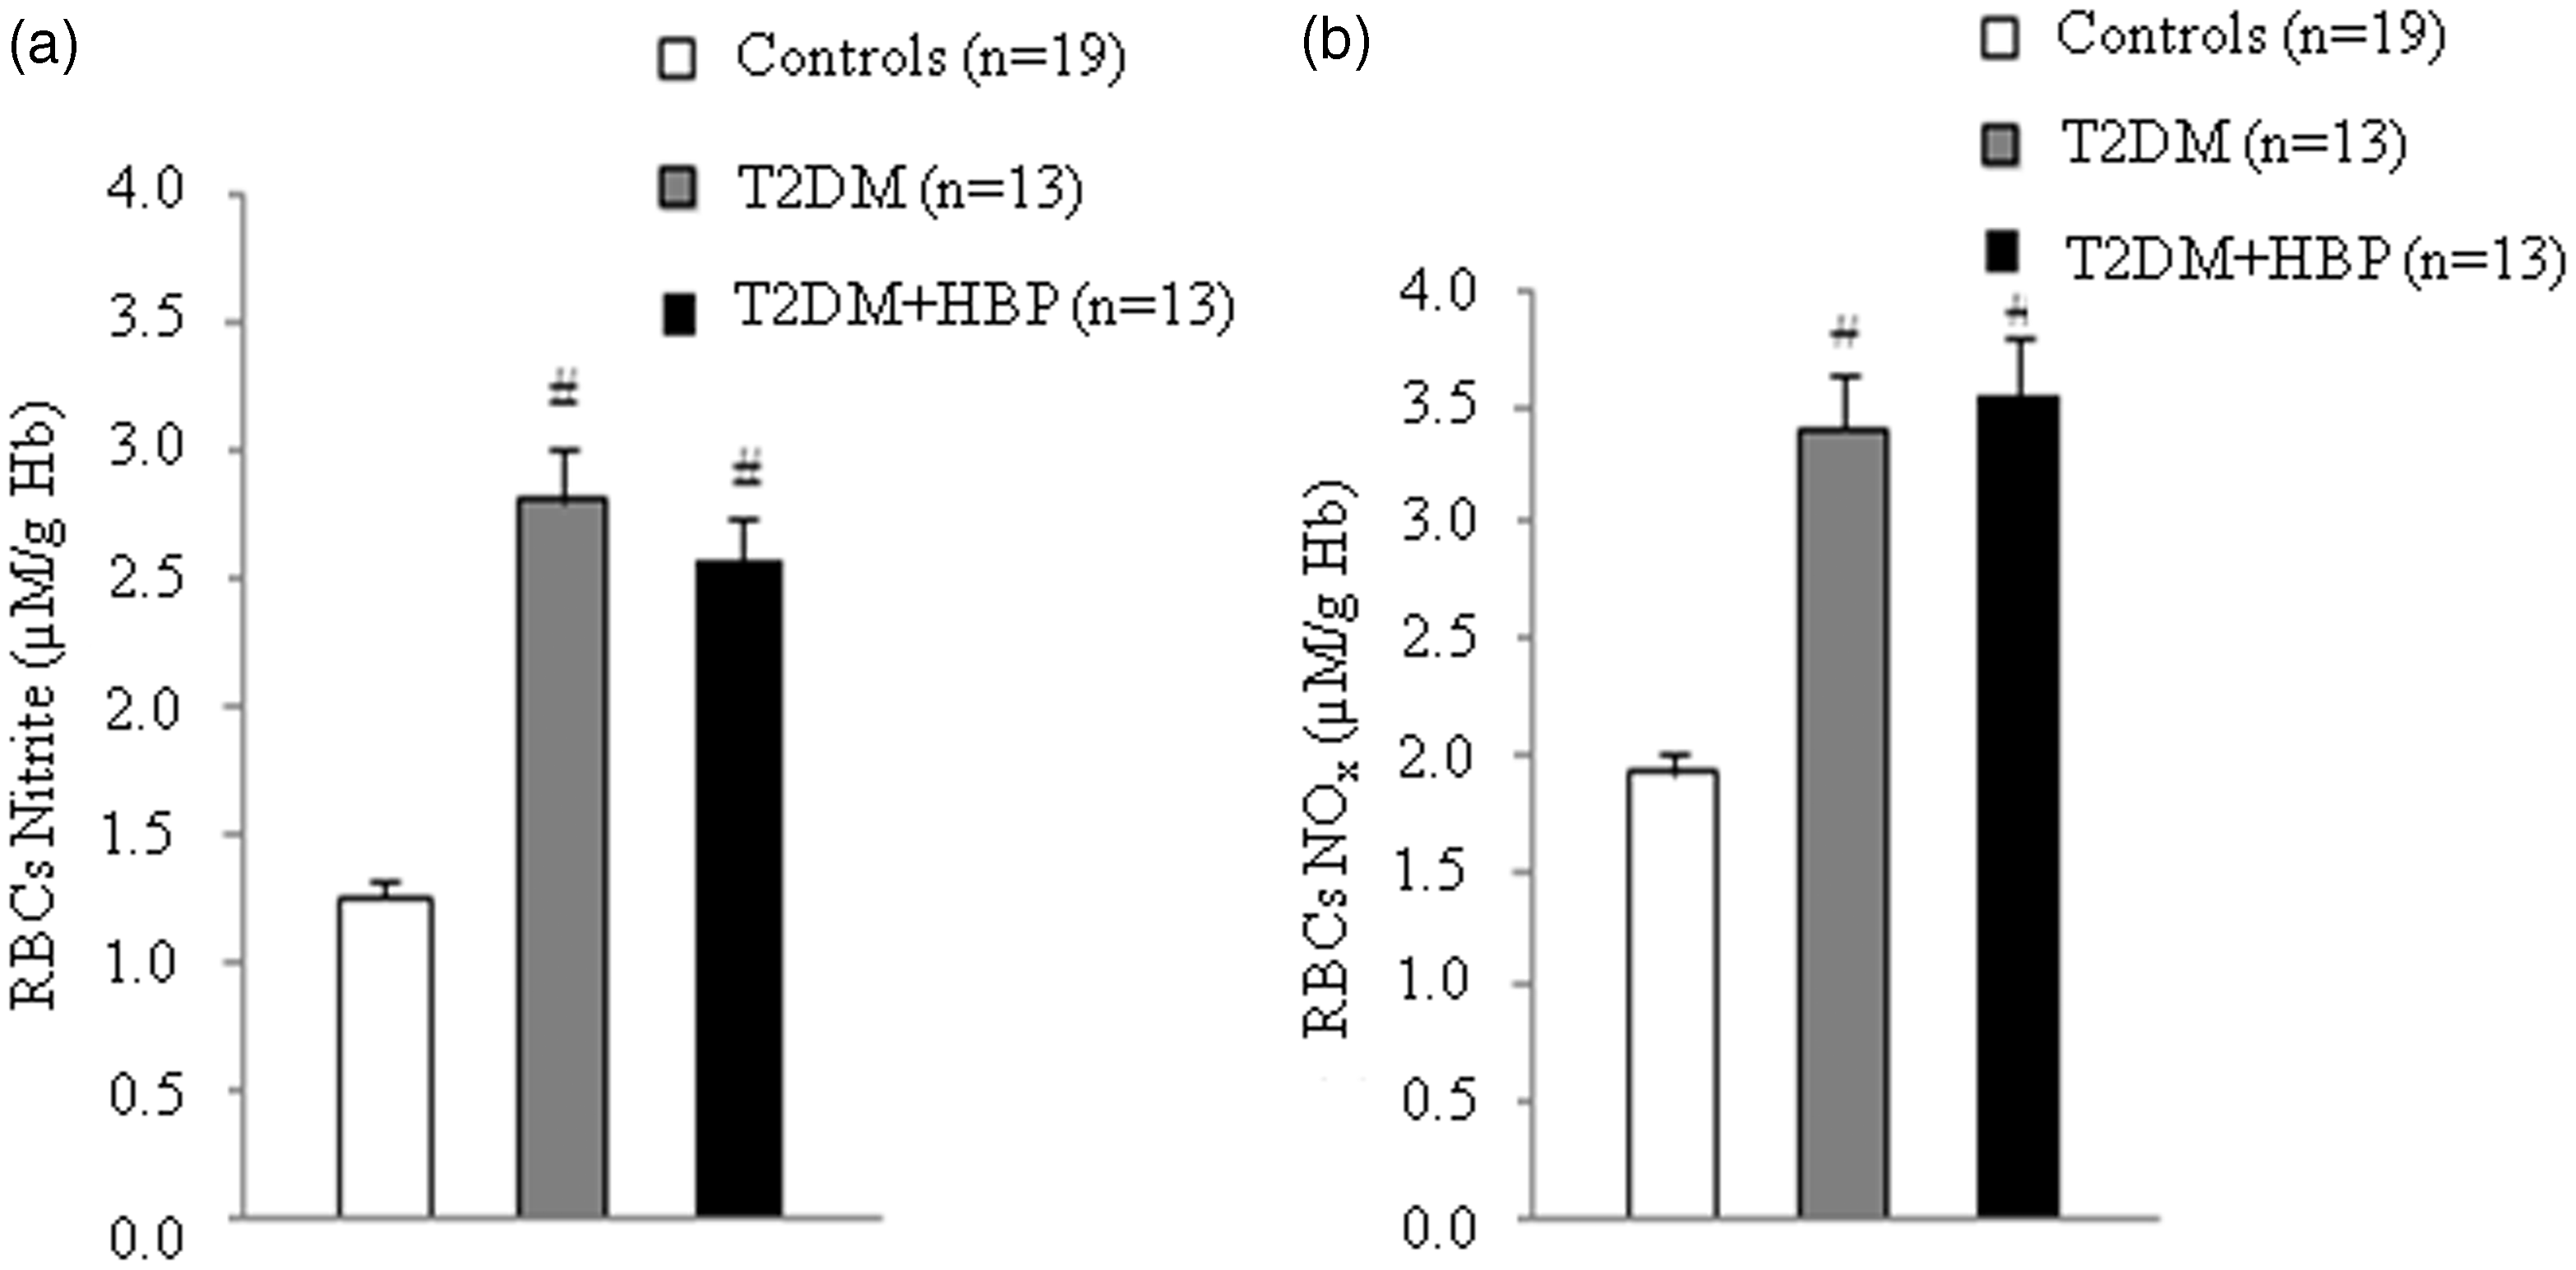
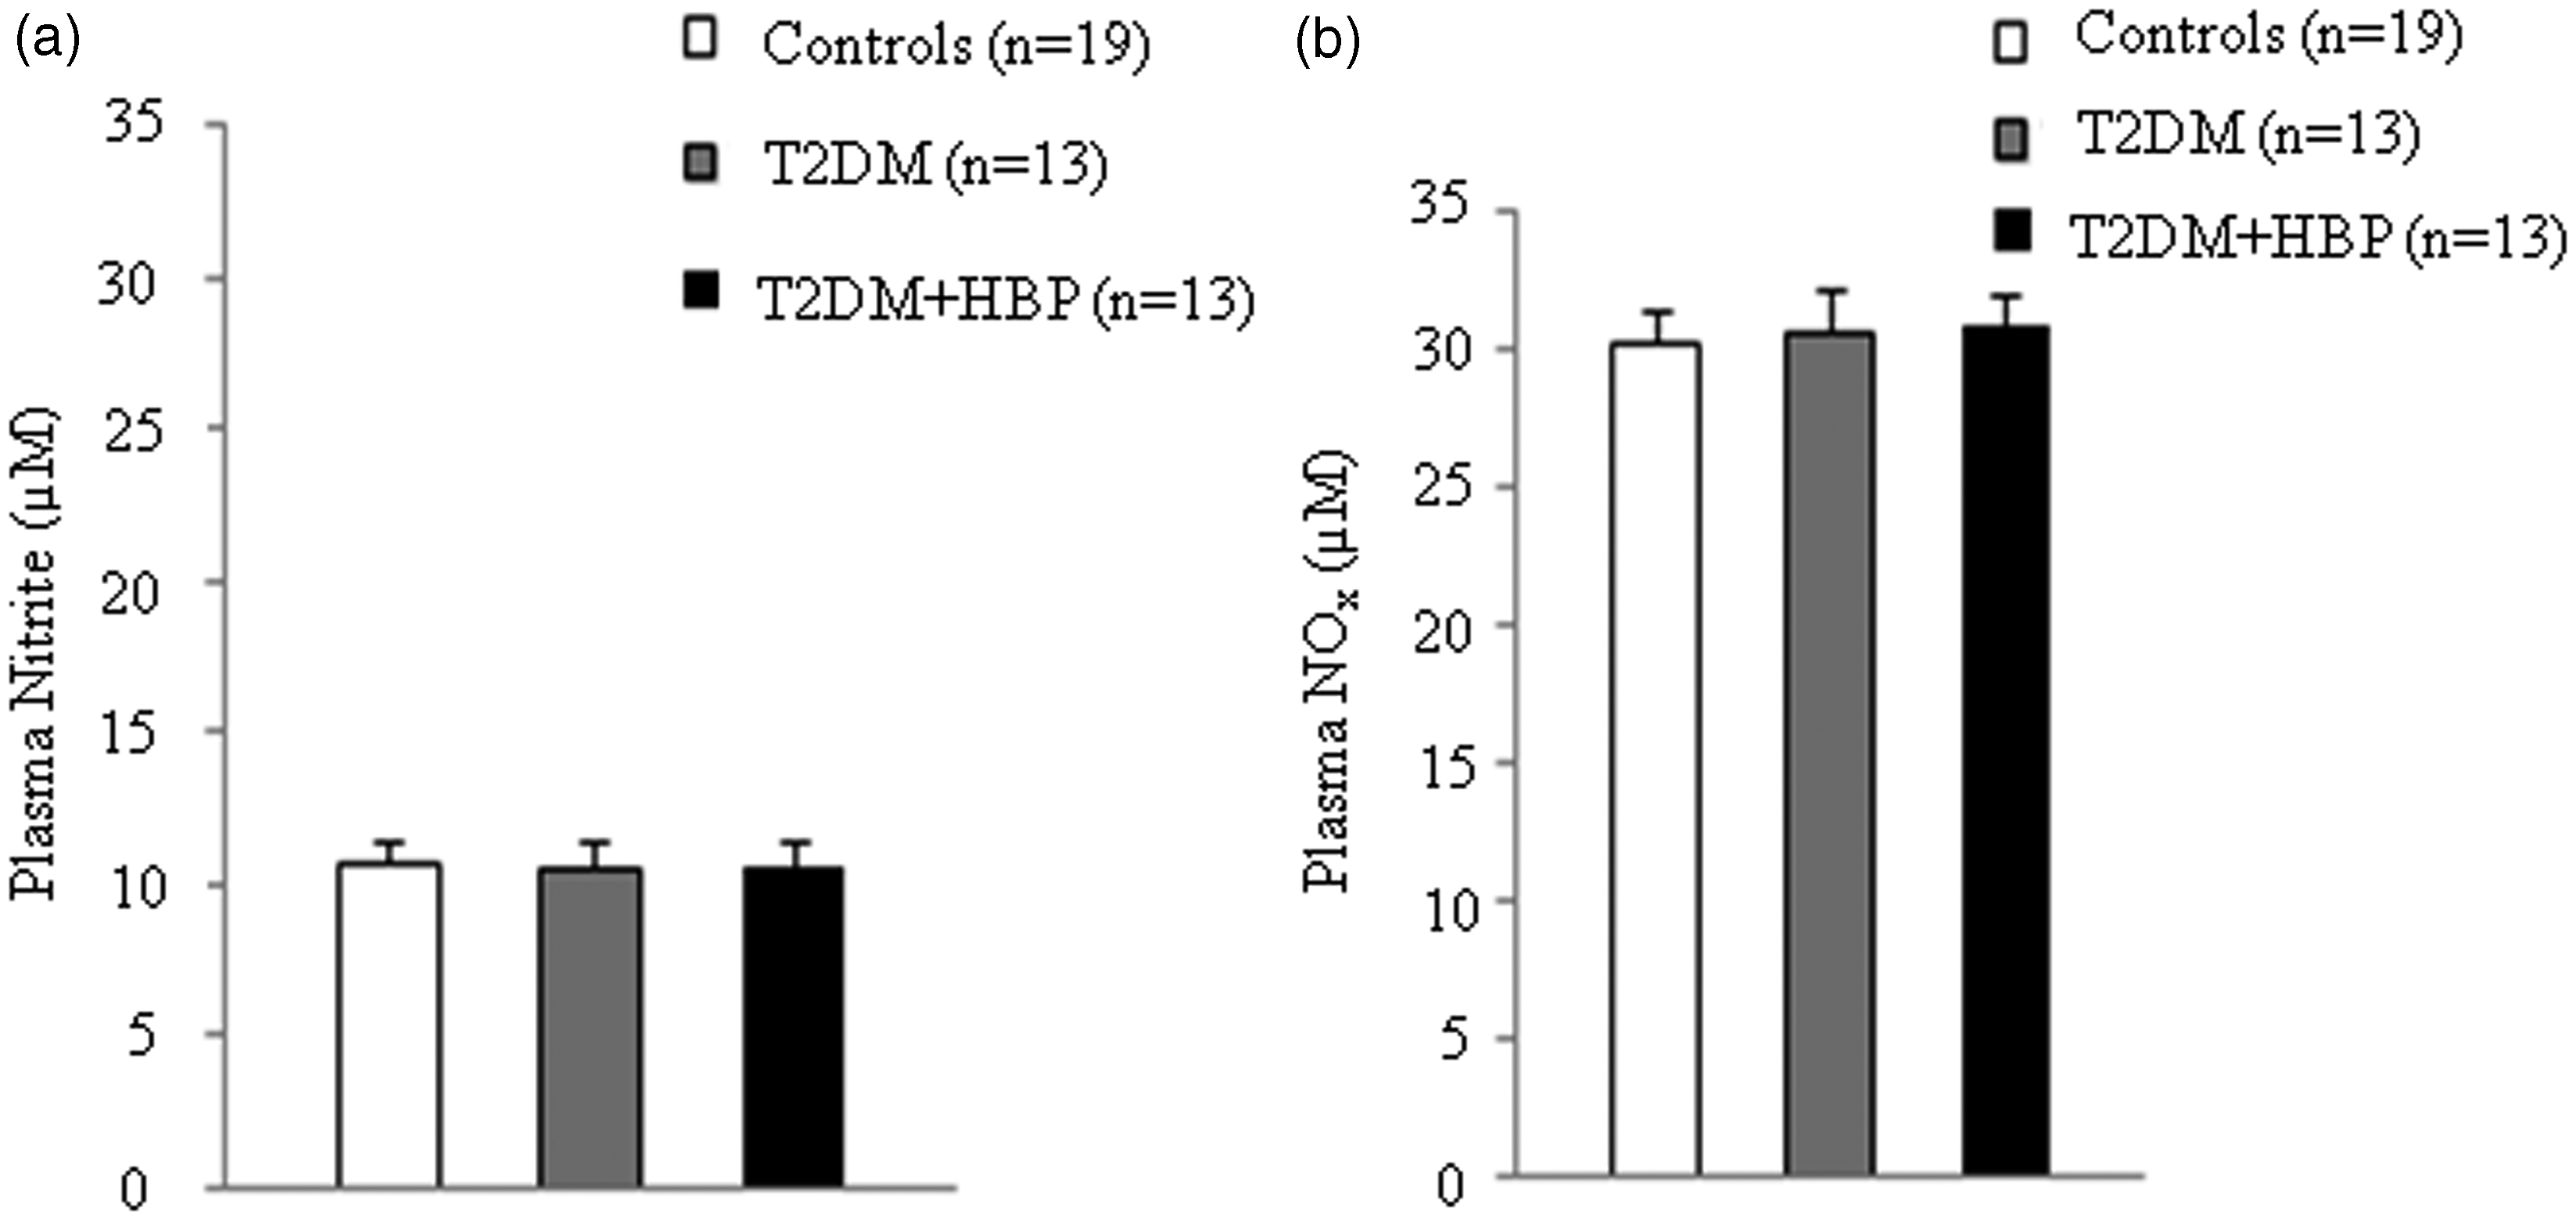
We first evaluated the Arginase activity decreased in RBCs and increased in the plasma of patients with diabetes. RBCs and plasma from patients with type 2 diabetes at first clinical onset and from non-diabetic age-matched individuals were evaluated for arginase activity. Values are mean ± SEM. P = 0.001 vs. controls (a and b), ANOVA Kruskal–Wallis test. RBC NO production increased in patients with diabetes. Nitrite (a) and nitrite plus nitrate (Nox) (b) were measured in RBCs from early type 2 diabetes patients and from non-diabetic age-matched subjects. Values are mean ± SEM. P < 0.001 vs. controls (a and b), ANOVA one-way Tukey test. Plasma NO production remains unmodified in patients with diabetes. Nitrite (a) and nitrite plus nitrate (Nox) (b) were assayed in plasma from patients with type 2 diabetes at first clinical onset and from age-matched non-diabetic subjects.
Discussion
In this paper, we investigated, for the first time,
Arginase activity was decreased in the RBCs of all patients with early type 2 diabetes (Figure 2(a)). Despite previous data
30
showing increased arginase activity in RBC membranes, to our knowledge, there is no direct comparison of the enzymatic activities in both the membrane and cytoplasm of RBCs in diabetes.
31
It could be speculated that different activities between the two cellular compartments are generated by arginase–flotillin interactions in RBC membrane.
31
It is notable that decreased arginase activity was maintained in RBCs of patients with diabetes and high blood pressure at first clinical onset (Figure 2(a)). This could represent an adaptative response of RBCs against endothelial dysfunction. That is, arginase inhibits the NO production through several mechanisms, including competition with NOS for the substrate
As previously described,
14
we also observed that
It is also important to note that
We here reported for the first time that NO production in the RBCs of patients with early type 2 diabetes was significantly increased when compared with non-diabetic subjects (Figure 3). Our data are in line with very recent observation showing increased nitrites concentration in RBCs from patients with type 2 diabetes at different stages of the disease.
25
Palmerini et al.
37
observed similar results on patients with metabolic syndrome and erectile dysfunction. We obtained the same result in RBCs of patients with diabetes and hypertension at first clinical onset (Figure 3). This observation suggests that RBCs could maintain their production of NO in spite of the reduced plasma concentrations of
NO bioavailability varies in the serum of patients with diabetes. NO metabolites are either increased,25,39 decreased40,41 or unchanged 42 in patients with early type 2 diabetes mellitus. The same conflicting results are also reported in the presence of chronic complications of diabetes. 43 We here reported no differences in NO metabolites in the plasma of all patients with type 2 diabetes, in spite of documented hypertension at first clinical onset when compared with non-diabetic controls (Figure 4).
Our data suggest a putative increase of RBC NO availability. It is well known that RBCs are the major intravascular storage sites of nitrite in human blood 44 and also that they have important roles in NO bioavailability.8,24 Production of intracellular nitrite in RBCs involves several pathways. 44 However, recent data 45 provide evidences for the transport of NO via Hb within RBCs. Nitrite has the potential to be a major intravascular NO storage molecule in humans that is capable of transducing NO bioactivity distal to its site of formation. 46 The significance of our observation may rely in the fact that RBCs are essential in mediating NO bioavailability under specific conditions characterizing endothelial dysfunction. Hence, there are data suggesting that RBC nitrite reservoir can be enzymatically reduced to NO by Hb under hypoxic conditions. 46 These results suggest that RBC Hb acts as a nitrite reductase, potentially contributing to hypoxic vasodilation in tissues with low oxygen tension. In medical conditions characterized by chronic hypoxia, such as diabetes mellitus, these mechanisms may represent a potential adaptative response against endothelial damage.
Taking together, our data show that
Footnotes
Acknowledgements
The group of subjects was recruited at courtesy of Ioana Veronica Grajdeanu, Senior MD, Senior Lecturer, Department of Internal Medicine, University of Medicine and Pharmacy, Bucharest, Romania.
Declaration of conflicting interests
None declared.
Funding
Raluca Papacocea was supported by grants from Sectoral Operational Programme Human Resources Development, financed from the European Social Fund and by the Romanian Government under contract number POSDRU/89/1.5/S/64109.
Ethical approval
The study was approved by the ethics committee of the National Institute of Diabetes, Nutrition and Metabolic Diseases ‘N. C. Paulescu’ (reference number 199/2009).
Guarantor
IS.
Contributorship
OS, LI and IS performed research; OS, IS, LI, OMB, RP and CS contributed to data acquisition, new reagents/analytic tools; OS, IS, LI, OMB, RP and CS analysed data; OS and IS wrote the paper; OS and IS designated the research; OS, IS, OMB, RP and CS reviewed the paper.