
Abstract
BACKGROUND:
Post-stroke depression (PSD) is a consequential neuropsychiatric sequela that occurs after stroke. However, the pathophysiology of PSD are not well understood yet.
OBJECTIVE:
To explore alterations in functional connectivity (FC) between anterior insula and fronto-cortical and other subcortical regions in the non-affected hemisphere in patients with PSD compared to without PSD and healthy control.
METHODS:
Resting-state FC was estimated between the anterior insula and cortical and subcortical brain regions in the non-affected hemisphere in 13 patients with PSD, 12 patients without PSD, and 13 healthy controls. The severity of depressive mood was measured by the Beck Depression Inventory (BDI)-II.
RESULTS:
Patients with PSD showed significant differences in FC scores between the anterior insula and the superior frontal, middle frontal, and orbitofrontal gyrus in the non-affected hemisphere than healthy control or patients without PSD (
Introduction
Post-stroke depression (PSD) is a common and serious neuropsychiatric sequela after stroke and may interfere with both functional recovery and long-term outcomes [1]. PSD, which affects nearly 30% to 50% of patients within the first year after stroke, is linked to severe disability, slow motor recovery, and negative response to rehabilitation, and therefore it is a significant burden for patients [1]. PSD is known as a multifactorial process involving neurobiological and sociobehavioral factors; however, the neurophysiologic mechanisms are not well understood [2].
In recent years, resting-state functional magnetic resonance imaging (rs-fMRI) has been introduced as a powerful tool for investigating neural mechanisms underlying cognitive and neuropsychiatric disorders [3, 4]. Rs-fMRI measured spontaneous fluctuations in the blood oxygen level-dependent (BOLD) signal at rest and functional connectivity (FC) was considered to be the reason for this spontaneous brain activity in distributed networks [5]. A small but growing body of evidence has begun to emerge using rs-fMRI to examine FC in patients with PSD [6, 7, 8]. In these rs-fMRI studies of PSD, dysfunction of the default mode network and the affective network showed an association with the severity of depression [6, 7, 8].
Insular cortex is a crucial role in processing various functions such as cognitive, social, memory, and emotional system [9]. The anterior insula has been shown to be involved in the salience network as well in the affected networks when emotional stimuli are presented to participants in fMRI studies with tasks [9, 10]. Anterior insula, with its extensive connections to fronto-limbic areas, has become a region of interest in major depressive mood (MDD) over the last decade [10, 11, 12, 13, 14, 15]. Previous studies have reported structural and functional abnormalities of insular cortex and its related to fronto-limbic regions in patients with MDD. Reduction in gray matter density of fronto-limbic cortices [15] and volume of insular cortex [12] were reported and disruption of functional connectivity between anterior insula and fronto-limbic regions were revealed [10, 11, 13, 14]. However, to date there has been no investigation regarding FC between anterior insula and fronto-limbic connections in the non-affected hemisphere in PSD.
The objective of the current study was to demonstrate patterns in resting-state FC in the whole brain and anterior insula at one month after stroke and to identify possible alterations in FC scores between the anterior insula and fronto-limbic and subcortical brain regions. To explore possible alterations in FC in patients with PSD, we compared FC scores between the insula and the multiple brain regions indicated across the three groups, such as patients with PSD, patients without PSD, and healthy controls.
Methods
Participants
In this cross-sectional study, twenty-five patients with stroke (16 females, 9 males) with unilateral left or right middle cerebral artery (MCA) infarction and 13 age-matched healthy control subjects (8 females, 5 males) were recruited. All participants were right-handed. None of the subjects had severe visual or perceptual impairments, or a previous history of affective disorders. All patients underwent rs-fMRI within one month (25.6
Rs-fMRI data acquisition
A 3.0T GE Signa Exite (Milwaukee, WI, USA) scanner was used to obtain the rs-fMRI images and T1-weighted images. The rs-fMRI images were acquired for BOLD signals using the following parameters: echo planar imaging (EPI) sequence, echo time (TE)
Rs-fMRI data analysis
The statistical parametric mapping (SPM12, http://www.fil.ion.ucl.ac.uk/spm/) program on MATLAB (MathWorks, Inc., Natick, MA, USA) was used for pre-processing and statistical analysis of rs-fMRI images and T1-weighted images. The rs-fMRI images and T1-weighted images from patients with a left lesion were flipped to change it from a left lesion to a right lesion because the whole brain analysis was performed on contralesional and ipsilesional hemispheres. All rs-fMRI data, including flipped data, were preprocessed using a slice timing correction, spatial realignment, normalization, and smoothing. Rs-MRI data were obtained by an interleaved method, and slice timing was performed to correct the time between slices. Then, corrected rs-MRI data were realigned to the first image to correct the head movement between scans, and the translation parameters for the x (left/right), y (anterior/posterior), and z (superior/ inferior) directions were obtained for each brain volume compared to the first volume. The realigned rs-fMRI data were used for outlier detection using the Artifact Detection Tool (ART). The realigned rs-fMRI data were mean adjusted by proportional scaling and spatially normalized in a Montreal Neurological Institute (MNI) template (voxel size
Pre-processed data were entered the CONN tool (http://web.mit.edu/swg/software.htm, version 15.b) to determine FC using a seed-based method. The coordinates of the anterior insula in the non-affected hemisphere [9, 16] was identified using MarsBaR software (http://marsbar.sourceforge.net/) and the meta data of the Neurosynth site (http://www.neurosynth.org). Noise due to cerebrospinal fluids, white matters, or head motions, and sources of artifacts in time series data from the ART were corrected for as nuisance covariates. Individual FC maps from the anterior insula in the non-affected hemisphere were made for the seed-to-voxel connectivity maps in the first-level analysis. Then, the results of the first-level analysis were used for within-group, analysis of variance (ANOVA), post-hoc, and multiple regression analyses for the seed-to-voxel connectivity maps in the second-level analysis.
Lesion boundaries were determined using T1-weighted images from each patient with the aid of MRIcron software (http://people.cas.sc.edu/rorden/mricron/index.html). To mask the regions of damage, normalized T1-weighted images were used as a reference, and masking areas were manually drawn by a rehabilitation doctor who was blinded to the study. Masked images were combined using the SPM12 program and displayed using MRIcroGL software (http://www.cabiatl.com/mricrogl/). In addition, the lesion volume was calculated to compare the total lesion size between patients without PSD group and with PSD group, and the comparison was tested using the non-parametric Mann-Whitney test.
Thresholding criteria & statistical analysis
To compensate for multiple comparisons across the brain, spatial extent thresholds were calculated using AlphaSim with Monte Carlo simulations from the SPM REST toolbox (http://restfmri.net/). Input parameters for minimum cluster size were determined by performing a 5000 Monte Carlo simulation with a cluster connection radius of 5 mm and a FWHM of 8 mm to satisfy the Family Wise Error (FWE) rate correction of P
All statistical analyses on clinical data were performed using SPSS software (SPSS Inc., Chicago, IL, USA, version 18), and differences with a
Results
General characteristics
The mean age of the 25 patients with stroke was 66.12
Demographics and clinical data in patients without PSD and with PSD
Demographics and clinical data in patients without PSD and with PSD
A one sample within-group analysis showed the FC map between the anterior insula and the other brain areas in the non-affected hemisphere for the three groups (Fig. 1). The detailed brain areas showing FC with the anterior insula in the non-affected hemisphere are summarized in the Supplement (Tables S1–S3). While a one sample within-group analysis also showed FC between the anterior insula in the non-affected hemisphere and brain areas in the affected hemisphere, the brain areas in the affected hemisphere were not included in Supplementary Tables S1–S3. The main reason for excluding brain areas in the affected hemisphere was that the affected hemisphere is the damaged side of the brain, and thus only brain areas in the intact hemisphere were considered for analysis since damage-related physiological factors, such as a microbleeding, can be possible confounders for analysis.
The functional connection with the anterior insula from the within subject analysis with a Family Wise Error (FWE)-corrected threshold of 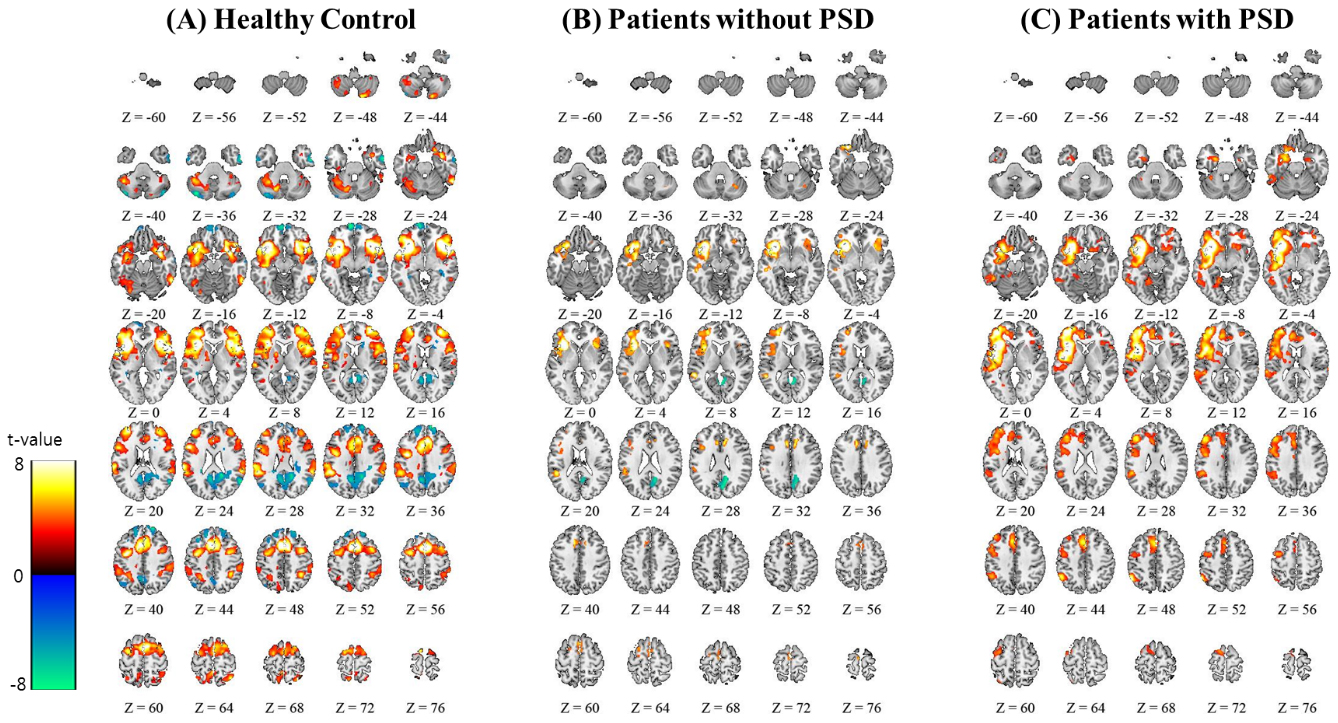
Significant functional connectivity differences at the whole brain level were revealed by ANOVA and post-hoc two sample test. The SPM{F}s and SPM{t}s with a Family Wise Error (FWE)-corrected threshold of 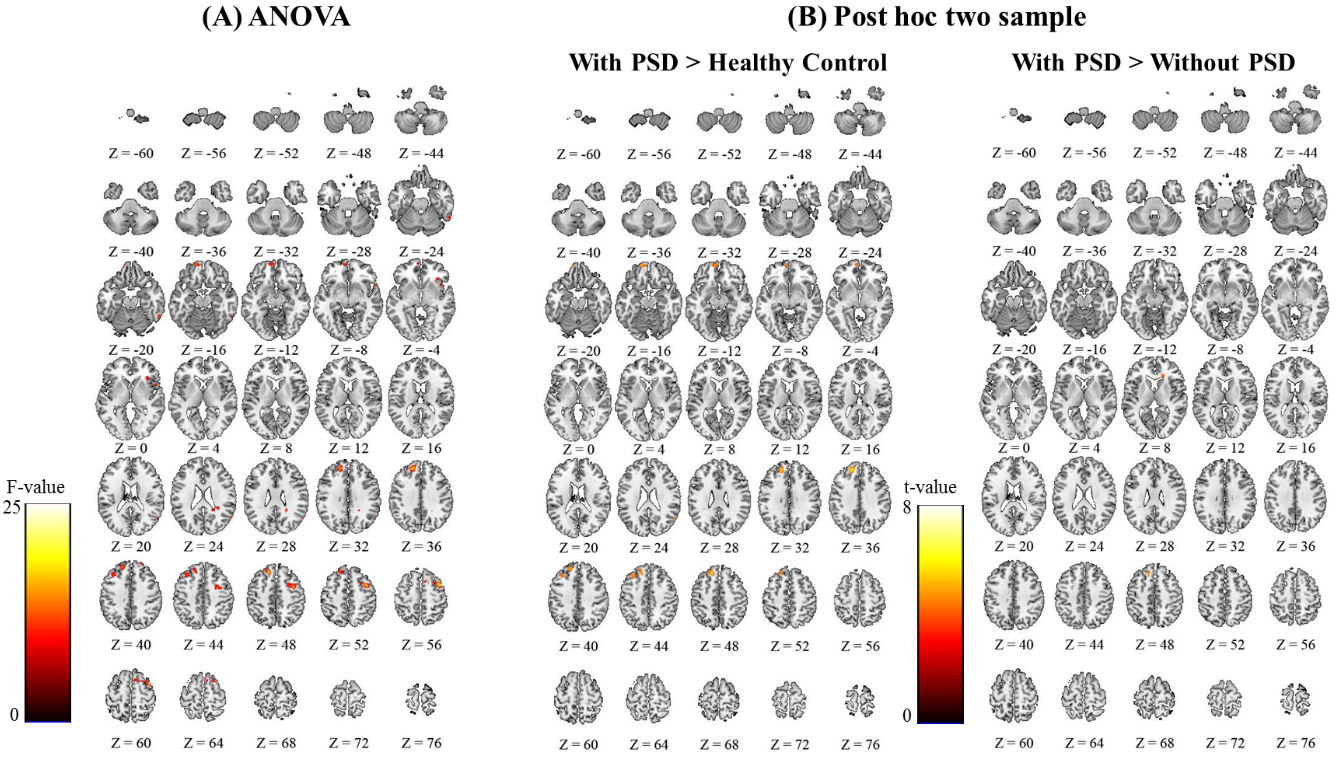
The functional score between the non-affected hemispheric anterior insula and the superior frontal, middle frontal, and orbitofrontal gyrus regions showed significantly statistical differences between patients with PSD group and each of the other groups (patients without PSD group and healthy control group). 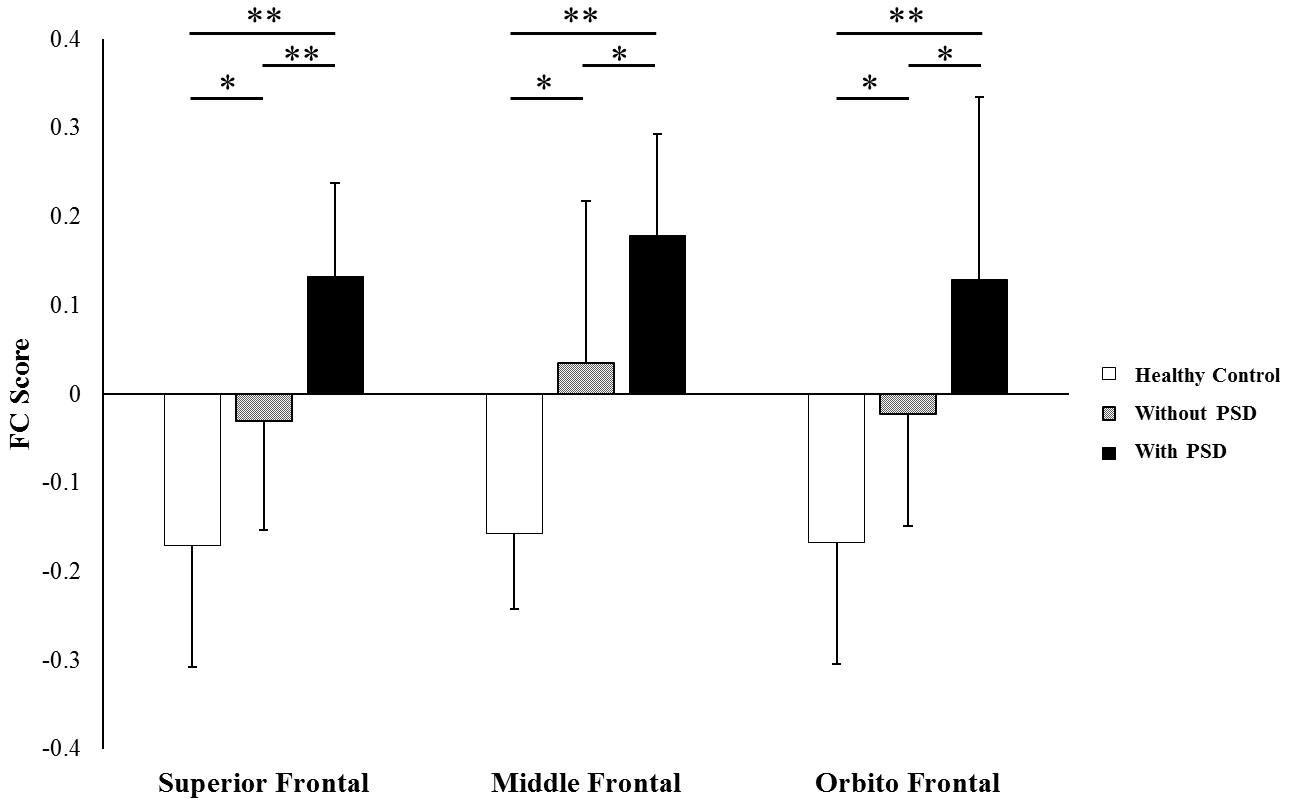
The ANOVA of the FC maps revealed that the superior frontal, middle frontal, and orbitofrontal regions of the non-affected hemisphere were significantly different between the three groups (Fig. 2A and Supplementary Table S4). A post-hoc two-sample t-test was then performed for further comparison between groups. First, comparison of patients with PSD and healthy control groups showed FC differences in the superior frontal, middle frontal, and orbitofrontal regions (Fig. 2B and Supplementary Table S5). There was no difference in FC between patients with PSD group and healthy control groups. Second, the comparison of patients with PSD group and without PSD group showed a difference in FC in the superior frontal region (Fig. 2B and Supplementary Table S5). Third, the comparison between patient without PSD group and healthy control groups showed no statistical difference in FC. All post-hoc analyses were performed at a FWE rate correction of P
FC scores in the superior frontal, middle frontal, and orbitofrontal areas of the non-affected hemisphere are represented in Fig. 3. The FC scores in the superior frontal area were as follows:
Correlation map showed that FC scores in the superior frontal, middle frontal, and orbitofrontal regions in the non-affected hemisphere strongly correlates with BDI-II scores.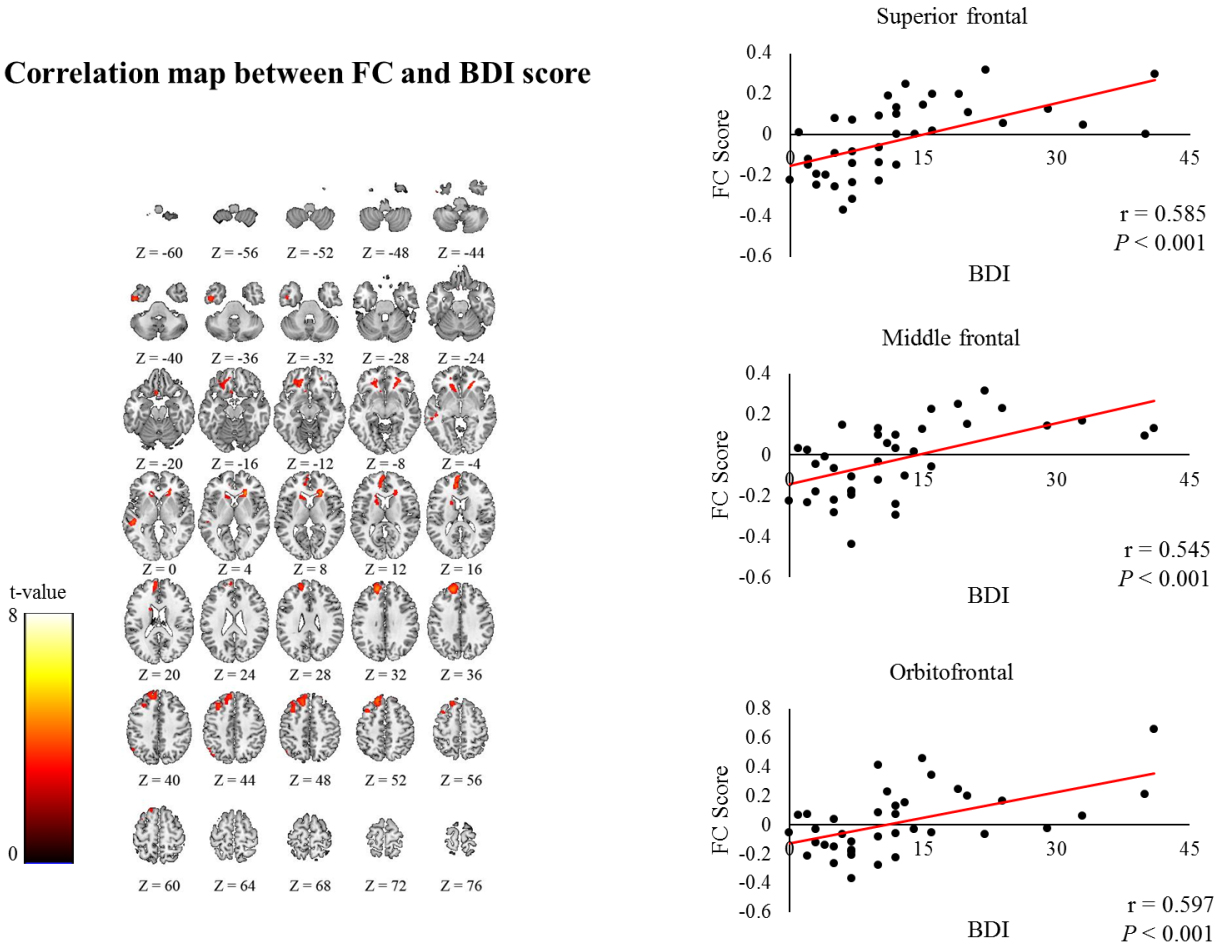
The FC scores in the superior frontal (
Discussion
The main finding of the current study was that the mean FC scores between the anterior insula and fronto-limbic areas in the non-affected hemisphere showed much higher positive scores in patients with PSD than the mean FC scores in patients without PSD and healthy controls. Furthermore, in these fronto-limbic areas, the FC scores showed positive correlations with depression severity. These findings therefore suggest that FC alterations between the non-affected anterior insula and fronto-limbic region are strongly associated with PSD
In this study, we have focused on alteration of FC in the non-affected hemisphere in patients with PSD compared to without PSD and healthy control. Previous imaging studies on PSD have focused on the specific lesion location and laterality in the affected hemisphere [17, 19, 20, 21, 22]. However, location and laterality of stroke lesion related to occurring PSD have not yet been determined. Increased risk factor of PSD was related to location of stroke lesion such as the frontal lobe, basal ganglia, and limbic system [17]. However, systemic review offered no support for the hypothesis that the risk of PSD was affected by the lesion location [18]. Also, laterality was one of the first characteristics of stroke lesions. Stroke patients with right hemispheric lesions represented more frequently depressive mood than those with left hemispheric lesions in 6 months after stroke onset [19, 20]. There were, however, other studies with contradictory finding that the higher prevalence in left hemispheric lesions were associated with the severer of PSD [21, 22]. There are not clear pattern of the relationship between laterality of the affected hemisphere and PSD [23]. Therefore, this current study has been interesting in suggesting mechanism of PSD in not the affected hemisphere but the non-affected hemisphere at 1 month after stroke.
In this study, the anterior insula showed a negative correlation (i.e., anticorrelation) with posterior cingulate cortex (PCC), precuneus, and angular gyrus in the control group but not in the PSD group. More specifically, patients without PSD group showed a negative correlation between the anterior insula and PCC only, though no correlation was observed in the group with PSD. Using rs-fMRI, it has been demonstrated that some brain networks are organized into anticorrelated networks [24, 25]. That is a set of brain regions has been found to be anticorrelated with regions of the task-positive network. It consists of brain regions that are commonly activated in tasks which demand attentional control. Therefore, our results showed that the negative correlation pattern observed in some brain networks is also altered in patients with PSD. One the other hand, a previous rs-fMRI study of PSD has focused on dysfunction of the default mode network (DMN). Lassalle-Lagadec et al. [6] showed that FC alterations in the DMN after stroke were correlated with the severity of depression and that FC alterations in the DMN were associated with anxiety severity suggesting a strong association between early FC alterations in the DMN and the risk of PSD.
In relation to MDD, the anterior insula and fronto-cortical areas have gained increasing attention as key brain regions in the pathophysiology of depression [26]. The anterior insula has wide and extensive connections to cortical and limbic regions. It plays a consequent role as a coordination between cognitive control networks and DMN [9, 10]. The rich connection between the anterior insula and frontal areas suggests a unique role for the anterior insula in functions related to both emotional processing and self-information processing [27, 28]. Also, reduction in gray matter density of fronto-limbic cortices [15] and volume of insular cortex [12] were reported and disruption of functional connectivity between anterior insula and fronto-limbic regions were revealed [10, 11, 13, 14]. Therefore, we chose the anterior insula as a key node in this study and evaluated FC between the insula and all brain regions. One sample FC maps, which were obtained using the anterior insula in the non-affected hemisphere as a seed location, revealed the FC between the anterior insula and cortical and sub-cortical brain areas in all three groups.
Studies using rs-fMRI have demonstrated an important role for cortical-subcortical interactions in MDD. Some studies using rs-fMRI have found decreased FC between ventral striatum (VS) and the ventromedial prefrontal cortex in adult patients with depression compared to healthy controls [29, 30]. Another study found that the FC between the VS and prefrontal cortex is associated with depression severity [31]. However, in the current study, the between group analysis did not show FC alterations in patients with PSD.
Among the fronto-cortical brain areas, the superior frontal, middle frontal, and orbitofrontal cortex in the non-affected hemisphere showed high FC scores with the anterior insula in patients with PSD. Furthermore, the degree of connectivity in these brain regions correlated with the severity of depression, suggesting that the more severe the depression, the stronger the coherence in these systems. Functional imaging studies indicated that these frontal areas are closely associated with impairments in blocking out negative, repetitive thoughts in individuals with depression [30, 31, 32]. Therefore, it is tempting to propose that the strong links, i.e., the high positive FC between the insula and these fronto-limbic areas, contribute to difficulties in disengaging from negative stimuli in patients with PSD, as a result lengthening the duration of exposure to depressive items. Based on the strong resting BOLD measures, which were weak or inconsistent in healthy controls, patients with PSD appear to experience difficulties in attentional disengagement from negative stimuli and keep their attentional focus on negative stimuli. Previously, it was demonstrated that patients with depression inclined attention for negative stimuli but declined attention for positive stimuli compared with healthy controls [33]. Therefore, taken together, the strong positive connectivity between the anterior insula and frontal brain areas might be related to self-centered ruminations in patients with PSD.
This study has several limitations. First, we did not examine other emotional or psychological measures, such as anxiety levels in patients with PSD. In general, patients with depression often have a high level of anxiety. Therefore, we cannot exclude the possibility that the observed findings resulted from other emotional or psychological syndromes. Second, The lesion volumes between the without PSD and the with PSD group was not significantly different, but the
Conclusion
In conclusion, when compared to patients without PSD and healthy controls, patients with PSD show much higher positive FC scores between the anterior insula and fronto-limbic areas. Furthermore, FC alterations in fronto-limbic regions were strongly correlated with depression severity as measured with the BDI-II. While the current study was limited in its ability to study the concrete relationship between depression and the alteration in FC owing to its sample size, we speculate that the positive FC in patients with PSD might be used as a potential imaging biomarker for PSD.
Footnotes
Conflict of interest
None to report.
Supplementary material
The coordinates of functional connection with the non-affected hemispheric anterior insula (left side in figures) from the within subject analysis on the healthy control group was thresholded at a family-wise error (FWE) rate correction P
Brain region
Side
Cluster size
MNI-coordinates
Peak T
x
y
z
Dorsolateral Prefrontal
L
1952
20
46
9.45
R
2128
32
54
12
8.85
Ventrolateral Prefrontal
L
1649
22
26.84
R
1166
50
14
0
15.06
Orbito Frontal
L
691
24
35.51
R
728
46
24
11.60
Postcentral Gyrus
L
667
40
10.28
Supplementary Motor Area
L
903
10
54
14.45
R
947
8
10
58
11.35
R
156
36
46
7.24
Supra Marginal
L
661
24
8.30
R
537
58
26
7.10
Superior Temporal
L
943
10
16.40
R
372
56
12
9.06
Inferior Temporal
L
317
60
9.07
Anterior Cingulate
L
643
16
38
8.62
R
700
6
28
36
9.14
Insula
L
1169
22
55.30
R
1003
34
28
15.16
Striatum
L
270
12
9.79
R
195
32
14
7.38
Cerebellum
L
405
6.29
Superior Frontal
L
451
70
R
541
16
56
36
Medial Orbitofrontal
L
391
62
Post Cingulate
L
164
32
R
162
14
26
Precuneus
L
697
34
R
579
16
24
Angular
L
187
40
R
291
60
24
Inferior Temporal
R
230
58
0
Middle Temporal
R
205
60
2
Cerebellum
R
220
The coordinates of functional connection with the non-affected hemispheric anterior insula (left side in figures) from the within subject analysis on patients with PSD group was thresholded to satisfy a family-wise error (FWE) rate correction P
Brain regions
Side
Cluster size
MNI-coordinates
Peak T
x
y
z
Dorsolateral Prefrontal
L
1751
48
2
9.58
Ventrolateral Prefrontal
L
1956
24
18.66
Orbito Frontal
L
1355
22
34.15
Precentral Gyrus
L
533
2
16
5.79
Supplementary Motor Area
L
242
22
44
6.87
Inferior Parietal
L
284
52
8.29
Supra Marginal
L
154
28
5.64
Superior Temporal
L
979
12
11.01
Middle Temporal
L
202
7.00
Anterior Cingulate
L
420
40
14
5.96
Hippocampus
L
249
6.49
Insula
L
1462
22
72.25
Striatum
L
500
9.36
Amygdala
L
138
7.35
In the within subject analysis, the coordinates of functional connection with the non-affected hemispheric anterior insula (left side in figures) on patients without PSD group was thresholded to satisfy a family-wise error (FWE) rate correction P
Brain regions
Side
Cluster size
MNI-coordinates
Peak T
x
y
z
Dorsolateral Prefrontal
L
436
46
10
8.75
Ventrolateral Prefrontal
L
622
24
14.70
Orbitofrontal
L
703
24
19.90
Supplementary Motor Area
L
282
18
62
5.63
Superior Temporal
L
731
20
8.22
Middle Temporal
L
222
10
10.67
Anterior Cingulate
L
115
20
32
7.41
Insula
L
1010
22
26.73
Precuneus
L
308
10
Occipital
L
142
8
Cerebellum
L
99
0
6
The coordinates of functional connection with the non-affected hemispheric anterior insula (left side in figures) from the ANOVA analysis on the three groups was thresholded to satisfy a family-wise error (FWE) rate correction P
Brain regions
Side
Cluster size
MNI-coordinates
Peak F
x
y
z
Superior frontal
L
281
44
34
18.30
Middle frontal
L
92
28
44
11.88
Orbitofrontal
L
95
58
15.37
The coordinates of functional connection differences in the post-hoc two sample t-test were thresholded to a family-wise error (FWE) rate correction P
Brain regions
Side
Cluster size
MNI-coordinates
Peak T
x
y
z
Patients with PSD
Superior frontal (BA9)
L
258
44
34
6.05
Middle frontal (BA8)
L
87
28
44
4.86
Orbitofrontal (BA11)
L
126
58
5.54
Patients with PSD
Superior frontal (BA8)
L
37
30
48
5.07