
Abstract
The quality of knowledge graphs can be assessed by a validation against specified constraints, typically use-case specific and modeled by human users in a manual fashion. Visualizations can improve the modeling process as they are specifically designed for human information processing, possibly leading to more accurate constraints, and in turn higher quality knowledge graphs. However, it is currently unknown how such visualizations support users when viewing RDF constraints as no scientific evidence for the visualizations’ effectiveness is provided. Furthermore, some of the existing tools are likely suboptimal, as they lack support for edit operations or common constraints types. To establish a baseline, we have defined visual notations to represent RDF constraints and implemented them in UnSHACLed, a tool that is independent of a concrete RDF constraint language. In this paper, we (i) present two visual notations that support all SHACL core constraints, built upon the commonly used visualizations VOWL and UML, (ii) analyze both notations based on cognitive effective design principles, (iii) perform a comparative user study between both visual notations, and (iv) present our open source tool UnSHACLed incorporating our efforts. Users were presented RDF constraints in both visual notations and had to answer questions based on visualization task taxonomies. Although no statistical significant difference in mean error rates was observed, all study participants preferred ShapeVOWL in a self assessment to answer RDF constraint-related questions. Furthermore, ShapeVOWL adheres to more cognitive effective design principles according to our performed comparison. Study participants argued that the increased visual features of ShapeVOWL made it easier to spot constraints, but a list of constraints – as in ShapeUML – is easier to read. However, also that more deviations from the strict UML specification and introduction of more visual features can improve ShapeUML. From these findings we conclude that ShapeVOWL has a higher potential to represent RDF constraints more effective compared to ShapeUML. But also that the clear and efficient text encoding of ShapeUML can be improved with visual features. A one-size-fits-all approach to RDF constraint visualization and editing will be insufficient. Therefore, to support different audiences and use cases, user interfaces of RDF constraint editors need to support different visual notations.
Introduction
Data interoperability is one of the biggest challenges of the current era and the Resource Description Framework (RDF) [13] offers a solution as it is compositional: RDF graphs from different sources can be merged automatically which facilitates the integration of heterogeneous data [35]. However, advantages such as RDF’s flexibility also result in challenges such as the production/consumption dilemma [35] in which the structure of data needs to be described such that producers and consumers can validate transmitted data for reasons such as security or performance [35]. In 2017, the W3C RDF Data Shapes Working Group published a recommendation to define structural constraints of RDF data [33] which can address such needs.
Quality is defined as “fitness for use” [29] implying that constraints for validation are use-case specific; human users usually define these constraints in a manual fashion and need support. Users can use any text editor to create such constraints, but need to be familiar with the textual syntax of the underlying data shape language. User evaluations of visualizations for different Linked Data concepts, such as ontology modeling [41] or Linked Data generation [26], suggest that such visualizations support users to perform respective tasks more intuitively. However, the degree of actual support offered by existing visualizations for RDF constraints is currently unknown, given the lack of scientific evidence for their effectiveness. Furthermore, some of the existing tools are likely suboptimal, as they lack support for edit operations or common constraints types.
Clearly specified visualizations – already used for some Semantic Web concepts [19, 24, 26, 41, 64] – provide a design rationale and can be designed with the human information processing system in mind [43], but are not yet taken into account for RDF constraints which makes the effectiveness of existing tools questionable. A visual notation [43] is defined as a set of graphical symbols, a set of compositional rules, as well as the definitions and meaning of each symbol, and provides an explicit design rationale. UnSHACLed [15], a tool built on top of SHACL [33], lists features for a visual data shape editor. However, important details regarding the used visual notation are not provided, for instance, the meaning of arrows or the selection of colors are not clearly specified. Similarly, RDFShape which uses “UML-like class diagrams” [21] to visualize ShEx [52] constraints does not provide a clear specification of its visual notation and neither do other recently developed tools1
OntoPad:
shaclEditor:
Existing tools only provide limited or no editing capabilities, if editing capabilities are provided they are not always in line with real-life constraint use. The first version of UnSHACLed supports constraints editing. However, it does not support all constraint types, for instance, logical constraints are not yet visualized. RDFShape does not support constraints editing at all as it only visualizes constraints, thus users need to use and understand the underlying textual syntax. Similar to the initial version of UnSHACLed, the implementation of RDFShape does not yet support logical relationships such as (exclusive) disjunction; recent statistics show that disjunction constraints are broadly used [37] and thus users probably have the need to create and edit such constraints.
The aforementioned motivate our high-level research question: How can we support users familiar with Linked Data in viewing RDF constraints? To address this research question, we investigated visual notations supporting users when viewing RDF constraints. Furthermore, we present a new version of our tool UnSHACLed that implements visual notations and allows users to create and edit RDF constraints.
A few visual notations already exist, but are not formally defined or do not cover all SHACL core constraints which also prevents a fair comparison. Thus, we defined two visual notations to represent all SHACL core constraints and related concepts by reusing existing notations. Different candidates to reuse exist, i.e. commonly used visual notations already familiar to users. Both the Unified Modeling Language (UML) [47] and the Visual Notation for OWL Ontologies (VOWL) [41] can be considered for a visual notation for RDF constraints as they are commonly used for RDF constraints or related Semantic Web concepts [11, 15, 21, 24, 26, 41, 46].
Hypothesis
We defined the two visual notations ShapeUML and ShapeVOWL both representing all SHACL core constraints and related concepts. Since VOWL, the underlying notation of ShapeVOWL aims to be intuitive and comprehensible [41] and visualizes the tangible graph structure of RDF, we investigate in this paper the following hypothesis:
Contributions
We compare the notations with respect to design principles for visual notations [43] derived from several seminal works in human cognition [4, 23, 58, 61, 65] and evaluate them in a comparative user study.3
Material:
Our contributions in this paper are:
introduction of two alternative visual notations: ShapeUML and ShapeVOWL;
analysis of both visual notations with respect to cognitive effective design principles;
comparative evaluation between ShapeVOWL and ShapeUML with a user study; and
presentation of our open source UnSHACLed editor implementing both visual notations.
The comparative analysis based on cognitive effective design principles [43] reveals that ShapeVOWL adheres to more principles, thus in theory is more cognitively effective. An additional comparative user study shows that there is no significant mean error difference when answering questions about RDF constraints with both notations, however, also that in a self-assessment users prefer ShapeVOWL. We implemented both visual notations in our tool UnSHACLed to also allow editing of RDF constraints in a visual fashion.
The remainder of the paper is structured as follows. We provide background knowledge on data shape languages and visual notations in Section 2 and present two visual notations in Section 3. In Section 4 we compare both presented visual notations based on design principles for cognitive effective visualizations. In Section 5 we present our visual editor UnSHACLed. In Section 6 we present the comparative user evaluation and its results. We discuss and conclude in Section 7.
In this section, we discuss (i) existing RDF constraint languages (ii) the use of different constraint types suggesting visualizations for manual creation, (iii) existing RDF constraint visualization tools, (iv) closely related Semantic Web visualizations providing possible visualizations to extend, (v) visual notations for human cognition, and (vi) visualization tasks describing the interaction between humans and visualizations.
RDF constraint languages
Several RDF constraint languages were proposed in the past, we describe how they are related. In this work we consider the Shapes Constraint Language (SHACL) because it (i) is a W3C recommendation, (ii) clearly defines constraint types in its core specification, and (iii) has a significant intersection with the Shape Expressions Language (ShEx) [35], a widely used RDF constraint language.
A few years later in 2014 another two W3C member submission were submitted: the
The
Creating constraints
More than eighty constraint types were identified [7] from which a subset is used as axioms in ontologies [36] and a subset motivated the creation of SHACL [60]. Existing approaches to generate RDF constraints use UML diagrams or ontologies as source but usually cover only a limited subset of SHACL core constraint types due to an incomplete mapping. We count SHACL core constraint types based on the “Core Constraint Components” of SHACL specification [33].
The
TopQuadrant generated SHACL constraints from the
Manually created RDF constraints are theoretically not limited by any mapping as a user potentially can use all constraint types of a specification. However, similar to ontology axioms [36] only a subset seems to find common use. In our previous work [37] and later updated and extended statistics,5
Tools to edit RDF constraints already exist but are either based on a specific textual syntax or have no formally defined visual notation.
Fajar et al. [18] implemented a
De Meester et al. [15] list features for a visual data shape editor implemented in an early version of the visual editor
The desktop application
Commercial tools with support for RDF constraints include TopBraid Composer, AllegroGraph, Stardog, GraphDB and Metaphactory.
The tool
We received information from TopQuadrant that this visualization will get a significant re-work in the future, including interactive diagram and new styling.
The triple stores/knowledge graph systems
We look into the visualization of other Semantic Web concepts because they might be relevant for the visualization of RDF constraints.
A plethora of ontology visualizations exists, but
Visual notations for human cognition
Visual notations are created for human users, thus works related to perception and cognition are relevant to our work. We outline how the most relevant frameworks are combined in the
Moody’s design theory is based on
From a perceptual perspective, this decoding is described based on works related to
Considering cognition, slower conscious processes such as retrieving prior knowledge from long-term memory are involved. Prior knowledge in this context may refer to already familiar visual notations.
Visualization tasks
The interaction between humans and visualizations can be systematically described using visualization tasks, this allows us to consider a common set of tasks for our user study.
Such taxonomies were evaluated in user studies for example by
Visual notations
We introduce two visual notations for RDF constraints to establish a baseline for a fair comparison, we provide general design considerations for both notations, ShapeUML (based on UML) and ShapeVOWL (based on VOWL). Both visualize fundamental constructs of RDF constraint languages: constraints and the context in which they are applied, i.e. data shapes. We describe which visual variables are used as graphical primitives for both notations, following Moody [43] and thus make design decisions transparent. Cognitive effective design principles [43] where taken into account where applicable, a detailed comparison between both notations based on these principles can be found in the next section (Section 4).
Both notations have different visual features and represent all SHACL core constraints and additionally concepts related to targeting, property paths, severity and deactivation; although both notations are built based on SHACL, they are constraint language independent and semantic constructs of other constraint languages can be mapped to it. Thus, both notations represent the same semantic constructs and their only difference are their visual features, enabling a fair comparison. Currently the visual notations visualize all SHACL core constraints, where necessary with (additional) constraint-language-independent text labels; Figs 1, 2, 5, 6 list all SHACL core constraints and the other supported concepts together with a corresponding terminology mapping used by our notations ShapeUML and ShapeVOWL.
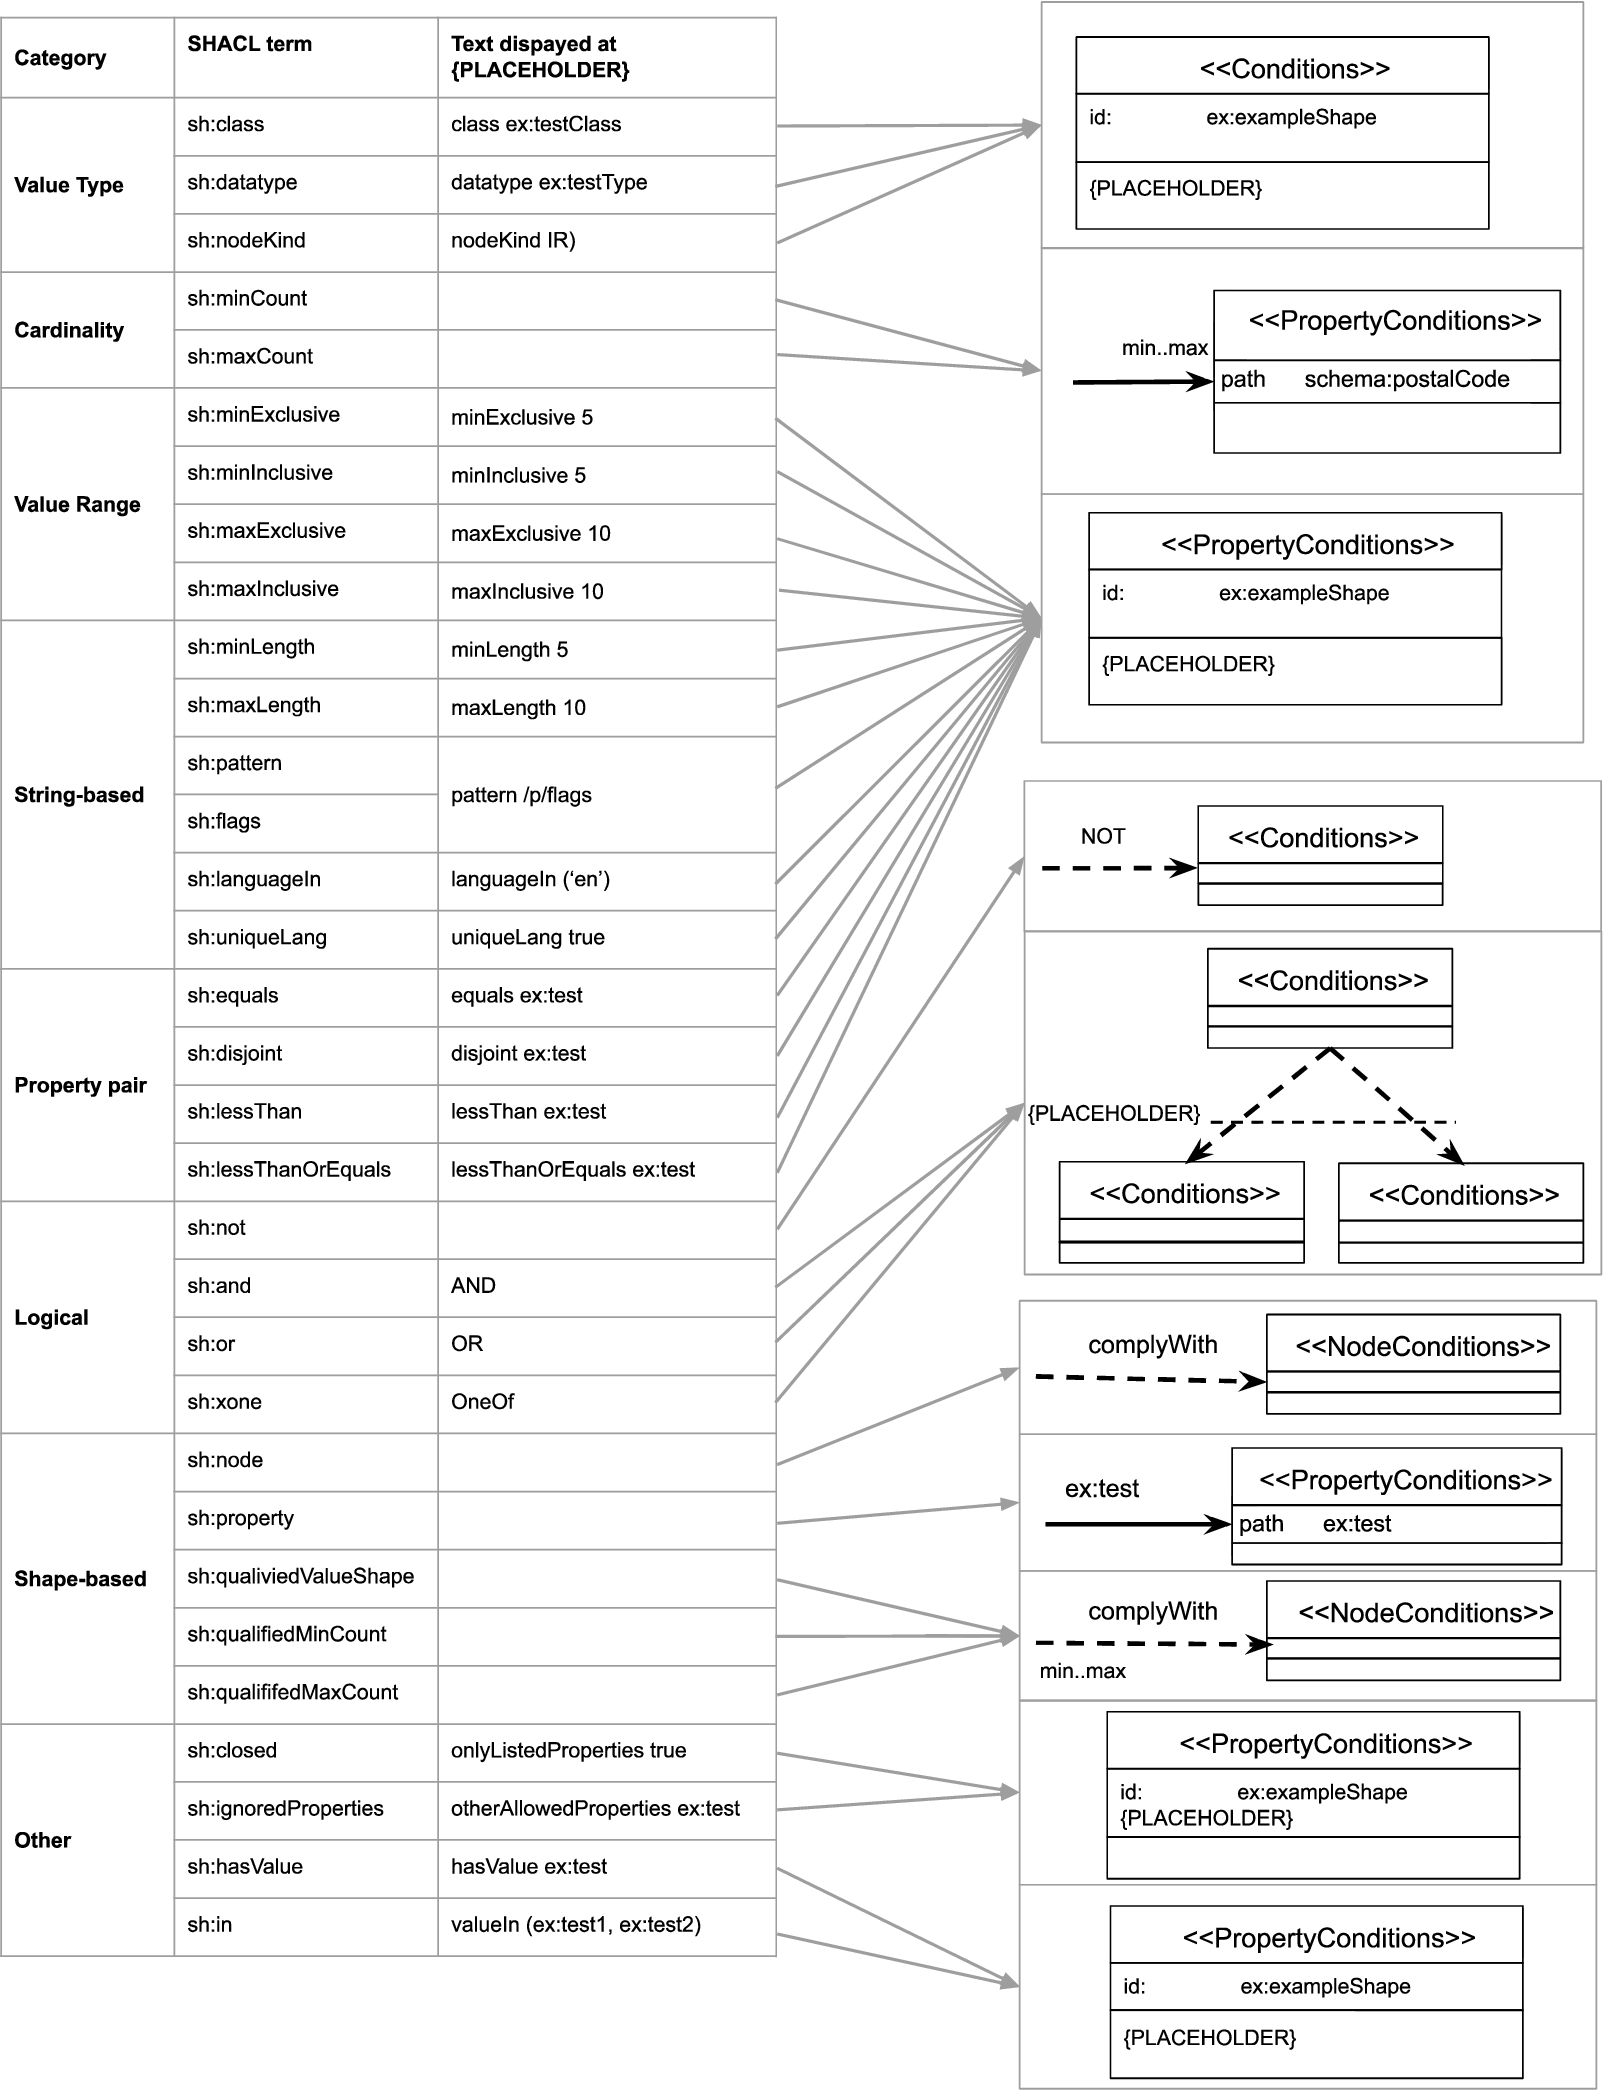
Correspondence between semantic constructs and ShapeUML: SHACL core constraints (left) and graphical notations (right).

Correspondence between semantic constructs and ShapeUML: other relevant SHACL concepts besides core constraints (left) and graphical notations (right).
The notation ShapeUML is based on the Ontology Definition Metamodel (ODM) [46] in which both nodes and properties are first-class UML constructs and, thus, graphically represented as class diagram boxes (rectangle). Therefore, constraints on both nodes and properties can be expressed and logical relationships between different types of data shapes can be visualized.
The graphical primitives of ShapeUML are the following visual variables [43]: shape, edge, text, border and position. The full specification is available at
Shape
We
We use the graphical primitive shape to represent the fundamental construct data shapes and its subclasses node and property shape thus adhering to ODM [46]. Data shapes are represented using a

Constraints visualized using ShapeUML: a subject valid to the person data shape should have an IRI (1), at least one but maximum two
In UML “a class is drawn as a solid-outline rectangle with three compartments separated by horizontal lines” [47] which we redefine for data shapes. The  ). We determine the data shape’s type by reusing UML concepts similar to the UML profile for OWL and RDF [46], i.e. we define UML “stereotypes” to signify what the rectangles represent: node shapes declared as ≪NodeConditions≫, property shapes declared as ≪PropertyConditions≫ and (if the data shape type is not specified) data shapes as ≪Conditions≫. The name of the data shape is displayed as bold text to support the user in the identification and differentiation of data shapes. This name may be populated from
  ). Thus, data shapes are similar to UML where the middle compartment usually contains the attributes of classes, i.e. what characterizes them. The
  ).
).
We
 ). These edges associate a data shape with another data shape or set of data shapes.
We introduce  ) as it represents relationships between subjects and objects of the data graph. The label of such a connection is the property path of the connected property shape which supports readability as humans can read the label while processing the edge and do not have to look for this label elsewhere in a rectangle; annotating an edge with a label also follows UML. A
  ). Therefore such connections can be distinguished from property shape connections both via a visual difference and a different label. Similarly, a dashed directed edge with the label NOT indicates that the source data shape must not comply with the destination data shape (Fig. 3
 ). A
). A  ).
).
Text
We
 ). This visual aid aims in the quick identification of deactivated data shapes which does not introduce any visual symbol and thus does not deviate too much from the UML specification. Values referring to RDF terms can be shortened with a prefix, therefore the tool implementing the visual notation has to provide a prefix list.
Border
We
Position
We
In ShapeUML, cardinality constraints referring to properties are visualized next to the arrow head of a directed edge, i.e. minCount and maxCount (Fig. 3 ); cardinality constraints referring to data shapes are visualized next to the source of a directed edge, i.e. qualifiedMinCount and qualifiedMaxCount (Fig. 3
 ). Thus, the visualization reflects the reading direction, for example: the person data shape requires the property
  ) vs a valid address property requires that at least 1 property value need to comply with the address node shape (Fig. 3
 ).
).

Constraints expressed using ShapeVOWL: a subject valid to the person data shape should have an IRI (1), at least one but maximum two
The visual vocabulary of ShapeUML defined in the last section, can be used to represent SHACL shape graphs. We present and discuss an example (Fig. 3).
ShapeUML defines visual elements for data shapes (Fig. 3). Data shapes of different types (≪Conditions≫, ≪NodeConditions≫ and ≪PropertyConditions≫) can be uniquely identified with an IRI but can also have a human readable label. For example, a node shape uniquely identified ( ). Such a node shape can by default be applied on resources, e.g.
 ).
).
 ).
).
 ). In case every address should comply with the provided data shape, the qualified cardinalities at the source of the dashed arrow need to be removed. Such a removal would mean for a SHACL implementation that the two constraints
 ): subjects valid to the Person node shape should have either exactly one
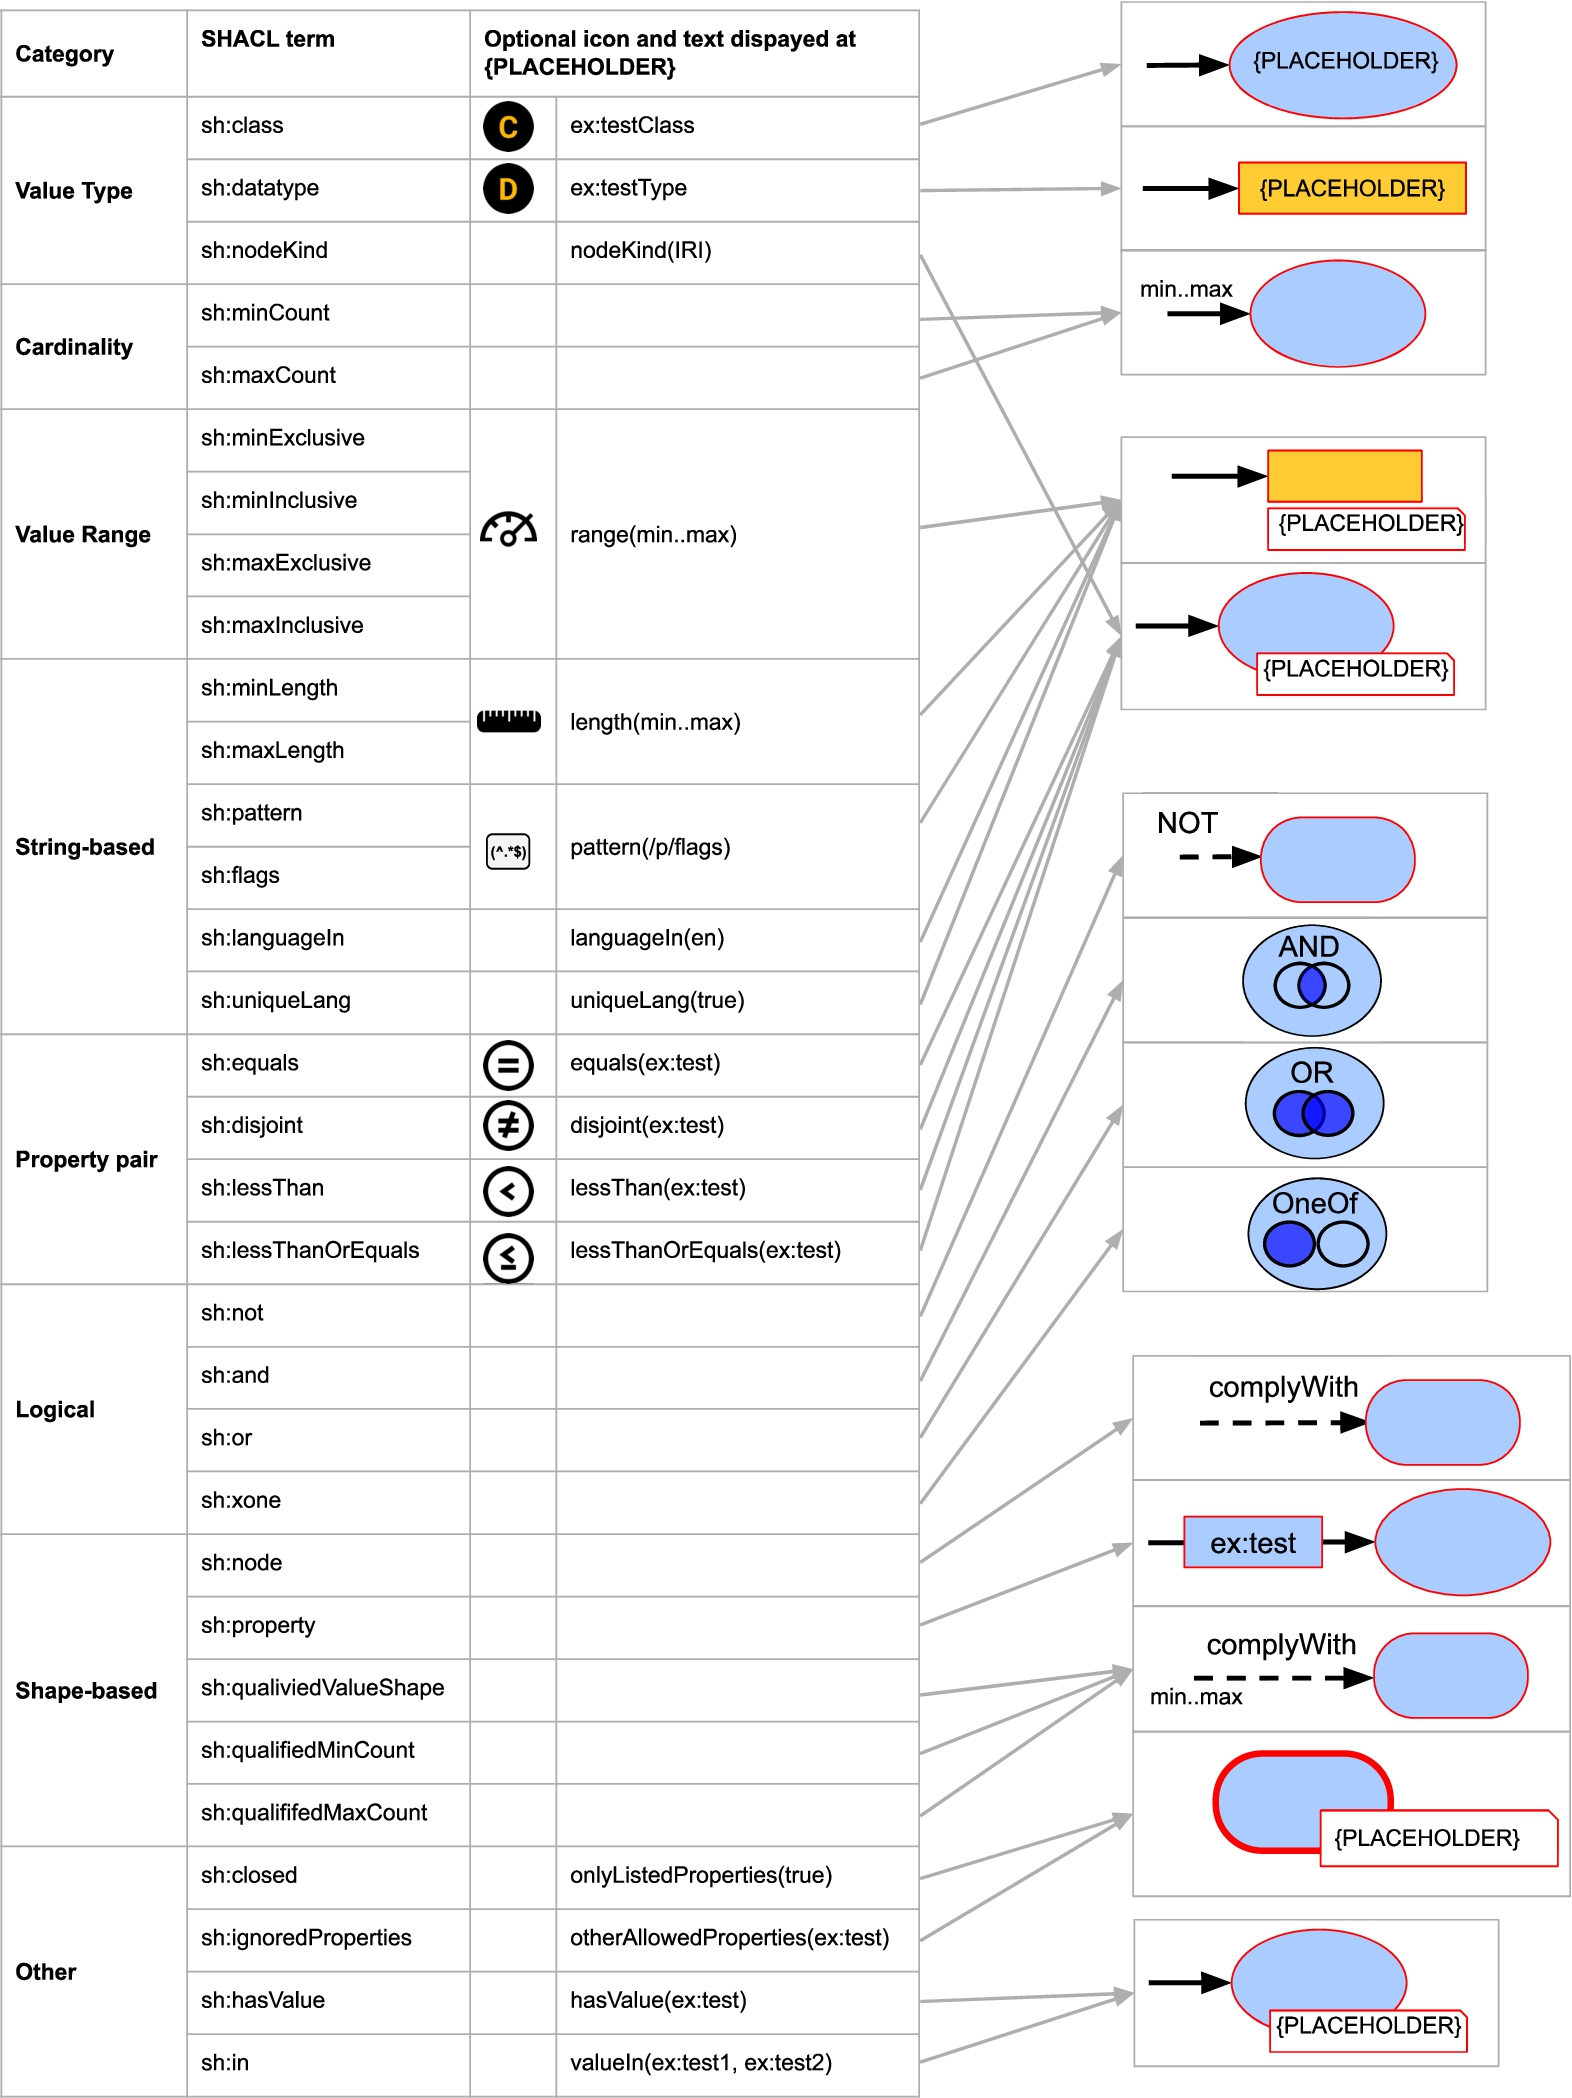
Correspondence between semantic constructs and ShapeVOWL: SHACL core constraints (left) and graphical notations (right).

Correspondence between semantic constructs and ShapeVOWL: other relevant SHACL concepts besides core constraints (left) and graphical notations (right).
This visual notation is based on VOWL [41] and designed to be as close as possible to it. The graphical primitives of ShapeVOWL are shape, edge, text, border, position and color. The full specification is available online at
Shape
We
The graphical primitive shape distinguishes the fundamental constructs node shapes, property shapes and constraints, and represents one-to-many relationships. This follows VOWL where nodes in the graphs as well as specific restrictions such as disjointness are represented with dedicated nodes. Node shapes, subjects of triples, are represented as  ), property shapes, the predicate and object of a triple, as
  ) and either a
  ,
,  ), and constraints as
  ,
,  ). Thus, node and property shapes align with VOWL as the data shapes appear like the RDF graph on which they define constraints on.
The note-element, containing constraints as text, is visually attached at the node shape or property shape indicating the constraints applying on the represented subjects, predicates or objects of a triple; constraints are visualized where they apply to facilitate the processing of the visualization by users. We also introduce ellipses as intermediate element to denote one-to-many relationships (see edges).
Edge
We
 ) refer to relationships between data shapes and denote their label directly as text on top of the relationship. They indicate that the source data shape needs to comply with the constraints of the destination data shape.
 ), following VOWL. The label of directed solid edges is the property path of the represented property shape; relationships between data shapes are visually distinguished from property shapes due to the use of different edges.
Similar to VOWL, cardinalities are denoted next to the arrow head (Fig. 4 ), but additionally data shape related qualified cardinalities are denoted at the start of a directed dashed edge (Fig. 4
 ). Node and property shapes may refer to multiple other node and property shapes in a
  ), similar to certain restrictions in VOWL, e.g., disjointness.
Text
We
We use  ). Users can also identify node shapes without a human readable label present. The italic type distinguishes the unique identifier from other text.
Border
All visual shapes have a border, we
VOWL uses dashed borders for specific OWL classes and literals without datatype. However, we use  ). For deactivated node shapes both the rectangle with rounded corner representing the node shape as well as a possibly attached note element with constraints will get a dashed border (Fig. 4
 ). Similarly, for deactivated property shapes the rectangle of the relationship label, the object and potentially attached note elements get a dashed border.
We introduce  ).
).
The thick borders aim to represent the closeness whereas dashed borders aim to represent inactiveness. As the thickness and style of the edges are two different visual features, possible combinations of deactivated and closed data shapes can still be represented.
Position
We
We use specific  ). The visualization reflects the reading direction, for example: the person data shape requires the property
  ) vs a valid address property requires at least 1 property value to comply with the address node shape (Fig. 4
 ).
).
Datatype and class constraints are not visualized in a note element, but directly as text in the graphical element representing the object, i.e. a yellow rectangle for datatype constraints (Fig. 4 ) or a blue ellipse for class constraints (Fig. 4
 ). VOWL visualizes datatypes as text within the yellow rectangle representing a literal. We reuse this visualization to denote a datatype constraint of a property value and add an additional datatype icon in front of the name of the datatype to indicate that a constraint exists (Fig. 4
 ). This icon is an orange D in a black circle (Fig. 4). Consistently with datatypes, class constraints are denoted as text within the ellipse representing the property value. Class constraints have an additional class icon in front of the name of the class. This icon is an orange C in a black circle (Fig. 4
 ).
).
Logical constraints are not represented in a note element, but as dedicated nodes or as labels on dashed edges which enables ShapeVOWL to represent relationships between different types of data shapes. Conjunction and (exclusive) disjunction constraints are visualized as ellipse with respective labels on the upper part of the ellipse (Fig. 4 ). Additionally, icons representing Venn diagrams are used to distinguish the different logical constraint types. These icons represent Venn diagrams, similar to certain VOWL constructs. Negation constraints are represented as text label “NOT” on top of dashed edges connecting data shapes (Fig. 4
 ).
).
Color scheme
We
A color scheme is applied on the border color of data shapes and note elements to express different severities (Fig. 4 ). VOWL uses a color scheme for a better distinction of the different elements [41]. We reuse the base color and literal color of VOWL.
Additionally, for ShapeVOWL colors on borders are used to express the severity of data shapes. For the severities violation, warning and information from the SHACL specification we recommend the respective colors
Visual example
The visual vocabulary of ShapeVOWL defined in the last section, can be used to represent SHACL shape graphs. We present and discuss an example (Fig. 4).
ShapeVOWL defines visual elements for data shapes (Fig. 4). Our color scheme is applied; data shapes are colored with respect to their severity.
Node shapes can be uniquely identified with an IRI but can also have a human readable label. For example, a node shape uniquely identified with the IRI  ). Such a node shape can by default be applied on resources, e.g.
 ,
,  ) or next to a rectangle (Fig. 4
 ). A fictive person node shape can represent the constraint that persons must have a unique identifier (Fig. 4
 , nodeKind constraint). The value of an
  ). Cardinality constraints are represented using text and position. Thus, a constraint to express that a person must have at least one but maximum two addresses will be denoted with the (inclusive) cardinality specification
  ).
).
Dashed directed edges with the label complyWith indicate  ). In case every address should comply with the provided data shape, the qualified cardinalities at the source of the dashed arrow have to be removed.
 ): subjects valid to the Person node shape should have either exactly one
  ).
).
With respect to validation  ). The data shape
  ). Constraint types can be accompanied with a logo displayed before the constraint in the note element (Fig. 4
 ).
).
Comparative analysis
Both ShapeUML and ShapeVOWL were designed by following basic principles of cognitive effectiveness [43], however, as we reused the existing notations UML and VOWL these principles could only be applied to a certain extent. Therefore, we analyze ShapeUML and ShapeVOWL with respect to these design principles with the aim of scientifically argue about the impact of design decisions on human information processing and thus the effectiveness of ShapeUML and ShapeVOWL from a theoretical perspective.
We refer to each principle’s definition according to Moody [43] (which includes other frameworks as specified in Section 2.5) and discuss to which extent each visual notation complies. We omit the design principle cognitive integration as it only applies when multiple diagrams of different types are integrated. Table 1 summarizes the comparison which is discussed in Section 4.9.
Semiotic clarity
Semiotic clarity relates to the correspondence between symbols and their referent concepts [43], there must be a one-to-one correspondence for a visual notation to satisfy the requirements of a notational system [23, 43]. If there is no one-to-one correspondence between semantic constructs and visual symbols, one of the following four anomalies can occur: symbol redundancy, symbol overload, symbol excess or symbol deficit [43]. In case of symbol redundancy, a semantic construct is represented by multiple graphical symbols; the opposite is symbol overload. Symbol excess occurs if graphical symbols do not correspond to any semantic construct; and the opposite is symbol deficit, a semantic construct with no graphical symbol.
ShapeUML All semantic constructs are represented in the visual notation (Figs 1, 2), i.e. terms from the SHACL specification; some constructs use the same graphical symbol but text is used to differentiate, and, thus, to maintain visual expressiveness. Following the ODM-profile of UML, ShapeUML uses rectangles with solid borders to represent data shapes, thus node and property shapes share the same graphical symbol (
ShapeVOWL All semantic constructs are represented in the visual notation (Figs 5, 6) and similar to ShapeUML,
Perceptual discriminability
Perceptual discriminability describes the ease and accuracy with which graphical symbols can be differentiated from each other [43]. A factor is the visual distance, i.e. the number of visual variables on which the symbols differ and the size of differences in perceptible steps (capacity). Shapes are the primary basis for humans to identify objects in the real world, while textual differentiation is a cognitively ineffective way to handle graphic complexity [43]. This principle includes perceptual popout, i.e. preattentively detection of visual elements [43, 61]
ShapeUML ShapeUML uses the visual variables shape, edge, text, border, and position. But because shape is always a rectangle and border is always solid, both are not variable anymore and the perceptual discriminability of ShapeUML is low. However, therefore we stay close to the UML specification, where users potentially are familiar with. Given the limited number of graphical symbols, i.e. rectangles with solid borders for data shapes, text for constraints as well as solid and dashed edges to relate data shapes, ShapeUML only provides
ShapeVOWL ShapeVOWL uses the visual variables shape, edge, text, border, position, and color. On the one hand, ShapeVOWL uses
Semantic transparency
Semantic transparency is the extent to which a notation’s meaning can be inferred from its appearance, informally its “intuitiveness” or the degree of how much the appearance provides a cue to its meaning [43]. This principle is not measured binary, semantic transparency can appear in a continuum from semantically immediate where a novice can infer the meaning (e.g. a stick figure to represent a person), to semantic perversity where even a wrong meaning is inferred [43].
ShapeUML ShapeUML is based on UML which uses abstract shapes, and, thus it does
ShapeVOWL ShapeVOWL uses a graph visualization based on nodes and edges of the actual RDF graph for which it defines the constraints. Several indicators suggest that ShapeVOWL has a
To further increase semantic transparency, ShapeVOWL defines optional icons for constraint types which can speed up recognition and recall as well as improve understanding for novice users [43]. However, according to a recent meta study [34], semantic transparency is not increased with the use of icons per se, empirical tests need to be performed to diminish cultural associations. To this end ShapeVOWL mostly relies on icons representing arithmetic operators such as an equal-sign or less-than. Additionally, icons are only optional and future studies may provide more insights in appropriate icons for RDF constraints.
Complexity management
Complexity management aims not to overload the human mind. For instance, visual representations often do not scale well [43]. Modularization and hierarchy offer solutions to manage complexity.
Both proposed visual notations
Visual expressiveness
Visual expressiveness refers to the number of visual variables in the whole notation. Each variable has a power denoting the information which can be used [43].
The visual expressiveness of both visual notations
If required by specific use cases, both notations can be improved specifically towards visual expressiveness. For example,
Dual coding
Dual coding is the use of text to complement graphics. Text on its own is cognitively ineffective to encode information, but, in a supplementary fashion, it can reinforce and clarify meaning [43]. However, although textual annotations improve understanding, having a dedicated graphical symbol only for annotations not representing any semantic construct of the language it harms semiotic clarity, i.e. a case of symbol excess as the graphical symbol of annotation does not represent a semantic construct [43].
ShapeUML is based on UML, heavily text-based and thus
Following UML, logical constraints are represented with specific edges additionally labeled with the logical constraint’s name. However, this is not considered dual coded as without label, edges of different logical constraints are not distinguishable. Both visual variable and text are needed to denote logical constraints.
ShapeVOWL visualizes graphs, and text is added to graph elements.
Graphic economy
Graphic economy states that the size of the visual vocabulary should be cognitively manageable to achieve a low graphical complexity [43]. The number of semantic constructs can be limited, symbol deficit can be introduced or the visual expressiveness can be increased.
Both visual notations should be
Cognitive fit
Cognitive fit means different representations are suitable for different tasks and audiences [43]. Optimizing visual notations for novice users can reduce effectiveness for experts and vice versa. More, the medium on which a visual notation is presented influences the effectiveness, i.e. manual drawing with pen and paper vs computer display. Icons, color, and texture are more difficult to draw than simple geometric shapes [43].
ShapeUML ShapeUML is based on UML, and, thus
ShapeVOWL ShapeVOWL uses a graph visualization with nodes and edges. Experiments with other VOWL-based notations already suggest that
Discussion
We analyzed both visual notations with respect to Moody’s design principles, which itself is based on seminal works of human cognition such as communication theory [58], feature integration theory [61], Bertin’s work on Semiology of Graphics [4], or Goodman’s theory of symbols [23]; and in the following discuss our findings which are summarized in Table 1.
One the one hand, ShapeVOWL uses more visual variables and symbols to express semantic constructs than ShapeUML. For example, it uses more shapes, meaning of borders but also colors and optionally icons. This – in addition to the depiction of the underlying RDF graph data, specific edges to connect elements, and Venn diagrams – results in high scores for semiotic clarity and semantic transparency. All other principles are at least partially addressed with the exception of complexity management which can be accomplished by a tool implementing ShapeVOWL, e.g. by providing different means of zooming. However, more research regarding appropriate icons is needed, following a recent meta-study on semantic transparency [34].
On the other hand, ShapeUML shows semiotic clarity and graphic economy with an advanced cognitive fit. This means that ShapeUML represents all RDF constraints’ needed concepts in a cognitively manageable fashion and, additionally, may be suited for specific tasks and audiences. Perceptual discriminability, semantic transparency and visual expressiveness are affected by cognitive fit [43], thus, considering hand-drawn representations of ShapeUML, its simplicity may become an advantage as no special drawing abilities are needed.
A comparative analysis with Moody’s design principles [43] for cognitive effective visual notations reveals that ShapeVOWL scores better compared to ShapeUML. A double plus (
) indicates that each dimension of the principle is addressed, a single plus (+) that at least one dimension is addressed respectively not violated and a minus (−) indicates that a principle is not or very poorly addressed
A comparative analysis with Moody’s design principles [43] for cognitive effective visual notations reveals that ShapeVOWL scores better compared to ShapeUML. A double plus (
UnSHACLed is a graphical editor for RDF constraints. It allows users to validate RDF data against RDF constraints and view a validation report by loading existing RDF data into the tool and validate them with separately loaded or visually created RDF constraints. The main goal of UnSHACLed is to enable users familiar with RDF but not familiar with specific RDF constraint languages to create and edit RDF constraints. UnSHACLed offers a web interface and thus can be used with any browser. An early prototype was presented in previous work [15] and is available on GitHub.15
In this section we discuss features for an RDF constraint editor (Section 5.1) and how visual notations contribute to it, as well as introducing the implementation of our RDF editor UnSHACLed (Section 5.2).
In previous work [15] we introduced seven desired features for the editing of data shapes.
F1: Independence of constraint language Data shape editors should not confront domain experts with writing the textual syntax of a specific constraint language. Moreover, the visualization of the constraints should be independent of the underlying constraint language: generic (graphical) symbols can be used to (partially) hide language-specific textual syntax, as constraint languages have overlapping semantic constructs. Both ShapeUML and ShapeVOWL are constraint language independent and have a defined visual vocabulary covering semantic constructs of RDF constraints.
F2: Support multiple data sources Data shape editors should support domain experts in defining data shapes referring to multiple data sources at once. The proposed visual notations allow to define RDF constraints in a visual fashion for different data sources.
F3: Support different serializations Data shape editors should not restrict domain experts to specific serializations of the data source nor the constraint language. A data graph can be serialized in different ways without changing the actual data or structure (e.g. RDF/XML vs Turtle). The visual vocabulary of both ShapeUML and ShapeVOWL covers semantic constructs of RDF constraints and is currently mapped to SHACL. Thus it is represented in RDF which can be serialized to different serializations.
F4: Support multiple ontologies Data shape editors should support domain experts in defining data shapes for data graphs annotated with multiple ontologies simultaneously. Both notations use URIs where necessary, e.g. for property paths or class constraints. Thus, multiple ontologies are supported by both notations.
F5: Multiple alternative modeling approaches Data shape editors should enable and support multiple alternative modeling approaches and allow domain experts to choose the most adequate one for their needs. Two modeling approaches, complementary to visual notations, were discussed in our previous work [15].
F6: Non-linear workflows Data shape editors should allow domain experts to keep an overview of the relationship between the data graph and data shapes, by providing non-linear editing. Although the data graph is not visualized together with the shapes graph, the data is visualized in the data panel. Terms related to data shapes’ assignment to instance data is covered by the visual notations, i.e. the appliesOn concept indicating on which data shown constraints apply by default.
F7: Independence of execution Data shape editors should allow importing and exporting the data shapes specified by the domain experts, as a use case may require to execute the data shapes elsewhere. Both ShapeUML and ShapeVOWL are currently mapped to SHACL and, thus, to RDF which provides interoperability and allows the import and export of data shapes.
Implementation
We describe the modular architecture of our RDF constraint editor UnSHACLed (Section 5.2.1), and relevant GUI components providing user interactions in a visual fashion (Section 5.2.2).
Architecture
UnSHACLed is a web-based RDF constraint editor independent from specific data formats, visual notations or validation engines.
Framework UnSHACLed is implemented with the web framework Vue.js following the model-view-viewmodel (MVVM) design pattern introduced by John Gossman in 2005.16
It therefore can run in modern Browsers and no additional server infrastructure such as databases are required.
Intermediate format UnSHACLed uses the state management pattern and library Vuex to store RDF constraints using an intermediate data format which allows all application components to access the RDF constraints in a controlled manner. Therefore other constraint languages can be supported by providing a mapping to the intermediate format without the need to change other parts of the implementation.
Visual notations UnSHACLed uses the VueKonva library to draw canvas graphics. Several components for both ShapeUML and ShapeVOWL were developed to render the two notations. New visual notations can be added in the form of new components which also read and write data to the intermediate format of Vuex store.
Validation For validation the intermediate format is transformed to a representation of a concrete RDF constraint language (currently supported is SHACL) and is passed together with the data to a separate validation engine. Another constraint language and validation engine can be used which only leads to adjustments in UnSHACLed with respect to transformations of the intermediate representation or invocation of another validation engine, no adjustments to the GUI are required.
In this section we discuss the graphical user interface of UnSHACLed, namely the different existing panels and interactions elements with which users can interact using visual notations.
Panels The GUI consists of three panels representing different parts of a Linked Data validation workflow: a data panel, modeling panel and validation result panel.
The

The user interface of our tool UnSHACLed consisting of several panels supporting different editing approaches.
The
The
Interactions Visual notations specify how RDF constraints are visualized, but UnSHACLed also allows to interact with the visualizations. Most notably nodes in the graph can be dragged and dropped inside the modeling panel. When hovering over an element a red and a green button appear representing actions for delete and editing. In the latter case a modal dialog opens in which users can change or add constraints. Thus, users can also edit RDF constraints using the visual notations and do not have to learn a specific textual syntax.
We conducted a comparative study to validate our main hypothesis that users familiar with Linked data can answer questions about visually represented RDF constraints more effective with ShapeVOWL than with ShapeUML. We compared how accurately users can answer questions about data shapes represented using either ShapeUML or ShapeVOWL. In Section 6.1, we describe the questionnaires to cover various aspects of the data shape domain based on the SHACL core specification. In Section 6.2, we elaborate on the experiment, in Section 6.3, we discuss potential threats to validity, in Section 6.4, we analyze the results of quantitative questions, and in Section 6.5, we analyze results of qualitative questions. Collected (anonymized) data, the questionnaire and user introductions as well as code for the quantitative and qualitative analysis are openly available at
Questionnaires
We created two RDF constraints-related questionnaires, the first containing questions related to RDF constraint concepts based on the SHACL specification which was used in an initial user study, and a second follow-up questionnaire covering more diverse visualization tasks and specific questions informed by the findings of the initial user study. These questionnaires are available at our online resource
Constraint concepts questionnaire
We derived questions from the SHACL specification relevant to RDF constraints and validation, which were used in a user study to validate our hypothesis.
We created questions to test (i) at least one constraint type per core constraint category of the SHACL specification, and (ii) other RDF constraint concepts relevant for validation, i.e. the targeting mechanism, property paths, severity and deactivation. The SHACL specification lists eight core constraint categories:
value type, 1 constraint
cardinality, 1 constraint
value range, 1 constraint
string-based, 1 constraint
property pair, 1 constraint
logical, 1 constraint
shape-based, 2 constraints
other, 2 constraints
We selected at least one constraint type for each category and created an associated question, for example “How many datatype constraints can you see?” for the constraint type datatype of value type category. The last two categories mix several relevant constraint types, so, we selected 2 constraints types for each.
Additionally we created one question for each of the aforementioned other relevant concepts, such as “How many property conditions with the severity ‘information’ can you see?” for the concept severity or “How many zero-or-more property paths can you see?” for the concept property paths.
Follow-up questionnaire
We created six questions to cover more diverse visualization tasks compared to the initial user study questionnaire and one question to test participants’ understanding of property paths for which we observed the highest error rate in the initial user study.
The questions cover the following six visualization tasks from ten Amar et al. [2] tasks, which we have chosen based on a taxonomy alignment from Brehmer and Munzner [9], see also Fig. 10 and the Task description paragraph in the next section.
Find extremum
Determine range
Retrieve value
Order
Compute derived value
Filter
To keep the follow-up questionnaire short, we have chosen to select maximum one task per taxonomy leaf node. Therefore, no question was asked for the tasks Find anomalies, Find clusters, Find correlation and Characterize distribution as the first three belong to the same taxonomy leaf node explore such as Find extremum, and the last belongs to the same taxonomy leaf node identify such as Determine range.
Additionally we asked the question “Do you see any ‘property path’ which is not just a single property?” because in the initial user study participants identified property paths in test cases when in fact no were shown. In case they answered yes, we also asked the question “Which is the property path and where do you see it, please elaborate” to obtain more information.
Method
The user study follows a within-subject design (also referred to as within-group or repeated measures [12]) in which all participants are confronted with examples of both visual notations ShapeUML and ShapeVOWL. However, to mitigate learning effects, we decided not to show the same examples twice to a single participant (see threats to validity in Section 6.3). We discuss the method of the user study by explaining the procedure, elaborating on recruited participants, and introduce the example test cases.
Procedure Potential participants with Linked Data knowledge were directly contacted by the authors. Those who participated were assigned in a round-robin fashion to one of two groups (groups A and B) to mitigate order effects (see threats to validity Section 6.3), and had to (i) read introductions to both ShapeUML and ShapeVOWL (presented in this order), and (ii) complete an online questionnaire. The initial user study is divided into three steps: a pre-assessment, a session in which the questionnaire is answered, and a post-assessment. Additionally, a smaller follow-up user study with only one questionnaire was performed in a later stage where the first author contacted previous participants again.
(i) The
(ii) The
(iii) The
Tasks Questions of the main questionnaire and the follow-up study represent different visualization tasks which are well studied in visualization task taxonomies and typologies (see Section 2.6). Our questions cover tasks from Amar et al. [2] and have the high level goal to discover [9] and more concretely to understand as defined by Pike et al. [9, 49], depicted in Fig. 10. Each question of the main questionnaire is a combination of Retrieve Value and Compute derived value tasks. Follow-up study tasks cover 6 out of 10 tasks from Amar et al. [2], maximum 1 task per typology leaf node in case there were multiple. Therefore we still cover all leaf nodes from the alignment between Amar et al. [2] and the multi-level topology from Brehmer and Munzner [9].
Participants The online questionnaire was sent to 14 potential participants in September 2020. 12 participants took part in the experiment, their age range was 23 to 40. All participants were highly educated: all have at least a master degree, one a PhD. According to a self assessment, all participants are familiar with Linked Data, most participants generate or use Linked Data (Fig. 9). All participants are familiar with UML class diagrams, the underlying notation of ShapeUML, and the majority of the participants is familiar with the tool WebVOWL, a tool implementing VOWL, the underlying notation of ShapeVOWL (Fig. 8). For the follow-up user study we could recruit 10 from the initially 12 participants in June 2021.
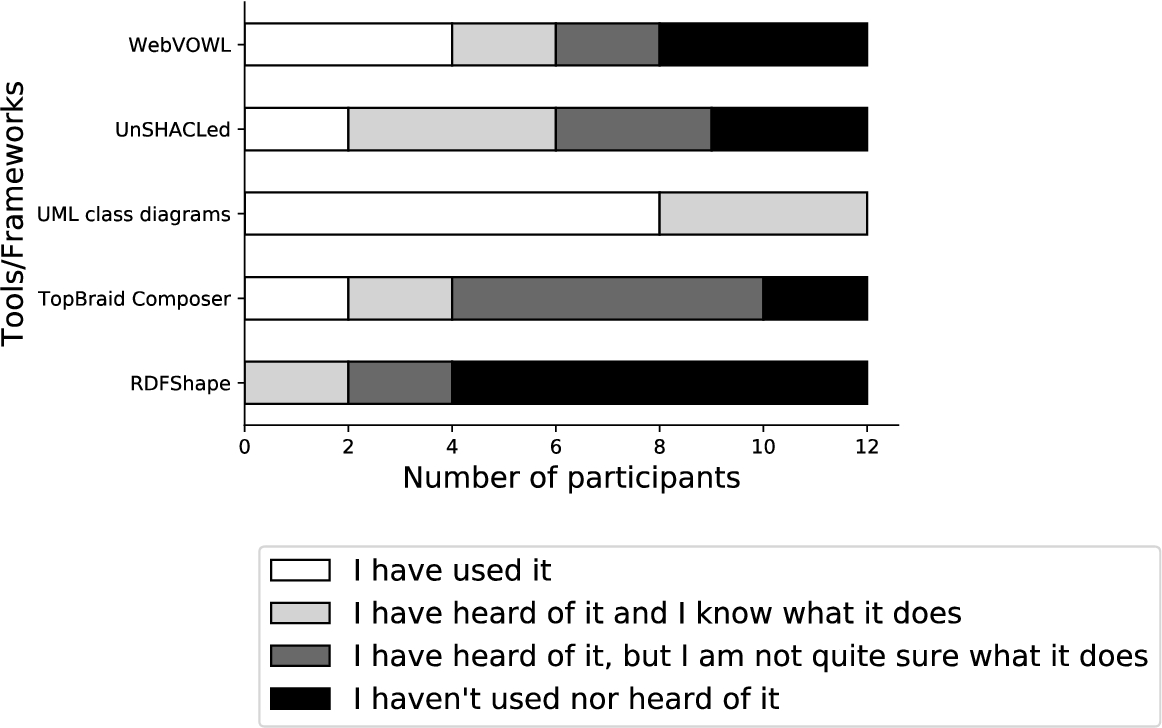
UML diagrams known by all participants and already used by the majority, other tools/frameworks less commonly known.

Answers based on self assessment: all participants are familiar with linked data, most participants generate or use linked data.

Selected tasks from Amar et al. [2] (bold) arranged in the typology of Brehmer and Munzner [9] according to their multi-level alignment. The user study had the high-level goal to discover, concretely to understand as defined by Pike et al. [49]. This involves mid-level search tasks of explore and lookup, low-level tasks of identifying, as well as cognitive interaction methods (introduce and manipulate). From 10 tasks introduced by Amar et al. only 6 were chosen to keep the follow-up study short, i.e. maximum 1 task per typology leaf node in case there were multiple.
Test cases All test cases besides the initially shown general example are real world datasets from online resources such as GitHub, the visual benchmark ShapeViBe,17
We created the
The
The
The
The

The occurrence of RDF constraint concepts in the test cases of our user study. Each test case contained several node and property shapes including cardinalities and a few selected other constraint concepts.
The
The
External and internal threats to the experiment’s validity exist, we identified the following threats and we discuss how we addressed them in our study design.
External validity threats
External validity threats occur when wrong inferences from sample data are made beyond the studied population or experimental setup [12]. We identified two external threats:
Participants familiarity with linked data This threat concerns the generalization to individuals outside the study [12]. All our participants were recruited from Ghent University, Belgium and RWTH Aachen, Germany and were familiar with Linked Data, thus the findings might not be generalizable to a more general population. However, this was intentional as we aimed to study users already familiar with RDF graphs, a prerequisite to understand RDF constraints which are the semantic constructs our visual notations represent.
Experiment environment This threat concerns the generalization to individuals outside the experiment’s setting [12]. The experiment was an online questionnaire. Participants could use any browser and computer, thus, they participates from a well-known environment. No specific experimental setup prevents generalizations to individuals outside our study.
Internal validity threats
Internal validity threats concern the experimental setup or experience of participants which threaten the ability to draw correct conclusions about the population in the experiment [12]. We identified three internal threats:
Selection bias This threat concerns the selection of biased participants, i.e. participants with certain characteristics that predispose them to have certain outcomes [12]. Our participants were all recruited from Ghent University and RWTH Aachen and have similar demographics. All participants have knowledge about Linked Data, but this is intentional as it is a prerequisite of the user study. To mitigate a selection bias all participants were assigned in a round-robin fashion to one of two groups, i.e. groups were not assigned based on specific characteristics. Some participants might be more familiar with one of the underlying visual notations of ShapeUML or ShapeVOWL. However, they self-assessed their familiarity with UML class diagrams and the WebVOWL tool in the pre-questionnaire, therefore any bias is visible. Please note that familiarity with one of the notations is considered positive as the design rationale of both visual notations is to build upon the underlying visual notation.
Sample size A small sample size may not have sufficient statistical power to detect an effect. Our sample size is relatively small. To mitigate this threat, we chose a within-subject study design [12]. It reduces errors associated with individual differences without requiring a large pool of participants.22
Order effects When participants perform tasks several times certain effects like learning can occur. To counterbalance potential order effects when presenting ShapeUML and ShapeVOWL, we assigned participants in a round-robin fashion to two different groups. The first group (group A) started with the first example in ShapeUML, the second in ShapeVOWL, the third in ShapeUML and so forth. Participants of the second group (group B) were presented the first example in ShapeVOWL, the second in ShapeUML and so forth.
We statistically validate the significance of the overall error rate differences between ShapeUML and ShapeVOWL (Section 6.4.1), analyze error rates per RDF constraint concept (Section 6.4.2), and analyze the participants’ self assessment given by a Likert scale [38] (Section 6.4.3).
ShapeUML/ShapeVOWL error rate
Based on the correct answers, we calculated the error rates of all questions to compare ShapeUML and ShapeVOWL: initial questions for general examples and the 4 test cases (Section 6.1.1), as well as for questions in the follow-up study covering different tasks (Section 6.1.2).

The error rates for both visual notations are relatively similar. Higher error rates for both visual notations were observed for property paths and maximum value.
The questions of Section 6.1.1 represent tasks identifying fundamental concepts and core constraints of RDF constraint languages.
Visualization tasks Questions of the main questionnaire combine the tasks to retrieve a value and compute a derived value, i.e. retrieving constraint types and compute the sum as aggregated value. If tasks resulted in wrong results it is usually because participants retrieved the value wrongly, for example because they did not understand a constraint concept or were unaware of default values (see following discussion); similarly for errors in the other tasks covered in the follow-up user study. However, for the main questionnaire a small possibility that participants retrieved the value correctly and just computed the sum wrongly cannot be ruled out completely.

The error rates for the different questions across the 4 real world test cases of the main questionnaire. Most RDF constraint concepts related questions were answered correctly. Participants made the most errors for property paths, maximum value, specific value and disjunction.
Best and worst recognized constraint concepts There was (almost) no difference in error rates between ShapeUML and ShapeVOWL for 8 out of 13 constraint concepts. Most notably this covers the questions with the least and most errors, meaning that certain constraint concepts are equally good/bad recognized.
The least errors in the main questionnaire, only 4%, were observed for
The most errors, more than 40%, were observed for
Constraint concepts with similar error rates between visual notations Other constraint concepts with similar error rates between ShapeUML and ShapeVOWL were datatype, disjunction, property, closed and comply with. Whereas comply with constraints are encoded in the same way in both notations, the other constraint concepts are encoded differently, usually with more visual features in ShapeVOWL.
Two real world test cases contained
Two test cases contained
Constraint concepts with error variation between visual notations Even though not significant, there is more variation between ShapeUML and ShapeVOWL error rates for 5 out of 13 constraint concepts. This includes the constraint concepts target, less than, specific value as well as constraints related to a minimum or maximum namely min length, max cardinality, and max value.
In 3 out of 4 real world test cases, there was 1
A few participants miscounted the constraint type
Participants counted
Error rates related to
Discussion of findings Based on the qualitative analysis of the results, we discuss findings related to default values, needed understanding of semantic constructs, and clarity of questions.
Default values should be encoded explicitly. On the one hand, according to provided feedback, encoded severities and constraint deactivation helped a participant to correctly interpret these concepts and discard the wrong assessment that these concepts are transitive. On the other hand, missing defaults lead participants to assume wrong cardinality defaults.
Clear documentation and/or tooltips are necessary to support users in understanding constraint concepts, because some constraint types are conceptually similar and need clarification. We noticed that users mistook e.g. different minimum and maximum constraint concepts with each other and property paths with a combination of logical relationships and cardinalities. A visual notation represents semantic constructs, the used visual notations do not suffer from symbol redundancy, symbol overload or symbol excess, thus they provide semiotic clarity (see Section 4). However, if underlying semantic constructs are not clear to a user, visual notations can only support to a small extent to alleviate misunderstandings, e.g. by providing semantic transparency.
We acknowledge that a limited number of questionnaire questions leave room for interpretation which negatively influences the analysis of results. For the follow-up user study we relied on adapted questions from related work, increasing consistency. Furthermore, for further research on RDF constraint visualization, we recommend a pilot study with a smaller number of participants – ideally from different backgrounds – to reveal possible ambiguities in questions.
The post-questionnaire contained three questions in which the participants could self assess how confident they are with their answers, if they prefer ShapeVOWL over ShapeUML and if they would like to use ShapeVOWL also for RDF constraint editing. These three questions were asked using a 7-point Likert scale from 1 (not agree at all) to 7 (fully agree).
All participants were asked if they are confident that their provided answers are correct. Their average value is 3.6 and median is 3, thus in a self assessment
All participants were asked if ShapeVOWL is preferred and the average value is 4.6 and median is 5, thus in a
Qualitative analysis
Qualitative feedback is derived from each test case in the main questionnaire and generally for both notations in the post assessment. We qualitatively analyze provided answers for the post assessment following a common data analysis for qualitative data [12]: we explain the used analysis method, and present the results. In total 58% of participants answered this question.
Method
A general procedure for a qualitative analysis involves the process of “coding” [12], a commonly used technique for reducing qualitative data to meaningful information by assigning labels to chunks of data [53]. Following common guidelines [12] we read answers provided in the post questionnaire and thus were able to identify 5 high level codes: advantages, disadvantages, uncertainty, suggestion and preference. These codes are further detailed in a hierarchy, for example the high level code advantages is further specified as easier comprehensible, display of sparse constraints and space efficiency. In a similar fashion the other high level codes are further specified to be used as annotation for the qualitative data.
Interpretation and meaning
Based on the created annotations we interpret the feedback provided by the participants by discussing the high level codes such as advantages and which information specifically was provided.
Participants preference and suggestions
Advantages
Disadvantages
Uncertainty
Discussion and conclusion
Data integration as main challenge in our time can be addressed with the uniform graph data model of RDF. Use case specific data quality requires validation, but currently human users – often the creators of constraints – are not well supported when viewing and editing RDF constraints. Therefore, we investigated visual notations for RDF constraints tailored for the human information processing system to answer the research question how we can support users in viewing RDF constraints?. Furthermore, we presented a new version of our tool UnSHACLed that implements investigated visual notations. The human information processing system requires effective visual notations that move the cognitive load from the slow cognitive processing to the fast perceptual processing.
The two visual notations UML and VOWL are broadly used within the Semantic Web community. We reused these already familiar to users notations and adapted them for RDF constraints: the two notations are dubbed ShapeUML and ShapeVOWL.
In particular, we investigated in this work the hypothesis that “users familiar with Linked Data can answer questions about visually represented RDF constraints more effective with ShapeVOWL than with ShapeUML”, because VOWL was built with the aim to be intuitive. We could not validate this hypothesis: there was no significant difference in error mean values which would indicate that better results are achieved with ShapeVOWL. However, analyzing the design considerations of both visual notations and user study results in detail we conclude the following things.
Potential for ShapeVOWL For both notations on average 81% of questions related to RDF constraints were answered correctly. Even though different constraint types were recognized more accurate with one or the other notation, we could not measure a statistically significant error difference between ShapeUML and ShapeVOWL in the performed user evaluation. However, a comparison between both visual notations based on design principles (Section 4 and Table 1) and participant’s self assessment to prefer ShapeVOWL
ShapeVOWL disadvantages Disadvantages brought up in the qualitative analysis – such as complicated interaction or space efficiency – mainly concern more complex and dense RDF constraint graphs. Instead of aiming for a one-size-fits-all visual notation, such disadvantages can be mitigated by complementary functionality of RDF constraint editors implementing ShapeVOWL. Existing visualization task taxonomies [9, 63, 67] may guide this feature implementation as they allow to describe cognitive tasks with respect to goals and thus provide candidate tasks which can be implemented as interactive functionality, e.g. filtering or sorting displayed constraints based on selected criteria in the tool rather than the mind of the user. Similarly, such functionality can improve the use of ShapeUML as well.
Clear and efficient text encoding of ShapeUML with potential improvement Despite visual features for cognitive effective processing by humans, we noticed that ShapeUMLs textual representation in certain cases was as effective as ShapeVOWL and sometimes even more effective. According to our qualitative analysis, ShapeUML has an advantage for more dense or complex RDF constraint graphs due to its space efficient representation. Although text is processed using the slower cognitive processing system [43], this system might be needed for RDF constraints in any case.
Visual notation Visual notations developed with effectiveness in mind may not be necessarily adopted [14], but we built on already familiar visual notations to increase a possible adoption. Despite optimized perceptual processing, users may fall for a familiarity bias: even though experts perform worse with familiar less-optimal notations, they still hesitate to switch to a non-familiar but more optimal notation [14]. Our solution tries to combine the best of both worlds, i.e. familiar notations adapted for RDF constraints by relying on cognitive effective design principles. However, more involvement from users of different domains is needed, for instance to resolve findings of our study related to misunderstood terminology or concepts. Improvements such as more specific labels or visual symbols for conceptually similar constraint types can be developed in a participatory fashion with targeted audiences, which increases the chance of adopting [14].
Limitations Our work covers the accurate processing of visually represented RDF constraint concepts and, thus, does not cover scalability of visual notations or the speed in which users processed presented information. To the best of our knowledge this is the first work investigating visual notations for RDF constraints in detail. Hence our results are initial results. We studied how different RDF constraint concepts can be visualized and how this affects the accuracy of user-provided answers based on related questions.
Future work Findings of our analysis suggest
Regarding the visual notations, a visually enhanced ShapeUML variant – as suggested by a participant – could represent a trade-off in space efficiency and effective processing and it would be an appropriate candidate for future developments and user evaluations.
Finally, a mapping from ShEx concepts to the presented visual notations could motivate efforts to extend the presented tool UnSHACLed with respect to ShEx validation of RDF data, thus more users would profit from the developed effective visual notations.
Footnotes
Acknowledgements
We would like to thank the organizers and participants of the Open Summer of Code 2019 in Belgium in which an updated version of UnSHACLed was implemented. We also thank all participants of the user study for their time and efforts as well as the reviewers for their constructive comments which helped to improve this work. The described research activities were funded by Ghent University, imec, Flanders Innovation & Entrepreneurship (VLAIO), and the European Union. Ruben Verborgh is a postdoctoral fellow of the Research Foundation – Flanders (FWO).