
Abstract
Ontology matching is the task of generating a set of correspondences (i.e., an alignment) between the entities of different ontologies. While most efforts on alignment evaluation have been dedicated to the evaluation of simple alignments (i.e., those linking one single entity of a source ontology to one single entity of a target ontology), the emergence of matchers providing complex alignments (i.e., those composed of correspondences involving logical constructors or transformation functions) requires new strategies for addressing the problem of automatically evaluating complex alignments. This paper proposes (i) a benchmark for complex alignment evaluation composed of an automatic evaluation system that relies on queries and instances, and (ii) a dataset about conference organisation. This dataset is composed of populated ontologies and a set of competency questions for alignment as SPARQL queries. State-of-the-art alignments are evaluated and a discussion on the difficulties of the evaluation task is provided.
Introduction
Ontology matching is the task of generating a set of correspondences (i.e., an alignment) between the entities of different ontologies. This is the basis for other tasks, such as data integration, ontology evolution, and query rewriting. While the field has fully developed in the last decades, most works are still dedicated to the generation of simple correspondences (i.e., those linking one single entity of a source ontology to one single entity of a target ontology). However, simple correspondences are insufficient for covering the different kinds of heterogeneities (lexical, semantic, conceptual) in the ontologies to be matched. More expressiveness is achieved by complex correspondences, which can better express the relationships between entities of different ontologies. For example, the piece of knowledge that a conference paper has been accepted can be represented as a class IRI ekaw:Accepted_Paper in a source ontology, or as a class expression representing the papers (the range of cmt:hasDecision is cmt:Paper) having a decision of type cmt:Acceptance in a target ontology. The correspondence
Earlier works in the field have introduced the need for complex ontology alignments [18,46], and different approaches for generating them have been proposed in the literature afterwards. These approaches rely on diverse methods, such as correspondence patterns [10,28,29], knowledge-rules [17], statistical methods [24,25,47], competency questions for alignment [43,45], genetic programming [22] or still path-finding algorithms [26]. In others fields, such as relational databases, different approaches have been proposed so far [5,12], however, covering less expressive knowledge representation languages and models. The reader can refer to [42] for a survey on complex matching. While works on complex ontology matching have been mostly dedicated to the development of approaches able to generate complex alignments, benchmarks1
Following the definition of “benchmark” as a standard by which something can be measured or judged (from the American Heritage® Dictionary of the English Language, Fifth Edition. S.v. “benchmark.” Retrieved January 7 2019 from
In this paper, a benchmark for evaluating complex alignments is proposed. This benchmark is composed of a dataset involving ontologies, populated with controlled and shared instances, reference competency question queries, and an automatic evaluation system. “Controlled” or “regularly” populated instances mean that every entity (class or property) concerned by the alignment should have at least one instance in both ontologies. While classical benchmarks in the field [8,48] rely on reference alignments and measurements of compliance between the generated and reference alignments (usually using classical precision and recall as evaluation metrics), here we propose a set of competency questions for alignment (CQA) as reference. A competency question expresses, through a SPARQL query, the knowledge an alignment should cover between the source and target ontologies [37]. In particular, we propose two evaluation measures. While the CQA coverage measure relies on pairs of equivalent SPARQL queries (source and target queries) and measures how well an evaluated alignment covers these queries, the intrinsic precision compares the instances of the correspondences members. Intrinsic precision balances the CQA coverage like precision balances recall in information retrieval.
The contribution of this paper is manifold:
we discuss the challenges of automatic evaluation of complex alignments with respect to classical evaluation in the literature;
we propose an automatic approach for evaluating complex alignments, which is based on competency questions for alignment in the form of SPARQL queries as references, and comparison of instances;
we propose a dataset with controlled instance population and competency questions for alignment on which the alignments are evaluated;
we evaluate state-of-the-art complex alignments on the proposed dataset and discuss their main strengths and weaknesses.
The automatic evaluation system and the populated datasets (and the scripts to generate them) are published under LGPL license.3
The rest of this paper is organised as follows. The background on complex ontology matching and competency question for alignment are introduced in Section 2. Related works are discussed in Section 3. Then, the proposed evaluation system is presented in Section 4. Next, the methodology followed to create the dataset and the dataset itself are detailed in Section 5. Evaluation of existing complex alignments over the benchmark is discussed in Section 6. Finally, conclusions and future work are presented in Section 7.

Fragment of the cmt ontology used in the running examples.
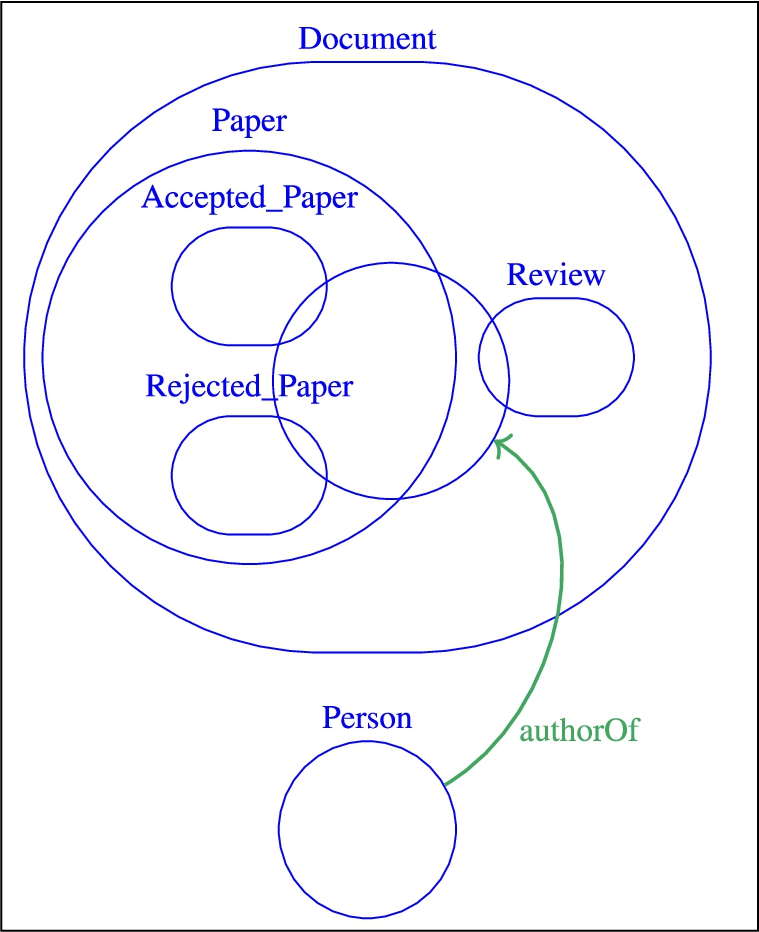
Fragment of the ekaw ontology used in the running examples.
Before introducing the notions of complex alignment and competency questions, the ontologies and their instances that will be used in the rest of this paper are introduced. The ontologies cmt and ekaw come from the Conference dataset [48]. Their fragments are depicted in Figs 1 and 2 using the format proposed in [33].
Complex ontology alignment
Ontology matching (as in [9]) is defined as the process of generating an alignment A between two ontologies: a source ontology o and a target ontology
a correspondence is
a correspondence is
A simple correspondence is usually noted (s:s), and a complex correspondence can be (s:c) if its source member is a single entity, (c:s) if its target member is a single entity or (c:c) if both members are complex entities. An approach which generates a complex alignment will be referred as a “complex matching approach”, a “complex matching system” or a “complex matcher” in the rest of this paper.
Competency questions for alignment (CQAs)
In ontology authoring, in order to formalise the knowledge needs of an ontology, competency questions (CQs) have been introduced as ontology’s requirements in the form of questions the ontology must be able to answer [11]. As defined in [37,43], a competency question for alignment (CQA) is a competency question which should be covered by two or more ontologies, i.e., it expresses the knowledge that an alignment should cover (if both ontologies’ scopes can answer the CQA). The first difference between CQA and CQ is that the scope of the CQA is limited by the intersection of its source and target ontologies’ scopes. The second difference is that this maximal and ideal alignment’s scope is not known a priori (as it is the purpose of the alignment). As the ontology authoring competency questions (CQs) [27], a CQA can be expressed in natural language or as SPARQL SELECT queries.
Inspired from the predicate arity in [27], the notion of A unary question expects a set of instances or values, e.g., “Which are the accepted papers?” (paper1), (paper2). A binary question expects a set of instances or value pairs, e.g., “What is the decision on a paper?” (paper1, accept), (paper2, reject). A n-ary question expects a tuple of size n, e.g., “What is the decision associated with the review of a given paper?” (paper1, review1, weak accept), (paper1, review2, reject).
Related work
Evaluation of matching systems is carried out over an
This dimension refers to the evaluation of the system performance in terms of run-time and memory usage. It is often performed over ontologies of different sizes and levels of expressiveness. Most OAEI tracks adopt this kind of evaluation.
Evaluation of the generated alignment given different (and controlled) inputs. Such an evaluation was proposed for the GeoLink and Hydrography datasets of the OAEI Complex track [40]. Given a list of entities, the system should be able to find the correct (complex) construction involving these entities.
Evaluation of the output alignment itself over a dataset. This evaluation can be intrinsic or extrinsic. With the former, the quality of an alignment can be measured based on its intrinsic characteristics, as in [21] who evaluates the quality of an alignment over its logical coherence or in [31] where a good alignment should not violate the conservativity principle. With the latter, the evaluation is usually based on the compliance of the generated alignment with respect to a reference one (i.e., applying precision and recall metrics).
The quality of an alignment can also be assessed regarding its suitability for a specific task or application [15,16]. While current evaluation settings have not been set-up for evaluating matchers specifically designed for a given application or with a given task in mind, alignments generated by general purpose matchers are rather evaluated with respect to its suitability to a given task.
In the following, the main related works considering these evaluation dimensions are discussed.
Complex alignment evaluation metrics
Most works on alignment evaluation address the evaluation of simple alignments using a reference alignment or a sample of it. This is what has been done in the context of the OAEI campaigns. With respect to the evaluation of complex alignments, they have been evaluated manually, usually in terms of precision [25,28,29,47], or on specific datasets in order to compute recall. In particular, the approach adopted in [25,47] estimated their recall based on a recurring pattern (Class by attribute-value) between DBpedia and Geonames. They estimated the number of occurrences of this pattern between these ontologies and calculated the recall based on this estimation. In [26] a set of reference correspondences between two ontologies was manually created, involving few reference correspondences from which only two could not be expressed with simple correspondences. In [47] the authors proposed an algorithm to create an evaluation dataset that is composed of a synthetic ontology containing 50 classes with Class-by-attribute-value correspondences with DBpedia and 50 classes with no known correspondences with DBpedia. Both ontologies are populated with the same instances. In [34], inspired from [12], the approach for discovering complex attribute correspondences (i.e., {First Name, Last Name} = {Author}) between web interfaces is evaluated using target accuracy (that includes target precision and target recall) as metric. It evaluates how similar the generated alignment is with respect to a set of manually collected ones, using the notion of synonym attribute sets.
As discussed in [43] (inspired from [2]), alternative metrics of accuracy and top-x accuracy have been also applied in evaluation settings in which the number of correspondences is predefined, e.g., there is one correspondence for each entity of the target schema/ontology. The accuracy is calculated as the percentage of predefined questions having a correct answer. A “question” in this context could be a source entity to be matched and the “answers” the correspondences having this entity as source member. Some approaches output various answers for each question, e.g., a ranked list of correspondences for each source entity. In this case the top-x accuracy is the percentage of questions whose correct answer is in the top-x answers to the question. For example, top-3 accuracy is the fraction of source entities for which the correct correspondence is in the three best correspondences generated by the system. Alternatively, the approach in [39], to evaluate complex correspondences between agronomic ontologies is based on manually comparing the results of the reference queries and queries automatically rewritten with the help of the complex alignments.
Complex alignment benchmarks
As discussed above, complex matchers are usually evaluated on custom evaluation alignment sets, usually covering the specificities of the approach to be evaluated. Recently, the first complex benchmark has been introduced in the OAEI campaigns [40]. The track consists of four datasets from different domains and considering different evaluation strategies:
a consensual complex alignment was created using the query rewriting methodology from [41]. Each generated correspondence is manually classified as true positive or false positive, with respect to a reference alignment. The evaluated and reference correspondences are (s:c). In 2019, the benchmark presented in this paper has been used to automatically evaluate complex alignments.
a set of ontologies on the hydrography domain and a pair of ontologies from GeoScience (more details bout the GeoLink dataset are provided in [49]). The matchers are evaluated following three subtasks: (i) finding all entities which appear in a given correspondence, (ii) finding the right construction involving those entities, and (iii) finding the complex correspondences from scratch. Only the first subtask was implemented in the OAEI 2018 campaign [1], and the evaluation was automatically carried out using classical precision and recall (all alignments were simple equivalences). In 2019, a close metric to relaxed precision and recall [6] has been applied to entity identification and relationship identification tasks.
a set of CQAs over agronomic knowledge bases is rewritten with the evaluated alignments. Each rewritten query is manually classified as semantically equivalent to the source query or not. A “Query Well Rewritten” metric measures the percentage of CQA which had a semantically equivalent query after the rewriting process. Each correspondence of the evaluated alignment is also manually classified as true positive or false positive without a reference.
In 2018, only two systems, AMLC [10] and CANARD [44], were able to generate complex correspondences for those datasets. In 2019, a new system has been proposed, AROA4
Regarding task-oriented evaluation, [9] argued that different task profiles can be established to explicitly compare matching systems for certain tasks, such as ontology evolution or query answering, that have different constraints in terms of coverage and runtime. One such task-oriented evaluation approach was introduced in the OAEI in 2015 at the OA4QA track5
In [13], an “end-to-end” evaluation in which a set of queries are rewritten using an evaluated alignment is proposed. The results of the queries are manually classified by relevance for a user on a 6-point scale. This evaluation was performed with two rewriting systems. If a source member e does not appear in any correspondence of the alignment, the upwards rewriting system will use super-classes of e which appear as source member in the alignment’s correspondences and the downwards system will use subclasses of e. Three alignments were evaluated. For each alignment, 20 concepts were randomly selected to be queried and evaluated.
While the task-based evaluation is relevant for both simple and complex alignments, some tasks tend to have higher expressiveness requirements, such as query rewriting and ontology merging, as discussed in [41]. Complex alignments for query rewriting have been the focus of the work of [19],6
In fact, the query rewriting task can be seen as one of the main applications for complex alignments, and evaluation approaches based on this task are highly relevant. In the case of simple alignments, a naive approach for rewriting SPARQL queries can be to simply replace the IRI of an entity of the initial query by the IRI of the corresponding entity in the alignment, as described in [4]. For complex alignments, such a naive approach is not enough, as the semantics of the alignment itself has to be taken under consideration. [7] proposed an approach for writing specific SPARQL CONSTRUCT queries, but most query rewriting systems still rely on simple or (s:c) complex correspondence and fail in covering highly expressive (c:c) correspondences.
With respect to the evaluation of complex alignments, several works focus on manually evaluating alignments, in terms of precision as in [28,29], calculating recall on recurring patterns as in [25,47], or relying on a sample of reference correspondences [26]. While most of these approaches focus on the comparison of correspondences, we shift the problem to the comparison of instances. We propose an evaluation benchmark that considers queries as references and relies on metrics based on query coverage (as for recall) and intrinsic precision (as for precision without a reference alignment). Our approach requires, however, datasets populated in a controlled manner, differently from the datasets in [49].
As [32], we have queries as references instead of reference alignments. Close to ours, the evaluation in [32] relies on a synthetically populated version of the Conference dataset. However, their queries are executed over a merged ontology and alignments are limited to simple correspondences. Here, the queries are executed over different populated ontologies. As [13], here a set of queries are rewritten using an evaluated alignment. However, their evaluation process relies on manually classifying the query results.
Table 1 summarizes the existing alignment evaluation benchmarks that are close to our proposal (
Comparison of ontology alignment evaluation benchmarks. The Type of corresp. column represents the form of the most expressive correspondences dealt with by the benchmarks – (c:c) is more complex than (s:c), which is more complex than (s:s)
Comparison of ontology alignment evaluation benchmarks. The Type of corresp. column represents the form of the most expressive correspondences dealt with by the benchmarks – (c:c) is more complex than (s:c), which is more complex than (s:s)
As discussed above, evaluation of simple alignments have been largely exploited in the literature and in particular in OAEI campaigns. Automatic evaluation of complex alignments being addressed to a lesser extent [40]. In terms of evaluation metrics, most of the solutions so far are based on the comparison of alignments using syntactic or semantic approaches leaving under-exploited the comparison at instance-level. This is the proposal of this paper.
With respect to a
A
An
With respect to (i), we propose two evaluation measures. While the CQA coverage measure relies on pairs of equivalent SPARQL queries (source and target queries) and measures how well an evaluated alignment covers these queries, the intrinsic precision compares the instances of the correspondences members. Intrinsic precision balances the CQA coverage like precision balances recall in information retrieval. With respect to (ii) a methodology based on CQAs, as introduced in [43], is proposed to synthetically populate ontologies. This methodology was applied to five ontologies of the well-known Conference dataset [48].
In the following, before detailing the CQA coverage metric (Section 4.2), the overall evaluation workflow adopted in the approach is presented (Section 4.1). Then, the description of the intrinsic metric is presented (Section 4.3).

Evaluation process of the alignment
Figure 3 presents the overall workflow adopted in the proposed approach. The steps followed in the evaluation process are:
CQA coverage metric
With this evaluation strategy, the reference is a set of equivalent CQAs in the form of SPARQL queries. An evaluated alignment
Source CQA anchoring
As stated above, the reference in this kind of evaluation is a set of equivalent CQAs as SPARQL queries. Each source CQA
Two rewriting systems have been considered. None of these systems consider the correspondence relation or correspondence value. The first system is the one from [38]. Each triple of  which contains ekaw:Accepted_Paper which is the source member of the correspondences
The rewritten query using the  This rewriting system cannot however work the other way around. For example, the CQA
  cannot be rewritten with
The second system is based on instances and has been developed in the context of this paper. The instances 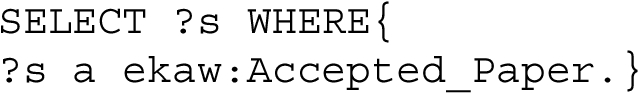 retrieves a set of accepted paper instances in the ekaw ontology. This set of instances is then compared to the set of instances described by the source member of each correspondence. In this case, ekaw:Accepted_Paper describes the same instances as the source member of all the
  This rewriting system allows queries such as
  to be rewritten too using the inverse of
Out of the existing rewriting systems dealing with complex correspondences, the one described in [38] deals with the most types of constructions. So far, the proposed instance-based rewriting system is one of the few systems able to deal with (c:c) correspondences. However, it is a feature of the system that (c:c) cannot be combined together.
Comparison
The instances
Scoring
The relation (associated with the query precision and query recall values) between
The query F-measure (equally balancing precision and recall) was preferred over other metrics to be the scoring function as it is commonly used in alignment evaluation to aggregate the results of precision and recall. However, users may prefer one score to another, depending on alignment usage or manipulation. This was an implementation choice, as a matter of facilitating the comparison of the evaluated alignments.
Aggregation
As the rewriting phase outputs all the possible queries regardless of the correspondence relation, a lot of noise can be introduced. Moreover, the same query can be output by both rewriting systems. Therefore, for each
The global aggregation method is the average function. The final output of the evaluation system is an average query precision, query recall and query F-measure score for the evaluated alignment.
Intrinsic precision
The CQA coverage evaluation locally aggregates the results over the CQA and not the rewritten queries because of the noise added by the rewriting systems. In return, an alignment with all the possible correspondences (correct and erroneous) between the source and target ontologies would obtain a good CQA coverage score. To counterbalance the CQA coverage score, we propose to measure the
For each correspondence
Different precision scores are given for each type of correspondence member relation: the equivalent precision measures the percentage of correspondences whose members are exactly populated with the same instances, the subsumed precision measures the percentage of correspondences whose members subsume one another, the same goes for overlapping and not disjoint which consider correct all correspondences except the disjoint ones.
CQA-based dataset
In this section, first the methodology followed to create the evaluation dataset (populated ontologies and associated CQAs) is presented (Section 5.1). Then, the OAEI Conference dataset (Section 5.2) is described, followed by the population of its ontologies from real-life data (Section 5.3). Finally, the set of evaluation CQAs extracted from the CQAs used for the dataset population is discussed (Section 5.4).
Dataset creation methodology
The purpose here is to create a dataset on which ontology matchers can be run and on which the evaluation described in the previous section can be performed. Therefore, the dataset must contain populated ontologies and a set of CQAs expressed as SPARQL queries over these ontologies. The population step is very important as the chosen instances may influence the result of the evaluation.
The proposed methodology has the following main steps:
Create a set of CQAs based on an application scenario. Only unary and binary CQAs were considered in this work.
Create a pivot format (i.e., the bridge format used for representing in a uniform way the data extracted from the data sources) which covers all the CQAs from step 1.
For each ontology of the dataset, create SPARQL INSERT queries corresponding to the pivot format.
Instantiate the pivot format with real-life or synthetic data.
Populate the ontologies with the instantiated pivot format using the SPARQL INSERT queries.
Run a reasoner to verify the consistency of the populated ontologies. If an inconsistency is detected, try to change the interpretation (i.e., add, suppress or modify axioms) of the ontology and iterate over steps 3 to 5.
Based on SPARQL INSERT queries, translate the CQAs covered by two or more ontologies as SPARQL queries.
In this methodology, the interpretation of the ontologies is the same for ontology population and CQA creation. The creation of CQAs can be done by interviewing users and domain experts, as recommended in the NeOn methodology [35] for competency question authoring. The CQAs can also derive from the competency questions which were used to design the ontologies of the dataset. In this implementation, however, one expert created the CQAs. This set has been discussed with a second expert who judged the set exhaustive enough for covering the conference organisation scenario.
In [41], (c:c) correspondences were not included in the dataset hence no exhaustive coverage could be guaranteed. However, as CQAs represent basic pieces of knowledge, they can be exhaustively covered by an alignment regardless of the shape of the correspondences. Using the same list of CQAs for ontology population and evaluation also insures the consistency of the answers of the evaluation CQAs.
Conference dataset
The dataset used here is the Conference dataset7
In the first OAEI complex track, an evaluation was proposed over a consensual complex alignment between three ontologies (cmt, conference, ekaw) [40]. Here, the five ontologies covered by [41] have been populated: cmt, conference (Sofsem), confOf (confTool), edas and ekaw (Table 2).
Number of entities by type of each ontology
Even though this dataset has been largely used, it has only been partially populated. In the OA4QA track, only the classes covered by the 18 queries were populated and the creation of the synthetic
In order to create the CQAs and re-interpret the Conference ontologies, the conference organisation scenario has been considered. First, the list of CQA has been established by examining a real-life use case: the Extended Semantic Web Conference 2018 edition. Second, the list of CQAs created from this use case has been extended by exploring the conference ontologies scope. The Extended Semantic Web Conference8
As mentioned before, the first step of the process was to create a list of CQAs and re-interpret the ontologies under the perspective of a conference organisation application. By analysing the ESWC 2018 website, a first list of CQAs was created. The methodology was followed based on this first list of CQAs. The pivot format was instantiated with the website data.
While running the Hermit [30] reasoner in step 6 of the methodology, several exceptions were encountered. For most of them, the problem was with the interpretation of the ontology. For example, in the cmt ontology, cmt:hasAuthor is functional. Unlike primarily interpreted, this means that cmt:hasAuthor represents a “is first author of” relationship between a cmt:Paper and a cmt:Author. Then, the SPARQL INSERT queries have been modified in order to fit the new interpretation of the ontology.
Two exceptions have been detected, which could not be resolved by a change of interpretation. In that case, the original ontologies have been slightly modified:
cmt: the relation cmt:acceptPaper between an Administrator and a Paper was defined as functional and inverse functional. This leads to an inconsistency when a conference administrator accepts more than one paper. cmt:acceptPaper has been changed to be only inverse functional.
conference: conference:Contribution_1st_author was disjoint with conference:Contribution_co-author, which lead to an inconsistency when a person was at the same time the first author of a paper and the co-author of another paper. The disjunction axiom from the ontology has been then removed.
If a CQA was not exactly covered by an ontology, the ontology would not be populated with its associated instances. This results in an uneven population of equivalent concepts in the ontologies. For example, considering the ekaw and cmt ontologies, which both contain a Document class. “What are the documents?” was not a CQA whereas paper, review, web site and proceedings were the focus of CQAs. While ekaw:Document class has for subclasses ekaw:Paper, ekaw:Review, ekaw:Web_Site and ekaw:Conference_Proceedings, cmt:Document has only two subclasses cmt:Paper and cmt:Review. ekaw:Document will, by consequence of its subclasses, be populated with paper, review, website and proceedings instances whereas cmt:Document will be populated with paper and review instances only.
Conference data analysis
In order to populate the conference ontologies and make it close to real scenarios, some figures from past conferences have been analysed. The information from ISWC 2018 and ESWC 2017 from Scholarly Data9
percentage of accepted papers having at least a program committee member as author: 44% for ESWC 2017 and 59% for ISWC 2018
distribution of the number of authors per submitted papers (ESWC 2018): 1 (6%), 2 (17%), 3 (29%), 4 (26%), 5 (9%), 6 (8%) ou 7–10 (2%)
distribution of the number of collaborating institutions per accepted papers over scholarly data (global represents the statistics over all data from the scholarly data endpoint) (see Table 3)
Collaborating institutions per accepted papers over scholarly data
distribution of the number of authors per accepted papers over scholarly data (see Table 4)
Authors per accepted papers over scholarly data
The first population of the ontologies with the ESWC 2018 data left some important knowledge un-represented. For example, the concepts of external reviewer, presenter of a paper, and person affiliation, which appeared important for a conference organisation were not available on the website. Always in the perspective of conference organisation, the conference ontologies were browsed to complete the list of CQAs with useful concepts. The pivot format and associated SPARQL INSERT queries were also extended to cover the new list of CQAs. Then, the next step was to artificially generate the pivot format instantiation. For that, a score between 1 and 10 is given to each conference. This score determines the number of submitted papers, program committee members, etc. as shown in Table 5.
Number of submitted papers, pc members, etc. for a conference of size 1 and 10 (min–max values)
Number of submitted papers, pc members, etc. for a conference of size 1 and 10 (min–max values)
The statistics from the ESWC 2018, ISWC 2018, ESWC 2017 datasets were globally reproduced: 50% of papers have at least a program committee member as author, the number of authors per paper is 1 (6%), 2 (17%), 3 (29%), 4 (26%), 5 (9%), 6 (8%) or 7–10 (2%), the number of collaborating institutions is around 1 (40%), 2(30%), 3 (17%), 4 (7%), 5 (5%) 6(2%). These statistics are pointers, as the generation process is pseudo-random, these figures may vary in practice. Some proportions were arbitrarily chosen: 20% of the submitted papers are poster papers, and 20% are demo papers, the regular paper acceptance rate is in [0.1–0.7] and a poster/demo paper acceptance rate is in [0.4–1.0], 20% of the reviews are done by an external reviewer.
In order to evaluate statistics-based matchers on the benchmark, different sets of population were considered for the ontologies. The idea is to provide the same conference ontologies but with partially overlapping set of instances (instances linked with owl:sameAs). To do so, 6 sets of instance population with a more or less important overlapping parts were created. Each ontology is populated with different conferences10
A conference here refers to the data related to a conference event.
0%: 5 different conferences per ontology
20%: 1 common conference for all ontologies and 4 different conferences per ontology
40%: 2 common and 3 different conferences
60%: 3 common and 2 different conferences
80%: 4 common and 1 different conference
100%: 5 common conferences for all ontologies
Percentage (min, max) of common submitted papers in the different datasets. The second line reads “In the 20% dataset, the proportion of common paper instances is between 7 and 11%”. Which means that for one of the ontologies, the common part of paper instances represents 7% of all its paper instances. For another ontology, the common part of paper instances represents 11% of all its paper instances
Not all the ontology concepts were covered by the pivot CQAs. Table 7 shows the number of entities covered by the CQAs, i.e., instantiated after the CQA-based population, in each ontology.
Number of populated entities by ontology. Number of populated entities/number of entities in the original ontology
For the evaluation, the focus is on CQAs which can actually be covered by two or more ontologies. To write the CQAs which will be used in the dataset, the list of CQAs used for the population was trimmed:
the CQAs which were only covered by one ontology
some CQAs which were not considered relevant such as “What is the name of a reception?”, the answer being an rdfs:label “Reception” for all reception instances.
The remaining CQAs were then written as SPARQL SELECT queries by adapting the SPARQL INSERT queries. Table 8 shows the number of CQAs which were covered by the pivot format, by each ontology (in the SPARQL INSERT queries) and which were transformed into SPARQL SELECT queries for the evaluation dataset. 278 SPARQL SELECT queries result from this process.
Number of initial (pivot) CQAs covered by each ontology and number of evaluation (eval) CQAs covered by each ontology
Number of initial (pivot) CQAs covered by each ontology and number of evaluation (eval) CQAs covered by each ontology
Existing alignments over the conference dataset were evaluated with the proposed evaluation system. The dataset used for the evaluation is the 100% dataset so that instance-based precision can be measured.
Evaluated alignments
Existing alignments between the Conference ontologies in EDOAL format11
the query rewriting oriented alignment set12
the ontology merging oriented alignment set12 from [41]. It has been manually generated and is composed of 313 correspondences with 54 complex correspondences from 9 different patterns (some patterns are composite) – 10 pairs of ontologies.
the reference simple alignment13
the output alignment12 from [29] (automatically generated)–complex correspondences found on 4 pairs of ontologies. This alignment is the smallest one as only one correspondence has been found for each pair.
the output alignment from [10] (automatically generated) – alignments between 3 pairs publicly available. It is composed of two types of complex equivalence correspondences: those with attribute occurrence restriction and those with attribute domain restriction. These are the alignments available in the context of the OAEI 2018 campaign.14
The ra1 alignment had been used as input by the systems of Ritze_2010 and Faria_2018. Ra1 has been added to these two alignments for the CQA coverage evaluation. The precision evaluation was made only on the complex correspondences (the output of the original approaches).
The CQA coverage evaluation was run over all datasets in order to measure the standard deviation of the query precision, recall and f-measure between the datasets, as shown in Table 9. The standard deviation is maximal for Faria_2018 and Ritze_2010, but is still rather low (
Standard deviation and average of the query precision, query f-measure and query recall scores over the 6 datasets
Standard deviation and average of the query precision, query f-measure and query recall scores over the 6 datasets
Average of CQA f-measure for each pair of ontologies for each alignment on the 100% dataset
Globally, as shown in Table 10, the Query_rewriting alignments have a better coverage than the others. An exception for the edas-confOf pair could be noted. The Ontology_merging alignment outperforms the Query_rewriting one. This is explained by the choice made in the methodology for the creation of both alignments combined with the rewriting systems. In the Ontology_merging alignments, unions of properties were separated into individual subsumptions which were usable by the rewriting system, whereas in the Query_rewriting one, the subsumptions were unions. For example: 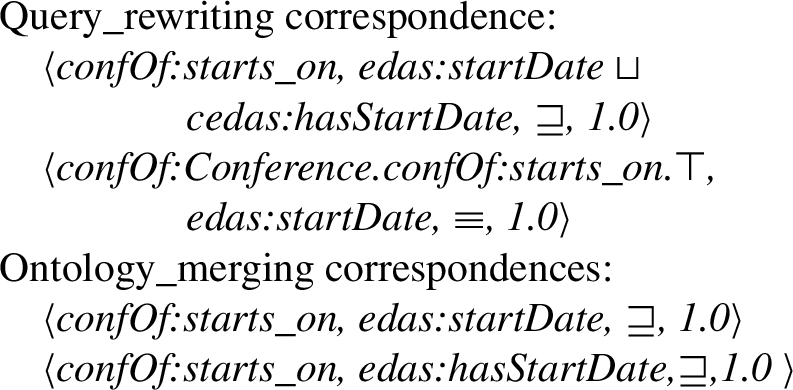 Therefore, when a query contained the edas:hasStartDate relation, the Ontology_merging correspondence could be used, but the Query_rewriting ones could not. The precision-oriented methodology prevented the addition of the two Ontology_merging correspondences to the Query_rewriting alignment.
When closely looking at the results, many CQAs retrieving literals (titles, names, etc.) were not rewritten by the alignments. This is mainly explained because the rdfs:label property was introduced in the population phase when no labelling property was included in the original ontologies. The CQAs which needed (c:c) correspondences to be rewritten were not covered by the evaluated alignments. Indeed, these alignments are restricted to (s:s), (s:c) and (c:s) correspondences.
Different precision metrics over the alignments. The name of the precision metric is the relation between a correspondence member which is considered correct. For example, in the equivalent precision, the correspondences whose members were found equivalent is considered correct, the other correspondences not correct
Table 11 shows the precision of the alignments considering different sets of correspondences as correct. The equivalent precision is calculated by considering that only the correspondences whose members are equivalent are correct. The subsumed precision considers correct the correspondences whose members subsume one another (this includes the equivalent ones). The overlapping precision considers correct the correspondences with equivalent, subsumed or overlapping members. The not disjoint precision considers all correspondences whose members are not disjoint correct. The difference with the overlapping one is that an empty correspondence is correct in this case.
The real precision of the alignments is considered to be between the equivalent and the not disjoint values. The Query_ rewriting, Ontology_merging alignments do not have a very good equivalent precision score (0.42 and 0.43). Indeed, their correspondences include a lot of subsumptions. For the subsumed, overlapping and not disjoint scores, their scores are much higher (0.94 and 0.91). ra1 has a better equivalence score (0.56) than the other two manually created alignments because it originally contains only correspondence with an equivalence relation. However, given this score seems low for a reference alignment. This low score is partly due to the different CQA coverage of the ontologies in the population phase.
For example, for the pair cmt-edas, the ra1 correspondence
The low equivalence score of ra1 is also due to the different interpretation of the ontologies. For example, in the pair cmt-confOf, the ra1 correspondence
Ritze_2010 has only equivalent or disjoint correspondences, therefore its precision scores are the same for all metrics. Faria_2018 achieves a good precision score overall (between 0.65 and 0.71).
Given the different population issues, the overlapping and not disjoint scores give a good representation of the alignment precision.
CQA coverage and equivalence, overlapping and not disjoint precision of the alignments, harmonic mean (HM) of the two scores
CQA coverage and equivalence, overlapping and not disjoint precision of the alignments, harmonic mean (HM) of the two scores
Table 12 shows the results of the evaluation over the alignments. The CQA coverage and precision scores have been aggregated in an harmonic mean (called HM in Table 12). Overall, the Query_rewriting and Ontology_merging alignments have the better results. This is satisfactory given that these two alignments are complex reference alignments on this dataset. Even if ra1 has the best precision, its low CQA coverage (0.42) shows that a lot of CQAs from the benchmark need complex alignments to be covered. Faria_2018 and Ritze_2010 are compared to the other even if they do not contain the same number of pairs. Therefore, these numbers cannot be exactly compared to the others.
In the results of the OAEI 2018 [1], the precision measured for the Faria_2018 alignment was 0.54 (cf. Table 13). The instance-based precision gives the same result as the manual evaluation for the cmt-ekaw pair. For the other pairs, the gap is quite important. For the cmt-conference pair, this is probably due to a difference of interpretation of the ontologies. The conference:Written_contribution being considered as a superclass of cmt:Paper in the OAEI 2018 evaluation, but equivalent classes in the ontology population.
In the conference-ekaw pair, the
Comparison of the OAEI 2019 and instance-based precision metrics over the Faria_2018 alignment. The not disjoint, subsumed and overlap precision scores are the same for this alignment
Comparison of the OAEI 2019 and instance-based precision metrics over the Faria_2018 alignment. The not disjoint, subsumed and overlap precision scores are the same for this alignment
This paper has presented an evaluation benchmark on which complex correspondences can be evaluated. In general, alignment evaluation is often performed by comparing a generated alignment to a reference one. It involves comparing the members of the correspondences generated by the systems to the members of the correspondences in the reference alignment. While this comparison is straightforward for simple alignments, this step becomes harder when dealing with complex correspondences. For example, these three correspondences can be considered as true positive: (o:AcceptedPaper,∃
While syntactic-oriented evaluation metrics (measuring the effort to transform a correspondence into another) would fail in covering the high space of possible combinations between constructors, semantic-oriented approaches would restrict the expressiveness of correspondences to those supported by current reasoners, leaving aside for instance, transformation functions. Hence, comparison of instance sets seems to be reasonable. Our proposal shifts the problem to the comparison of instances in a task of query rewriting targeting user needs. We proposed two evaluation measures. While the CQA coverage measure relies on pairs of equivalent SPARQL queries (source and target queries) and measures how well an evaluated alignment covers these queries, the intrinsic precision compares the instances of the correspondences members.
CQA coverage, in particular, requires a way for rewriting the source query into the target query, in terms of the evaluated alignment. Such an evaluation however requires that the ontologies of the evaluation dataset are consistently populated and a system for rewriting the queries. With respect to the former, this problem has been addressed here by proposing an artificially and regularly populated dataset, as datasets with cross-ontology consistency may not be easy to find. The population process was guided by CQAs. We argue that the synthetic population ensures that each CQA is consistently populated across the ontologies. However, one can argue that in case the CQAs have different coverage for correspondences achieved through different patterns, this may have an impact on evaluation. As our evaluation is instance-based, two correspondences that do not exactly follow the same pattern but that represent the same piece of knowledge, will be considered to be comparable.
With respect to the query rewriting systems, most existing SPARQL rewriting systems are limited to (s:c) correspondences and dealing with (c:c) correspondences is still a challenge. A rewriting system which deals with such correspondences has been proposed here. However, it can not combine several (c:c) correspondence together. Instance-based rewriting could, however, be a new lead for this challenge. While the two systems have been manually evaluated in the task of rewriting queries, in the way discussed in [38], we did not evaluate the impact of each of the systems in the evaluation task. While this has to be done, we reduced their potential impact by choosing the best rewriting query, by selecting the one with the best f-measure. Another point is that these systems do not take into account correspondence relation and confidence within the rewrite process, what has to be addressed in the future.
The proposed approach has been applied for evaluating existing alignments. This system has also been applied for automating the evaluation of complex alignments in the OAEI 2019 campaign. The evaluation reported here shows that the reference alignments all have a good precision score and that complex alignments provide a better coverage of the CQAs than simple alignments. The evaluation of the alignments from two complex matchers shows that, even though both achieve a rather good precision, their CQA coverage is below 0.5. However, these results are far from the ones obtained with the original dataset and reported in OAEI campaigns, leaving a large room for improvements in the field. As our approach requires the alignments to be a priori known, it is suitable for scenarios such as the ones in OAEI. In that sense, as for the largely used artificial datasets, as the OAEI Benchmark, our dataset covers a lack of complex datasets under which an automatic evaluation can be carried in a controlled manner.
Evaluating complex ontology alignments, however, is a too broad challenge to be tackled with a single approach, as there are multiple aspects to take into account. A complementary approach to the instance-based one proposed in this paper could be an edit-distance approach that would reflect the effort involved in human validation. The approach should be also scalable, and avoid the need to do all correspondence comparisons. This could also be achieved by considering the possibility of computing minimal complex correspondences (or key complex correspondences, which can be used for computing all the other ones), in line with the work of [20]. In order to cover ontologies of various sizes and domains, developing a query generation system able to automatically generate queries adequate in coverage and scope to the evaluation of complex alignments could also help in the evaluation task.