
Abstract
This paper presents an RDF dataset of meteorological measurements. The measurements come from one weather station at the Irstea experimental farm located in Montoldre. The measurements have been made from August 2018 until now. They have been transformed and published as Linked Open Data (LOD). The data schema is based on the new version of the Semantic Sensor Network ontology. This ontology version integrates the Sensor, Observation, Sample, and Actuator pattern. We first present the network of ontologies used to organize the data. Then, the transformation process for publishing the dataset is detailed. To conclude we present some use cases of queries related to Irstea research projects.
Keywords
Introduction
The AgroTechnoPôle of Irstea contains an experimental farm where researchers and engineers can test their prototypes, such as robots or automatic systems. A weather station is located on the experimental farm. Weather data are useful for farmer activities but also for research experiments. We want to facilitate access to these weather measurements. Thus, we decided to test the publication of our meteorological dataset on the LOD.
In our previous work [17], we published meteorological observations using the Semantic Sensor Network (SSN) ontology [6]. This first work was based on previous publications of meteorological measurements using the SSN ontology: [3] presented a Linked Data weather archive of data from AEMET, the Spanish Meteorological Office. SSN was used as a central node to connect a network of ontologies. SSN is still used to publish AEMET weather archives [18]. Note that [13] presented a Linked Data weather archive of date from the Australian Bureau of Meteorology. This work is different from the previous one because it joins the SSN ontology with the RDF Data Cube vocabulary: the meteorological measurements were aggregated and saved in a data cube [19].
Example of a CSV file
Example of a CSV file
The SSN ontology has been updated and has become a W3C recommendation in 2017 [2]. Now, SSN integrates the Sensor, Observation, Sample, and Actuator (SOSA) pattern. This paper describes a new meteorological dataset based on the SOSA/SSN ontology. To the best of our knowledge, this work is the first to publish meteorological data with the new version of the SOSA/SSN ontology. We published measurements from the Vantage Pro 2 weather station that is in use at our experimental farm. We have followed the usual steps in the Linked Data publication, as discussed in [10]. We have reused as much as possible existing ontologies or thesauri related to meteorological observations and phenomena.
This paper is organized as follows: Section 2 describes our weather station and its measurements. Section 3 briefly presents the network of ontologies. Some examples of the organization of the data using these ontologies are described in Section 4. Section 5 describes the populating processes and the links to other datasets. Section 6 presents some use cases of queries with this dataset. Finally we conclude by presenting an analysis of our work and perspectives.
Irstea has a research and experimentation site located in Montoldre. This experimental farm is part of the innovation lab of AgroTechnoPôle. One of the goals of the site is to run research experiments. One of these experiments is the “RObotics and Sensors serving the Ecophyto plan” (ROSE) challenge [5]. The goal of the ROSE challenge is to evaluate autonomous robots for use as weeding solutions for crops. This farm has its own weather station, a Vantage Pro 21
from Davis Instruments. According to the documentation of the Vantage Pro 2, the station contains the following sensors: a barometer, two temperature sensors (inside and outside), two humidity sensors (inside and outside), an anemometer, a wind direction sensor, a rain collector to measure the amount of precipitation and the precipitation rate, a solar radiation sensor and a clock. These external sensors use wireless communication to send their measurements to a console located inside a building. The console is connected to a computer to store the measurement values. The storage of the measurements is automatically performed according to the user parameters (intervals of time, units, etc.). These data are extracted once per day to generate a Comma-Separated Values (CSV) file as shown in Table 1. This daily file is used to update a table in a PostgreSQL database. The structure of the table is similar to that of the CSV file.This table stores the meteorological measurements from August 2018 until now. The table contains the following measures: outside temperature (in degrees Celsius), atmospheric pressure (in hectopascals), outside relative humidity (in percentages), wind direction (east, north, south, west,…), wind speed (in kilometers per hour), precipitation quantity (in millimeters), precipitation rate (in millimeters per hour) and solar radiation (in watts per square meter). The frequency of the measurements was fixed to 10 minutes.
The SOSA/SSN ontology [2] can be used as a core ontology for the publication of meteorological data. This ontology should be linked with other ontologies to create a network. Our network of ontologies is composed of the following:
Ontology to describe the different types of sensors.
Ontology to describe the units of measurement.
Ontologies to describe the geographical places and their locations.
Ontology to describe the temporal entities.
In this section, we briefly describe the ontologies used for the publication of our meteorological data. We indicate the elements that we have reused from the ontology.
Reused vocabularies and ontologies
Reused vocabularies and ontologies
The Semantic Sensor Network (SSN) ontology is a generic ontology related to sensor observations [6]. The first version of this ontology was created by the W3C Semantic Sensor Network Incubator Group. Since then, this ontology has been updated to become a W3C recommendation. The new ontology is lightweight and is dedicated to sensor and actuator description. It was named the Sensor, Observation, Sample, and Actuator (SOSA) pattern. The link between SSN and SOSA is described as follows in [2]: “SOSA provides a lightweight core for SSN and aims at broadening the target audience and application areas that can make use of Semantic Web ontologies. At the same time, SOSA acts as minimal interoperability fall-back level, i.e., it defines those common classes and properties for which data can be safely exchanged across all uses of SSN, its modules, and SOSA.”
The classes we have reused from the SOSA/SSN ontology are as follows:
We have also used the main properties associated with these classes:
URI generation templates for resources
URI generation templates for resources
The Ontology for Meteorological Sensors [12] (AWS) extends the old version of the SSN ontology by specializing its class
We noticed that AWS proposes many meteorological sensor types. In our case, AWS provides all the sensor descriptions needed for our purpose.
Quantity, unit, dimension and type
The Quantity, Unit, Dimension and Type (QUDT) is a collection of OWL ontologies and vocabularies. We used version 1.1.2
the version 2.0 of this collection is available on the website http://qudt.org.
Currently, several ontologies exist for the publication of spatial data. We decided to use the GeoSPARQL vocabulary [14]. GeoSPARQL is the result of a standardization process at the Open Geospatial Consortium (OGC). It first focuses on querying the geographical data. It also proposes a model to describe the geometries of spatial objects: through the object property
The ISA Core Location vocabulary [7] (LOCN) was released in November 2013, and has recently been given a W3C-owned namespace, although it was initially generated outside the consortium. This RDFS vocabulary focuses on the description of places and their address. It provides a set of three classes and several properties. This ontology was used to describe the address of the experimental farm.
The W3C time ontology
The W3C Time ontology [8] enables the description of instants and intervals in time. Hence it may be useful when we need to describe the timestamps or the time period associated with the measurements made by the weather station. We reused the classes
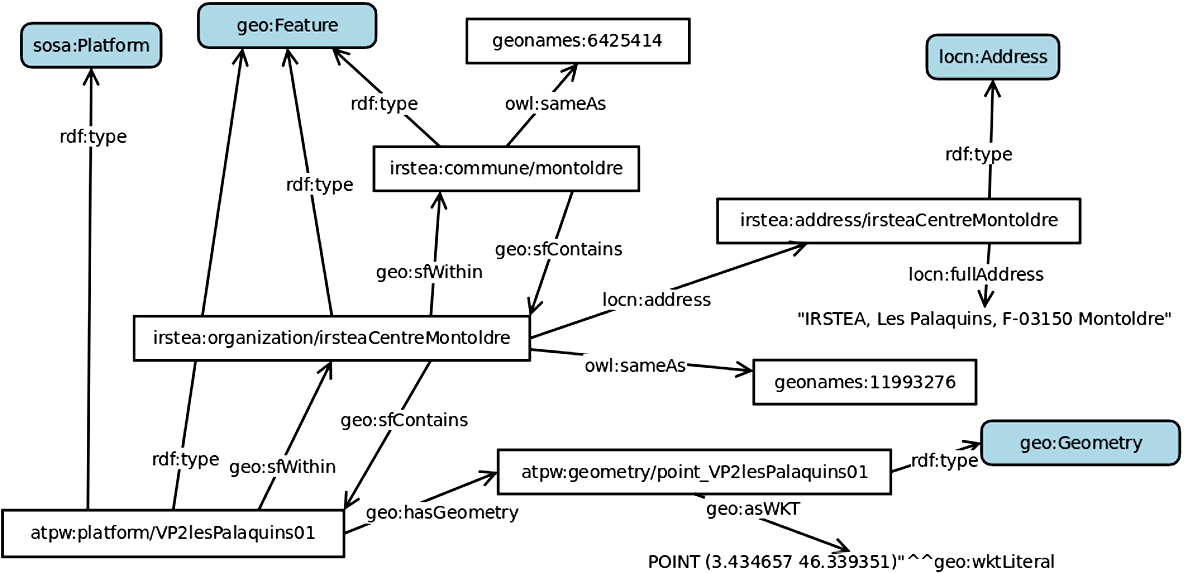
Location of the weather station.

Barometer description.
Based on the network of ontologies described in the previous section, we were now able to create a dataset containing all the individuals describing measurements of our weather station. Now we explain the decisions made to create the resource URIs (Section 4.1), and we provide examples of the resource descriptions (Section 4.2).
Resource URIs for our weather station data
The URIs were designed with several principles in mind, such as simplicity, stability and manageability. We followed the common guidelines and recommendations [3]. This section presents the main URI design decisions and the conventions used. Table 3 provides a summary of the main types of URIs that we generated. The first column presents the type of resources. The second column indicates the associated class that types the resources. The last column contains the name pattern used to generate the resource URIs.
The base URI for our new meteorological dataset is located at http://ontology.irstea.fr/weather/resource/. Its prefix is atpw. We have another base URI for generic information shared between several datasets called http://ontology.irstea.fr/society/resource/. Its prefix is irstea.
Our generic name pattern to produce URIs for each object is {Base URI} +’/’+ {nameOfClass} +’/’+ {objectIdentifier}. The object identifiers and class names are written in the camel case. The ‘
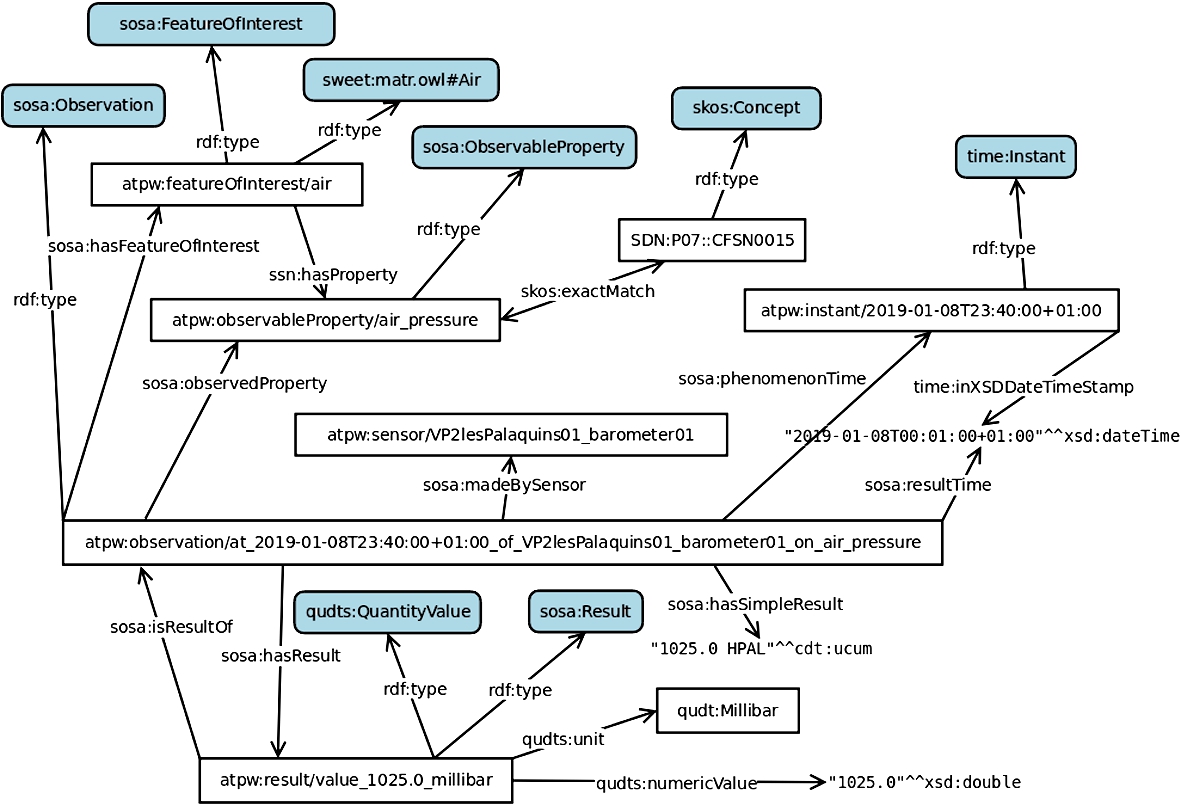
Example of observation made by the barometer.
The following subsections provide some examples to illustrate the use of our network of ontologies.
Weather station description
In this section we provide a general overview of the weather station description. The individual that represents the weather station is an instance of the
Sensor description
Each sensor of the weather station is represented by an instance of the class
Observation description
An observation describes the context of a measurement made by a sensor. Figure 3 represents an observation made by the barometer of the air pressure at a given point in time. The properties
Phenomenon time description
A measurement can be instantaneous. For example, the barometer measures the air pressure in an instantaneous manner. Figure 3 presents an observation produced by the barometer. The
Sometimes a measurement is related to a period of time. For example, the rain collector measures the quantity of precipitation that falls during a time period. Figure 4 presents an observation made by the rain collector sensor. The property

Example of interval.
This section briefly describes the processes involved in the RDF dataset generation. As explained in Section 1, the measurements produced by the weather station sensors are stored in the PostgreSQL table. The measurements are performed every 10 minutes. The transformation process is performed by a program written in Python. The goal of the program is to update an RDF triplestore available on a Jena Fuseki server. This program uses three main libraries:
requests to communicate with the triplestore using the HTTP protocol,
psycopg2 to query the PostgreSQL database,
datetime to process the datetime objects in order to compute the time duration or time instant and write them in the ISO 8601 format, and
arrow to extract the current timezone.
The data transformation algorithm is composed of the following steps:
query the triplestore to obtain the time of its newest measurement, and
based on this time, query the PostgreSQL table to retrieve the new measurements ordered by time;
for each measurement of the query results, compute its duration,
extract the measurement values,
convert the wind direction into degrees, and
write an “INSERT DATA” SPARQL query and send it to the triplestore through an HTTP POST frame.
During this process, the new
Our dataset characteristics are listed in Table 5. The statistics presented in Table 6 were computed in July 2019. Note that the number of observations was 46.648 for precipitation rate, precipitation amount, air pressure and wind speed. There were only 25.274 wind direction measurements. When the wind sensor does not detect wind events, this type of measurement does not occur. The number of observations for the relative humidity, flux density and air temperature were close to 45.170. Indeed the data transfer from the weather station to the PostgreSQL table sometimes fails.
Measured properties and related time entities
Measured properties and related time entities
Technical details
Key statistics
Meteorological phenomena
As shown in Table 6, we manually aligned our dataset to several resources as follows:
the SWEET network of ontologies: the Semantic Web for Earth and Environmental Terminology [16],
the CF thesaurus: the Climate and Forecast Standard Names [11],
Geonames: the GeoNames geographical database,3
INSEE: the SPARQL endpoint of the National Institute of Statistics and Economic Studies,4
andthe DBpedia: a dataset extracted from the Wikipedia InfoBox [4].
All the instances of
SWEET files are available on a github located in https://github.com/ESIPFed/sweet/tree/master/src.
All the instances of
Measured properties of meteorological phenomena
The individuals that represent generic information (prefix
Irstea is involved in farm robotic projects [5]. The robotic teams need to access precise weather conditions to determine the best times to carry out their field experiments. The weather data are useful for the analysis of their field experiments. The researchers need to understand the behavior of the electronic components. These components are sensitive to air humidity and temperature. Moreover, the robots need to adapt their speed depending on the soil humidity. Thus, robotic teams need to know how much rain has fallen in the days before their field experiments. To summarize, some robot parameters need to be adapted to the weather conditions. To query the meteorological dataset, we propose two SPARQL interfaces: the one proposed by SNORQL and the one presented in Fig. 5. This new interface proposes some sample queries in a listbox. Moreover, the numeric results are visualized as a graph.
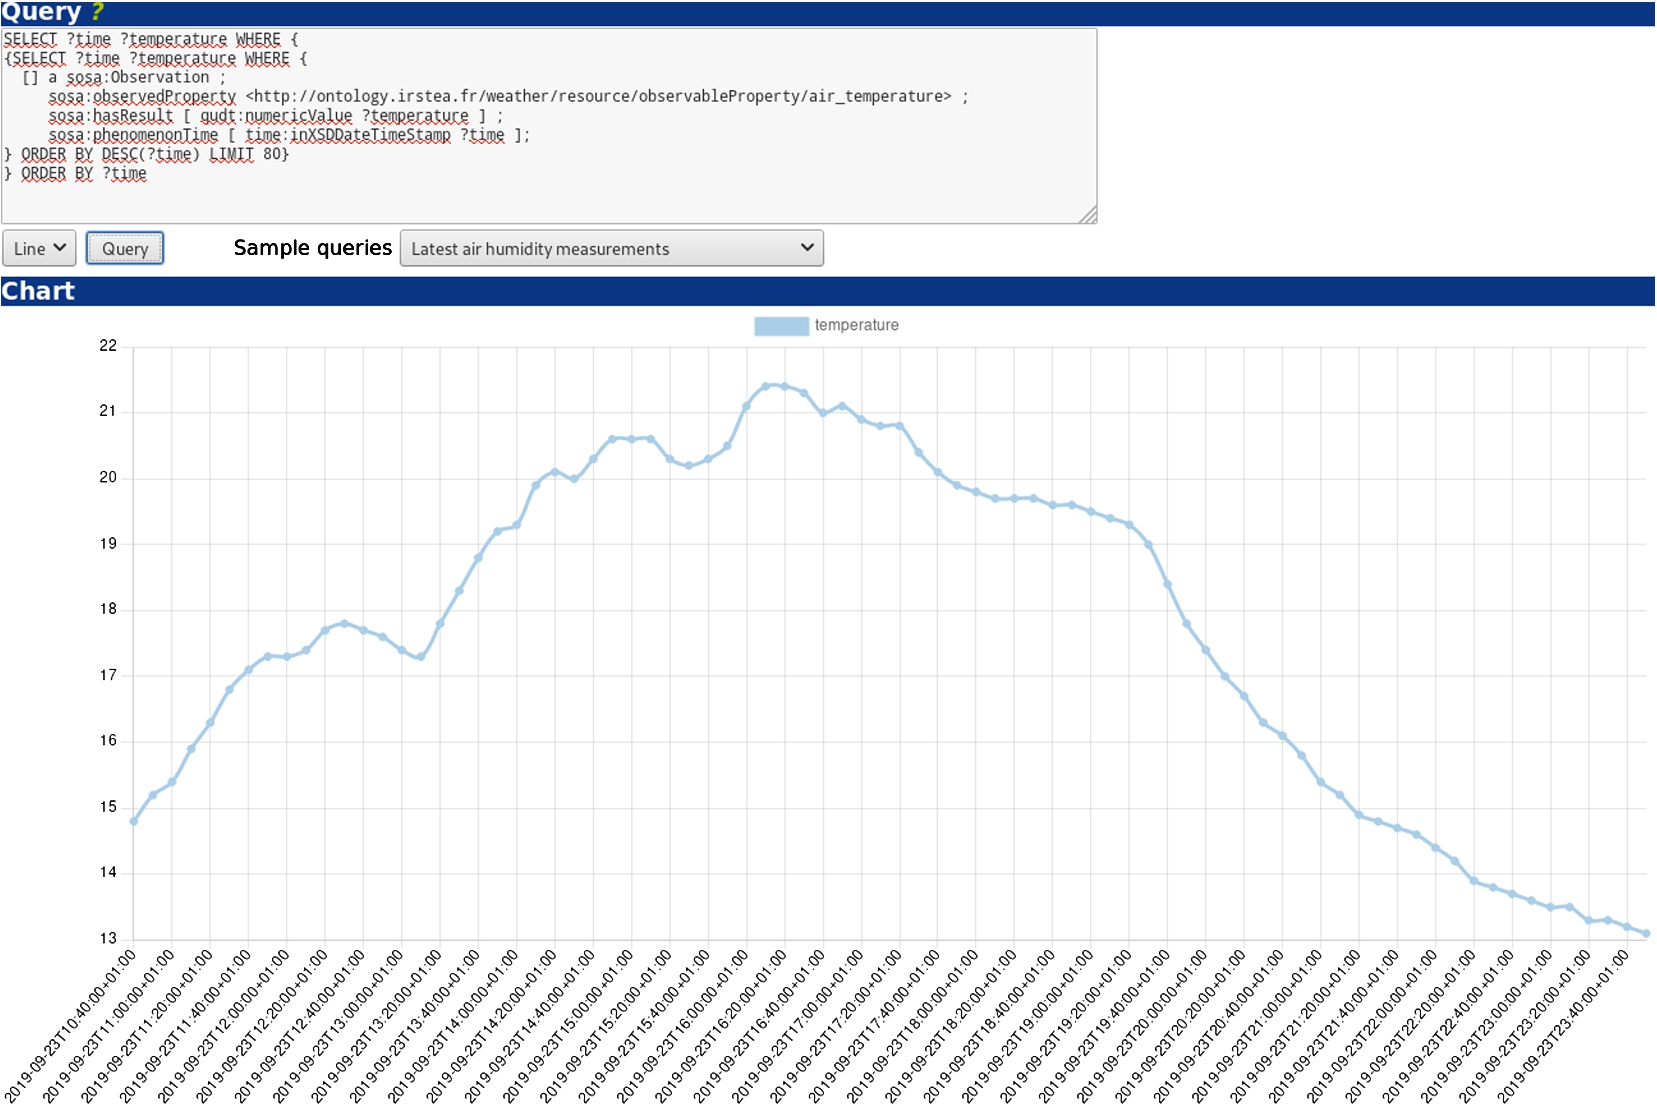
Vizualisation of the latest air temperature measurements.
As far as we know, the meteorological dataset has only been queried by engineers to determine the parameter updates of their equipment. We expect in the future that this dataset will be queried by an automatic system. For example, an automatic irrigation system for maize crops is being developed [15]. The quantity of precipitation per day data is needed by the irrigation decision system to cancel or delay an irrigation. The quantity of water needed by the crop depends on its growth stage. Crop growth stages are evaluated automatically based on a formula that uses the minimal and maximal temperature per day measurements as input. The irrigation decision system will be connected to the SPARQL endpoint to automatically determine the crop growth stage and to adapt its decision accordingly.
This meteorological dataset can also be queried by the agronomists involved in crop modeling. Climatic events are correlated with the crop growth stage and crop yield. The agronomists are interested in studying the crop life cycle during climatic change. They need to know the minimal and maximal temperatures, the total amount of solar radiation and the total amount of precipitation per day. When our meteorological dataset is large enough, we will build some meteorological archives joined with the crop life cycle dataset.
The AgroTechnoPôle of Irstea contains an experimental farm where researchers and engineers can test their prototypes, such as robots or automatic systems. A weather station is located on the experimental farm. The weather data are useful for farming activities but also for research experiments. We want to facilitate access to weather measurements. Thus, we decided to test the publication of our meteorological dataset on the LOD.
This paper presents a meteorological dataset based on the new version of the SSN ontology, that is to say, the SOSA/SSN ontology. To do so, we selected a network of ontologies to describe our dataset. We built a dataset based on the measurements of the weather station from August 2018. It is updated daily. This dataset is accessible at a dedicated SPARQL endpoint.
The next step will be, to update the dataset with the meteorological observations of the two other weather stations in Irstea. AgroTechnoPôle has a mobile weather station located in one of the plots of the Montoldre farm and a weather station located near the university campus of Clermont–Ferrand.