
Abstract
In 2012 the Australian Bureau of Meteorology published a dataset, ACORN-SAT, containing the homogenised daily temperature observations of 112 locations throughout Australia for the last 100 years. The dataset employs the latest analysis techniques and takes advantage of newly digitised observational data to monitor climate variability and change in Australia. The observations in ACORN-SAT were initially published only as comma separated values, whereas the metadata was published in a PDF report. In 2013 we converted the metadata and the observation data into RDF and published the result as Linked Open Data, accessible online via a pilot government linked data service built on the Linked Data API. In this article we describe the process of transforming the original tabular data into a Linked Sensor Data Cube [in: Proc. of the 5th International Workshop on Semantic Sensor Networks, SSN12, CEUR-WS.org, 2012, pp. 1–16] based on the W3C Semantic Sensor Network ontology [Web Semantics: Science, Services and Agents on the World Wide Web
Keywords
Introduction
The Australian Climate Observations Reference Network – Surface Air Temperature (ACORN-SAT) dataset [4,20], a flagship data product of the Australian Bureau of Meteorology (BoM), has been developed for monitoring climate variability and change in Australia. The dataset provides a daily temperature record over the last 100 years. Its primary objective is to underpin better understanding of long-term climate change. To produce this dataset, climate data experts [19,20] have used all the available information about weather station relocations, changes in technology and changes in observational procedures to characterise breakpoints in time series and to compute adjustments for each station. This dataset has been released by the BoM for reuse as open data to fulfill the Australian government commitment to Open Government.
In a previous publication [13] we have described in detail the ontology engineering process, including the novel integration of the RDF Data Cube vocabulary with the Sensor Network Ontology. In this article we present our findings on the Linked Data publishing lifecycle of the ACORN-SAT dataset which involved four major steps: (1) identifying and defining ontologies to represent the concepts and relations in ACORN-SAT, (2) creating the RDF data triples from the tab-delimited data and defining a URI scheme, (3) publishing the RDF triples in a linked data fashion using ELDA1
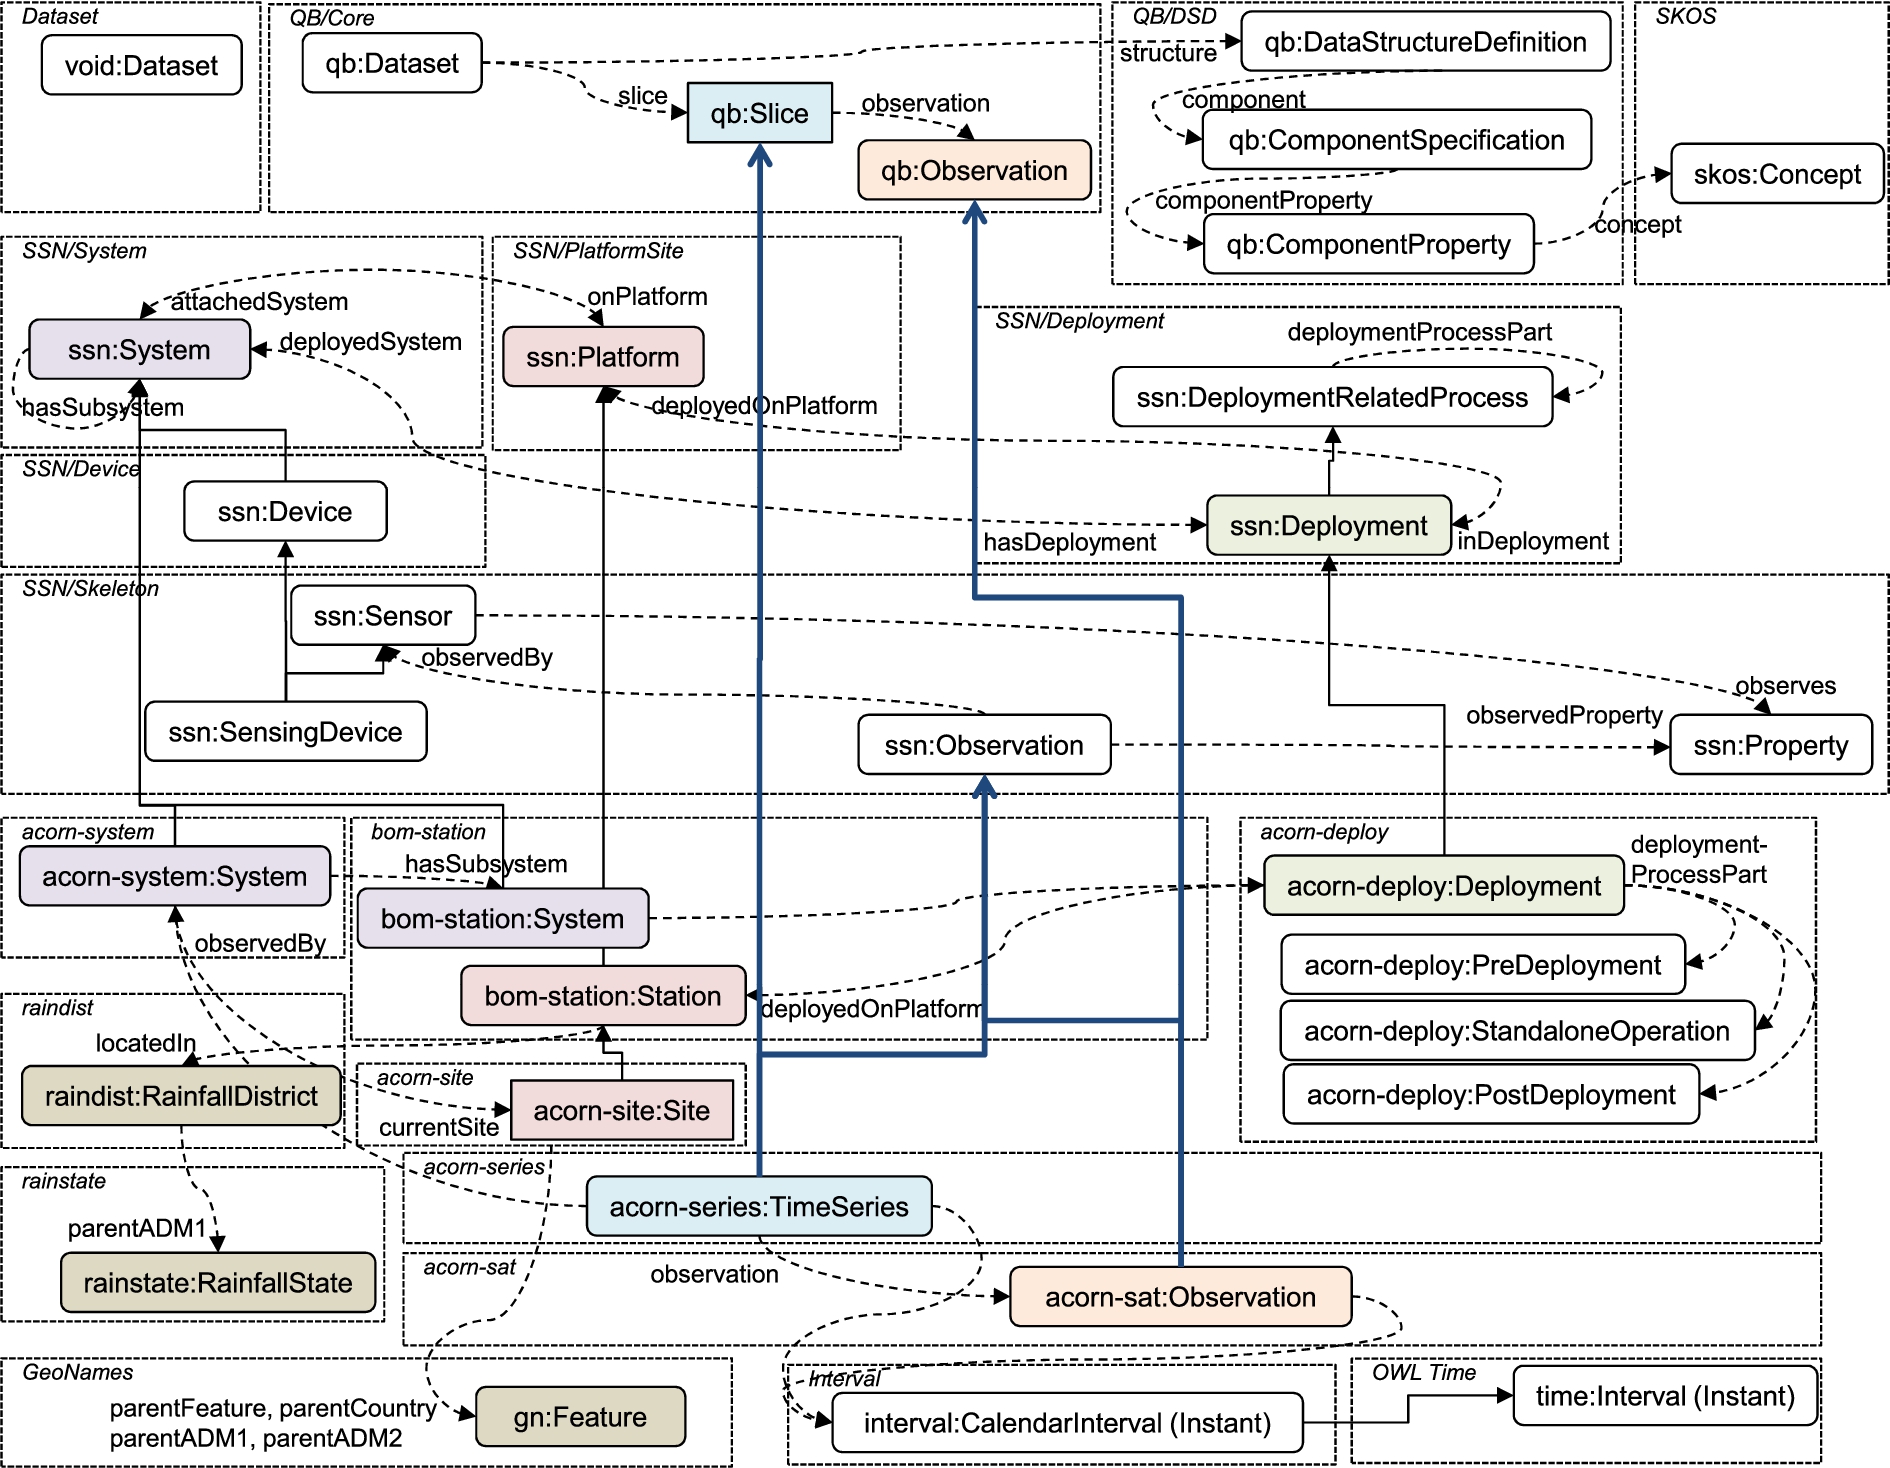
ACORN-SAT Linked Climate dataset key concepts and relationships, split by conceptual modules: plain lines are used for sub-class-of relationships and dashed lines for object properties linking classes.
The remainder of this article is structured as follows. Section 2 introduces the modular structure of the Linked Sensor Data Cube. Section 3 outlines the ACORN-SAT Linked Sensor Data Cube publishing process. Section 4 reviews use cases of ACORN-SAT since its publication with a particular focus on its integration with near-real time weather observations. The conclusion in Section 5 highlights some opportunities for further extensions and enrichments of climate data resources such as ACORN-SAT.
Reused vocabularies
Reused vocabularies
New ontologies. The URI
The ACORN-SAT linked dataset is derived from three resources. The ACORN-SAT dataset originally released by the Bureau of Meteorology is available as a set of tab-delimited data files (source 1) which contain the homogenised minimum and maximum temperature and the raw rainfall data recorded daily at each selected site extending from 1910 to the present. The BoM has published the associated site metadata via a station catalogue document [3] (source 2) with a map and a photo for each site, as well as the name, number, geographical coordinates, locality and some text about the site and its history. The BoM also maintains a Weather Station Directory2
The ACORN-SAT data cube is primarily a multi-dimensional array of observation values, with one spatial dimension: the ACORN-SAT site for the location, and three temporal dimensions: year, month, and day for the time of the observation. It follows the general design principles defined by the Statistical Data and Metadata Exchange (SDMX) initiative [15] and is based on the RDF Data Cube vocabulary [6], a vocabulary for the publication of statistical data in RDF published by the W3C Government Linked Data working group. Each observation contains daily measures referring to a 24 hour interval: the minimum and maximum temperature, the rainfall amount, and boolean attributes to signal missing values. The data cube is split into slices using the site id first, and then the year and month of the observation. All the slices are compound observations and are enriched with extra aggregate statistical attributes. For the temperature measures, we provide the minimum, maximum, mean, and standard deviation indicators over the relevant time period. For the rainfall measure, we have added the maximum, and the sum. The count of missing measurements is also provided. Figure 1 shows how the RDF Data Cube vocabulary (QB) and the Semantic Sensor Network ontology (SSN) are reused and integrated together, with:
The boxes in Fig. 1 delineate single ontologies except for SSN [5] and QB. The prefixes used are described in Tables 1 and 2.

ACORN-SAT system, sub-systems, deployment phases and sub-phases for Darwin (see [13] for a complete description).
The ACORN-SAT data is derived from measurements made at one or several stations for each ACORN-SAT location (112 in total). These composite stations have been selected on the basis of the availability and the quality of the data [19,20]. The published documentation [4] explains the numbering system used by the Bureau of Meteorology and the methods used to manage the changes of stations (mostly from town centres to airports) at each site ([19], Sections 2.4 and 3.4). Briefly, during each transition period, one of the sites, generally the old one, is kept as a comparison site for a minimum period of five years of parallel observations. These modifications of the network structure are related to factors such as the urbanisation of the original site, in particular, the construction of new buildings affecting the observations, and the transfer of bureau-staffed sites from city centres to airports.
URI patterns. The URI {BASE} is lab.environment.data.gov.au
URI patterns. The URI
One key challenge for publishers of climate data is to answer the public demand to have a more transparent and reproducible homogenisation process. By coupling the SSN ontology and the RDF Data Cube vocabulary we are able to capture the station history and to attach it to the data at the right level of temporal and spatial granularity. We have used the semi-structured information available in the ACORN-SAT reports [3,4,20] and made the metadata about station changes shown in Fig. 1 directly accessible via a range of API endpoints. Approximately half of the adjustments done on the ACORN-SAT minimum and maximum temperature values [19] are supported by metadata records of which 80% were linked to station moves.
Figure 2 [13] illustrates how the SSN ontology is used to describe how the time series data for each sensing site has been acquired. In this case, the Darwin ACORN-SAT time series data is sourced from three successive deployment phases: first, from 1910 to 1942 at the Darwin Post Office (PO), and then for 1941–2007 and 2001-now at two separate sites on the Darwin Airport (AP). This example shows how we use the
Linked Data creation and URI scheme definition
We mapped the tabular time series data of the original ACORN-SAT to RDF using D2RQ [2] and custom-built XSLT and Python scripts. These scripts produce RDF data based on the ACORN-SAT ontologies listed in Table 2. We have largely followed the URI guidance issued for the publication of public sector data in the UK [7]: in particular, we use data.gov.au as the base domain for URI sets that are promoted for re-use within the Australian Government and domain prefixes such as “environment” to split the governance of these URI sets into sectors matching the competencies of agencies owning shareable data. The URI scheme also supports Concept Identifiers with a URI starting with
The URI scheme supports access to the published data with third party tools based on the Linked Data API. Table 3 describes the URI patterns for API calls for individual data items (Identifier URIs) based on URLs finishing with identifiers (i.e. {id},{year}, {date}) and URI patterns for API calls for lists of items (List URIs) based on URLs finishing with a keyword like station, year or month. We argue that API calls using these nested keyword/identifier patterns are more descriptive and easier to learn and memorise than a pattern using a trailing slash as an indicator for collections. ACORN-SAT observations cover the time period from 1910 to 2011. If the BoM releases observations for subsequent years using the same homogenisation method, the data for the new year can be added following the URI pattern described above. There are no other versioning requirements, that is, if ACORN-SAT were to be updated with new methods, an entirely new dataset would be published.
Publishing the ACORN-SAT dataset
The ACORN-SAT Linked Sensor Data service [13] uses the ELDA open source implementation of the Linked Data API. Due to the size of ACORN-SAT (∼61 million triples) we have put particular focus on the performance of the exposed APIs and defined custom viewers for the various API endpoints in order to avoid expensive SPARQL CONSTRUCT queries. Our production environment uses a Virtuoso triple store and runs on an OpenStack Cloud computing infrastructure on servers of the National Computational Infrastructure.3
Recognizing that the ACORN-SAT dataset with its few dimensions is not particularly suitable for a faceted browsing interface like ELDA we have developed some additional mashups. For example, we provide a web map where we embedded the 112 sensor locations of the ACORN-SAT dataset in a Google map widget4
The ACORN-SAT dataset has also been uploaded to the CKAN archive and in the CKAN repository of data.gov.au at:
Technical details
Key Statistics
Like LinkedSensorData [14] and AEMET [1], we have linked the BoM stations to their associated GeoNames features with the help of the GeoNames API.
External datasets can link to ACORN-SAT, either temporally or spatially. We provide temporal slices for each year and month of observations for a given station and consequently we have 1300 temporal slices (100 years plus 12 × 100 months) for each location that could be linked from other temporal datasets. Table 3 shows the URI pattern of these slices and of their associated observations. We have not published any spatial slice, because in ACORN-SAT the ratio of the number of sites to the number of rainfall districts (its spatial boundary) is close to one. Hence we only have one level in the spatial dimension. However, we have also linked all the base observations made on the same day to the corresponding UK interval6
The inclusion of
The ACORN-SAT dataset is primarily a dense [15] data cube. Its structure can be reused for other data cubes supplying long term time series like census or biodiversity data, which then will become easy to integrate together via links established at the slice level. There are also opportunities to link the ACORN-SAT dataset to sparse climate data like cyclone tracks. With the approach presented here, this could be done without extra duplication of the published observation data, by adding new slices to the data cube structure.
There are a number of use cases [9,10] and linking opportunities [11] which depend on the availability of complementary ontologies and vocabularies for the publication of geospatial and statistical linked data, for example, coverages that are simple timeseries datasets – where a time-varying property is measured at a fixed location.
Arguably the most useful interlinking of long term climate data is with current weather observations, to provide the user of current observation data with meaningful context.
The Linked Sensor Data Cube design developed here was applied [17] to support event detection on live data feeds from a soil moisture wireless sensor network deployed on a farm near Armidale in New South Wales, Australia. In that case, no explicit linking vocabulary is used, but the ontology for the private on-farm weather stations includes the relevant BoM rainfall districts. The rainfall district may be used in federated SPARQL queries to join the local data with ACORN-SAT.
More recently, we have enabled the comparison of current observations published by the Bureau of Meteorology with ACORN-SAT observations made in the past 100 years. This is done using a harvesting and mapping approach, whereby up to date weather observations are regularly imported from the Bureau’s “Latest Weather Observations” service (e.g. http:// www.bom.gov.au/fwo/IDN60903/IDN60903.94925. json) and published using the same Linked Data API as ACORN-SAT [16] at
Weather observation data are retrieved every 30 minutes, to align with the Bureau’s schedule of updates for most sites. The original JSON observations are translated into RDF instances of a Weather Observations ontology. Previous observations for the same station, time instant and observed property combination are overwritten with the newly retrieved data, keeping the linked dataset up to date with corrections and updates made by the Bureau.
The weather observations’ ontology for the harvested weather observations is also based on the SSN ontology [5]. It extends SSN to include concepts for describing specific types of weather observations, such as observations of ambient temperature, wind direction and precipitation.
Weather stations are assigned a URI based on their World Meteorological Organization (WMO) identifier (e.g.
Where ACORN-SAT data are available for a station, the weather observation’s description of the station includes a link to the corresponding ACORN-SAT time series via the
We can use a SPARQL query like the one below to retrieve the latest observations for the Canberra Airport weather station, along with links to the corresponding ACORN-SAT station and historical data time series.

Weather observations linked with ACORN-SAT records.
Using the linked datasets it is possible to, for example, compare the latest weather observations at a weather station with the historical mean temperatures for that location. Figure 3 shows this scenario in a demonstrator created for the weather observations.
In this pilot project, an important public dataset, ACORN-SAT has been made available as Linked Data. The publication of this dataset represented a milestone in e-government in Australia – it was the first linked data published by the Australian Government’s open data sharing initiative known as data.gov.au. Thanks to the coupling of the SSN ontology and the RDF Data Cube vocabulary, we can publish valuable metadata alongside the observation data. We believe that this explicit support for metadata attachment is of prime importance to the publication of climate data, and may help to enrich the public debate about the scientific foundations for climate science.
The lessons learned from this project and the open challenges that arose in relation to identifying and naming government resources led to the establishment of the Australian Government Linked Data Working Group (http://linked.data.gov.au) with participants from eight government agencies. The working group, including several of the authors of this paper, is developing technical guidance (URI rules,7
https://github.com/AGLDWG/TR/wiki/URI-Guidelines-for-publishing-linked-datasets-on-data.gov.au-v0.1.
The ACORN-SAT linked climate dataset has already demonstrated its importance as a hub for a growing ecology of Australian weather-related linked data, as for example demonstrated in Taylor et al. [17].
We have noted [13] that observed properties are declared as classes in the SSN ontology yet as properties in the RDF Data Cube. At present, the SSN is being reviewed for recommendation by the W3C and closer alignment with the RDF Data Cube is planned [18].
We used a significant subset of the SSN ontology to encode the information available in the station catalogue document [3]. Further data curation work is required to publish more complete data about the types of stations, sensors or screens, the changes in the observation time intervals and procedures. We introduced many specific classes to accurately describe the evolving nature of ACORN-SAT and BoM stations over time. A mechanism similar to the Qualification pattern used in the Provenance ontology [12] could help to hide this complexity to the data consumers. The Provenance ontology might also answer the increasing demand for transparency and reproducibility.