
Abstract
In recent years, named entity linking (NEL) tools were primarily developed in terms of a general approach, whereas today numerous tools are focusing on specific domains such as e.g. the mapping of persons and organizations only, or the annotation of locations or events in microposts. However, the available benchmark datasets necessary for the evaluation of NEL tools do not reflect this focalizing trend. We have analyzed the evaluation process applied in the NEL benchmarking framework GERBIL [in: Proceedings of the 24th International Conference on World Wide Web (WWW’15), International World Wide Web Conferences Steering Committee, Republic and Canton of Geneva, Switzerland, 2015, pp. 1133–1143, Semantic Web
Introduction
Named entity linking (NEL) is the task of interconnecting natural language text fragments with entities in formal knowledge-bases with the purpose to e.g. help subsequent processing tools to cope with ambiguities of natural language. NEL has evolved to a fundamental requirement for a range of applications, such as (web-)search engines, e.g. by mapping the content of search queries to a knowledge-graph [32] or to improve search rankings [39]. By linking textual content to formal knowledge-bases, exploratory search systems as well as content-based recommender systems greatly benefit from the underlying graph structures by leveraging semantic similarity and relatedness measures [35]. Likewise, social media and web monitoring systems benefit from NEL, e.g. by the identification of persons or companies in social media content as subject of observation or tracking. A general survey on current NEL systems has been provided in [16,31].
While the number of application scenarios for NEL is on the increase, likewise the number of different NEL approaches is evolving ranging from simple string matching techniques to complex optimization based on machine learning [26]. Most NEL approaches make use of a general solution strategy, however there is an uprising trend for specialized solutions. In [43] the authors demonstrate an approach focused on medical literature while [8] examine heritage texts with NEL. Other approaches are focused on specific entity types, such as e.g. [7], which is applied to the domain of art. Another interesting solution is [1], which can be utilized to build domain specific NEL tools. The approach of [41] extracts semantic information from mixed media types like scientific videos. This ongoing fragmentation of types of tasks aggravates the application of generic benchmarking frameworks for NEL optimization and comparison such as GERBIL [30,37] or NERD [27,28].
With GERBIL, a NEL tool optimized for the detection of person names only might be rather difficult to compare to other NEL tools of a more general focus or specialized for another topic. However, the benchmark datasets provided with GERBIL are annotated with all types of entities including organizations, events, etc. Therefore, by using these general typed benchmarks the overall achieved results with GERBIL might only be hard to compare since the assumed person-only NEL system would wrongly be punished with false negatives caused by non-person annotations contained in the benchmarks. The only valid way to achieve an objective evaluation would be to manually filter a dataset to only contain persons and upload it to GERBIL for the desired experiment. However, these experiments are not reproducible, because it is neither clear or standardized, how the applied filtering was carried out, nor is the newly created filtered dataset always publicly available for further experiments. Moreover, it is not desirable to manage a plethora of different versions of filtered datasets. As of now, GERBIL deploys 19 annotation systems and more than 20 datasets, whereas these numbers are subject to constant change. For a detailed overview on the systems and datasets provided by GERBIL we refer to the official version.1
A first attempt to cope with this problem was made in [12] by manually compiling the Kore502
Since no ‘all-in-one’ perfect dataset has emerged in the past, which covers all the aspects sufficiently well, it would be beneficial to measure and provide dataset characteristics on the document level to subsequently allow a recompilation of documents across different datasets according to predefined criteria into a customized corpus. For example, for the already mentioned person-only annotation system these measures would help to specifically select only those documents, which exhibit a significant number of person annotations providing a predefined level of ‘difficulty’. Remixing evaluation datasets on the document level leads to a better and more application specific focus of NEL tool evaluation while simultaneously ensuring reproducibility.
We have already introduced an extension of the GERBIL framework enabling a more fine grained evaluation and in depth analysis of the deployed benchmark datasets according to different emphases [40]. To achieve this, an adaptive filter for arbitrary entities has been introduced together with a system to automatically measure benchmark dataset properties. The implementation including a result visualization are integrated in the publicly available GERBIL framework.
In this paper, we present the following contributions: the work presented in [40] is brought up-to-date, consolidated, and furthermore extended with
new additional dataset measures,
a stand-alone library to enable customized remixing of datasets,
a vocabulary to enrich NIF-based datasets with additional statistical information,
a subset of available datasets has been reorganized to enable benchmarking according to the different dataset properties, and
an in depth analysis of the performance of different systems on the reorganized datasets is presented.
The paper is structured as follows: after this introductory section, measures to characterize NEL datasets are introduced in Section 2. Section 3 explains the GERBIL integration as well as the stand-alone library in detail, while Section 4 elaborates on the most interesting properties on datasets we have determined so far and presents more insights on the systems performances on the reorganized and focused datasets. Finally, Section 5 concludes the paper with a summary of the presented work and an outlook on ongoing and future research.
NEL datasets have already been analyzed to great extent. We consider these analyses to identify their potential shortcomings to be able to introduce characteristics and measures to establish more differentiated analyses. In [15] the basic characteristics of 9 NEL datasets were introduced including the number of documents, number of mentions, entity types, and number of NIL annotations. In [34] a more detailed view on the distribution of entity types was given including mapping coverage, entity candidate count, maximum recall, as well as entity popularity. The overlap among datasets was investigated in [38], they also introduced the new measures confusability, prominence and dominance as indicators for ambiguity, popularity, and difficulty.
In this paper, amongst others also a subset of the proposed characteristics has been integrated into the GERBIL benchmarking system. Compared to previous work, where either a theoretical only or an experimental only treatment of the problem was presented, this paper contributes a ready to use implementation by means of extending the GERBIL source code3
Building on that we also provide a stand-alone library5
Before introducing the dataset characteristics one by one the terminology is presented.
A dataset D is a set of documents
An annotation
Furthermore, we define E as the infinite set of entities and S as the infinite set of surface forms such that they are supersets of all other sets of the form
In the Appendix of this paper a complete listing of the mathematical notation is given for overview purposes.
The hereafter defined measures might refer to different levels: dataset level, document level, and annotation (or entity) level. Table 1 contains an overview on which measure is considered at a specific level.
Overview of the introduced measures and the according levels of reference, where (
Some of the introduced measures are distinguished between micro and macro measurements [4]. Macro measurement aggregates the average results of each single document. Regarding document length, all documents have the same influence on the aggregated result. In contrast, the micro measurement takes the results of each document into account as if they would belong to one single document, which consequently increases the influence of larger documents.
The formal definition is provided for both measurements for density, likelihood of confusion, dominance, and maximum recall. All other definitions are provided as macro measurement if not stated otherwise.
In general, the number of annotations is a measure to estimate the size of the disambiguation context. The average number of annotations for a dataset
Not annotated documents
Some of the available benchmark datasets even contain documents without any annotations at all. Documents without annotations might lead to an increase of false positives in the evaluation results and thereby might cause a loss of precision. The fraction of not annotated documents for a dataset
Empty documents might be a problem for the annotation task (A2KB), but not for the disambiguation only task (D2KB), where empty document annotations are simply omitted in the processing.
Missing annotations (density)
Similar to not annotated documents, missing annotations in an otherwise annotated document might lead to a problem with the A2KB task. Annotation systems potentially identify these missing annotations, which are not confirmed in the available ground truth and thus are counted as false positives. It is not possible to determine the specific number of missing annotations without conducting an objective manual assessment of the entire ground truth data, which requires major effort. However, we propose to estimate this number by measuring an annotation density value which is the fraction of the number of annotations and the document text length. The
If an annotation is spanning more than one word, it is only counted as one annotation.
Prominence (popularity)
The assumption of [38] is, that an evaluation against a corpus with a tendency to focus strongly on prominent or popular entities may cause bias. Hence, NEL systems preferring popular entities potentially exhibit an increase in performance. To verify this, we have implemented two different measures on the annotation level. Similarly to [38], the prominence is estimated as PageRank [22] of entities, based on their underlying link graph in the knowledge base. Additionally, we also take into account Hub and Authorities (HITS) values as a complementary popularity related score. PageRank as well as HITS values were obtained from [25].
To classify annotations, documents, and datasets according to different levels of prominence of entities, the set of entities was partitioned as follows. PageRank (respectively HITS) underlies a power-law distribution (cf. Section 4.2.1), meaning that only a few entities exhibit a high PageRank and the majority of entities a lower PageRank (long-tail), cf. Fig. 1. Highly prominent entities are then defined as the upper 10% of the top PageRank values. The subsequent 45% (i.e. 10%–55%) define medium prominence and the lower 45% (i.e. 55%–100%) low prominence.
It is important to mention that for a dataset with a stronger bias towards head entities, the entities of the middle or lower segment would then be in the higher segment for a dataset with a more even distribution. Thus, when working with multiple datasets, a global partitioning including all values of all entities is preferred.

Example partitioning for the PageRank.
For an arbitrary scoring algorithm P we can define the set of entities within a specific interval
The resulting set contains all entities of a dataset that satisfies the given interval limits. A disadvantage of this approach is that entities, which do not have a score assigned, are not part of one of the resulting sets. Similarly the prominence can be determined using the HITS values or any other ranking score.
Since a surface form might denote multiple meanings as well as entities might be represented by different textual representatives the likelihood of confusion is a measure for the level of ambiguity for one surface form or entity. It was first proposed in [38] for surface forms. The authors pointed out that the true likelihood of confusion is always unknown due to a missing exhaustive collection of all named entities.

The likelihood of confusion for a surface form is determined by the total number of possible entities known to some annotating system and a dataset
The likelihood of confusion needs some considerations beforehand. It can be determined for both sides of an annotation
We define a dictionary of an annotating system by
As shown in Fig. 2 the text …Bruce…(lower box) has an annotation with ‘Bruce’ as surface form s. This surface form can be linked against different entities, i.e. they are homonyms, thus exhibiting the same writing but different meanings. As shown in the figure, an entity can belong to the dataset or is unknown to the dataset but known to the annotating system. Also, the entity can be unknown to both sets.
For the other side we define a dictionary of the annotating systems
Figure 3 shows the other side where the text annotation has

The likelihood of confusion for an entity mention is the number of possible related surface forms shown in light blue.
As already mentioned, a surface form s or an entity e can be placed within four possible locations:
Unknown to dictionary and dataset:
Only known to the dataset:
Only known to the dictionary:
Known to dictionary and dataset:
The example annotation system dictionaries
For a dataset and a dictionary, the average likelihood of confusion is determined for surface forms
The intuition is, the more entities exist per surface form, the larger is the likelihood of confusion
The average likelihood of confusion for entities
Again, an annotation within a dataset contains a surface form and an entity. For each side (surface form or entity) the likelihood of confusion is determined by counting the elements belonging to this particular side.
The measures should roughly indicate the difficulty distribution of a dataset.
In [38] the dominance was introduced as a measure of how commonly a specific surface form is really meant for an entity with respect to other possible surface forms. A low dominance in a dataset leads to a low variance for an automated disambiguation system and to possible over-fitting. Similar to the likelihood of confusion, the true dominance remains unknown. Again, in addition to the work presented in [38] we estimate dominance for both sides of an annotation
For example the entity
As example for the other side, for the given surface form ‘Anna’ the dictionary provides 10 different entities, while the dataset only uses 2 entities for different mentions of the surface form ‘Anna’, which results in a 20% dominance of ‘Anna’ for the dataset under consideration. The dominance of a surface form determines how many different entities are used with this surface form in the dataset (homonyms). It indicates the variance or flexibility of the used vocabulary and expresses the dependency on context. Dominance indicates the expressiveness of the used dataset. An extensive one exhibits more diversity. The dominance of a dataset is closely related to the likelihood of confusion since it describes the coverage among the dataset and dictionary.
The average dominance for a dataset D is determined for all entities
Since the actual dominance is unknown and the completeness of the applied dictionaries cannot be guaranteed, computed values above the nominal threshold of 1.0 are possible. These results refer to an incomplete dictionary, i.e. there are more patterns used in the dataset than the applied dictionary does contains. The subsequently described maximum recall takes care of this aspect.
Maximum recall
Most of the NEL approaches apply dictionaries to look up possible entity candidates matching a given surface form. If the dictionary doesn’t contain an appropriate mapping for the surface form the annotation system is unable to identify a possible entity candidate at all.
As Fig. 3 shows and as already mentioned before some parts of the dataset might not be contained within the dictionary. Surface forms not in the intersection are unlikely to be found by entity linking since the annotation systems are using dictionaries to look up potential relations. Therefore, an incomplete dictionary limits the performance of an NEL system since an unknown surface form will lead to a loss in precision. So the maximum recall can be seen as an artificial limit of a dataset.
To estimate the coverage of a mapping dictionary, the maximum recall measurement was introduced by [34].
For a dictionary
Types
Since some NEL approaches might be focused on a specific domain or handle some entity categories in a different way, a filter has been implemented to distinguish dataset entities by their type. Besides the focus of NEL approaches in [38] it is also stated that types of entities may be differently difficult to disambiguate such as person names (esp. first names) might be more ambiguous and country names more or less unique. A type filter for some type T and
Following these theoretical considerations, the extensions of the GERBIL framework and how the determined characteristics are exploited will be described in the subsequent sections.
Implementation
This section describes the implementation of the GERBIL extension and the standalone library. Furthermore, the vocabulary to integrate the calculated statistics in the NIF annotation model are explained in detail.
Extending GERBIL
Two new components have been implemented to extend the GERBIL framework: one component to filter and isolate subsets of the available datasets, and a second component to calculate aggregated statistics about the data (sub-)sets according to the newly introduced measures. It is important to mention that these filters and calculations can also be applied to newly uploaded datasets. Thus, the system can also be used to gain insights about any arbitrary ‘non-official’ datasets not yet part of the GERBIL framework. The implemented filter-cascade is of a generic type and can be adjusted via customized SPARQL queries. For example, to filter a dataset to only contain entities of type

Overview of the filter-cascade.
The
To partition the datasets according to entity prominence (popularity) we have additionally implemented a filter to segment the datasets in three subsets containing the top 10%, 10% to 55%, and 55% to 100% of the entities. This segmentation is applied to PageRank as well as HITS values separately.
Figure 4 shows a general overview of the filter cascade. The annotations produced by GERBIL are subsequently cleaned from invalid IRI’s. If they are already cached the result is returned. Otherwise the set is chunked and passed to the defined filter.
Buttons have been added as new control elements to the A2KB, C2KB, and D2KB overview pages in GERBIL (cf. Fig. 5). The user now is able to choose between the classic view ‘no-filter’, the persons, places, organisations filter views, the PageRank/HITS top 10%, 10–55%, and 55–100% filter views, a comparison view, or a statistical overview. All implemented measures are visualized in GERBIL using HighCharts.6
Before discussing the dataset statistics as a result of the new GERBIL extension, the following section introduces the stand-alone-library for statistics calculation as well as the new vocabulary.

New dataset filters for A2KB experiments in the GERBIL user interface.
Following the considerations mentioned in the previous sections, the proposed measurements can also be calculated independently of GERBIL with a separate stand-alone library. The library consumes a NIF encoded input file, calculates the proposed statistics, and extends the NIF file with the newly determined information. A comprehensive documentation as well as the library source code is provided at Github.9
To serialize the calculated statistics generated by the GERBIL extension as well as by the library, a vocabulary has been defined with three layers to be integrated into the NIF model.
Overview of the introduced properties and the corresponding measurements (
The first layer refers to an entity mention, respectively annotation, (e.g. NIF phrase) with its corresponding text fragment. The second layer addresses to the document (e.g. NIF context) that provides the text where the entity mentions are embedded. A third layer groups documents together to form a dataset. We introduce the
On the document level 6 new properties have been introduced to cover density, likelihood of confusion, and maximum recall. The likelihood of confusion, prominence, and the types are also assigned on the entity mention level.
In Table 2 an overview over the introduced properties and their corresponding level is presented. Figure 6 shows an excerpt of the extended Kore50 dataset for the new dataset class. One can see the new dataset statistics introduced by the RDF properties introduced by the hfts: prefix. In Fig. 7 an example for the document level is presented (
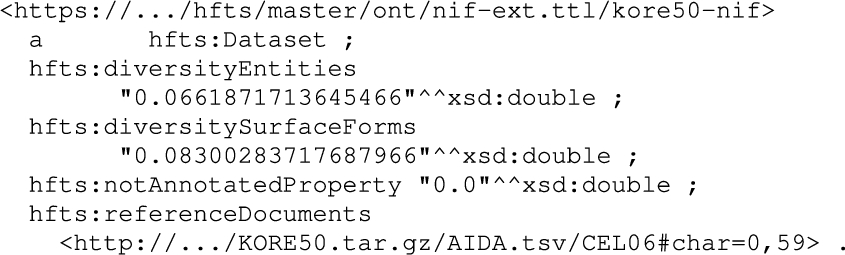
An example of the new statistics properties on dataset level extending the KORE50 dataset.
Next, the possibility of remixing customized benchmark datasets will be explained including several examples.

An example of the new statistics properties on document level extending the KORE50 dataset.
The basic idea of remixing NEL benchmark datasets is to tailor new customized datasets from the existing ones by selecting documents based on desired emphases. This enables the compilation of focused benchmark datasets for NEL. For remixing it is proposed to store all analysed datasets in a single RDF triple store. This enables to quickly access the dataset documents via the SPARQL query language. In particular, SPARQL CONSTRUCT queries can be applied to select exactly those triples from the document annotations that meet a particular criteria, as e.g., popular persons, high possible maximum recall, places difficult to disambiguate, or any other arbitrary criteria, which can be expressed via SPARQL filter rules.

Basic query that selects only documents with a maximum recall ⩾1.0.
For this purpose, we introduce the basic query shown in Fig. 8. A CONSTRUCT statement creates RDF triples from document annotations meeting the filter requirement maximumRecall ⩾ 1.0. This basic query utilizes the entire RDF induced graph and it might be useful to limit the number of documents that should be returned by the query. For this task, a subquery can be applied as shown in the second example in Fig. 9.
Another example is presented in Fig. 10. The SPARQL subselect chooses only documents that contain persons and aggregates their number. Subsequently, the CONSTRUCT statement selects documents that contain more than 4 persons with a maximum recall of at least 0.8.

This query in addition limits the number of selected documents.
To underline that any kind of filter can be applied, Fig. 11 shows a more specific example using a federated query to select only documents from the RDF graph with persons born before 1970. To achieve this, the official DBpedia SPARQL endpoint is queried for additional information that is not present within the given benchmark datasets. More SPARQL examples can be found at Github.11

Extract documents with a maximum recall of 0.8 and at least 4 person.

A SPARQL query that selects documents containing persons born before 1970 via additional data queried from the DBpedia SPARQL endpoint.
For authoring arbitrary queries two aspects should be considered. First, many values of the proposed measurements are given as absolute values and are not always equally distributed across the datasets, documents, and annotations. Hence, it is necessary to investigate on the boundary values and value distribution before specifying a specific threshold. It is a subject of future work to normalize and harmonize the statistics adequately. Second, the proposed query examples are based on the document level. Therefore, if an annotation meets a requirement, the entire document together with all its annotations (which might not meet the requirement) is added to the result. Of course, queries can also be structured to only return the filtered annotations, but this might lead to a missing annotation scenario that again might result in a drop of recall for the A2KB task.
Finally, the thereby newly created dataset can be uploaded to the GERBIL platform for a precisely tailored evaluation experiment.
This section presents the results of the execution of the proposed measures on the GERBIL datasets. Furthermore, an in depth overview on how to use the new library to partition the benchmarking datasets according to different criteria and to analyze the systems performances in much greater detail is presented.
GERBIL datasets
The following datasets have been analyzed according to the characteristics introduced in Section 2: WES2015 [39], OKE2015 [21], DBpedia Spotlight [17], KORE50 [12], MSNBC [5], IITB [14], RSS500 [29], Micropost2014 [2], Reuters128 [29], ACE2004 [19], AQUAINT [18], and NEWS-100 [29]. In this section, only the most significant results are presented. A complete listing of the achieved results is available online.12
Figure 12 shows the percentage of documents in the GERBIL datasets which were

Percentage of documents without annotations in the GERBIL datasets.

Annotation density as relative number of annotations respective document length in words.
Figure 13 shows the
Percentage of entities by entity type and entity popularity per dataset

Table 3 shows the

Average number of surface forms (SF) per entity (blue, left) and average number of entities per surface form (red/hatched, right) indicating the likelihood of confusion for each dataset.

Average dominance for surface forms (blue) and entities (red/hatched) per dataset.
Figure 14 shows the
In Section 4.2.2 a correlation analysis between the likelihoods of confusion for entities and surface forms with precision and recall is presented.
Figure 15 shows the
On the other hand, the blue bars show the average dominance of surface forms. The dominance of a surface form expresses the relation of how many entities are using this surface form in the considered dataset and the overall number of entities in the dictionary using this surface form.
Referring to Fig. 15, the KORE50 dataset in which many persons are annotated uses only 7% of the possible entities for the contained surface forms. In average, entities are represented in the WES2015 dataset with 21% of their surface forms.
Since the datasets with a high likelihood of confusion have a low dominance, it is arguable that these two measures express somehow the contrary. For example, the KORE50 dataset has a high likelihood of confusion for surface forms with 446 entities for one surface form on the average. This means that for a high dominance each surface form is represented by more than 400 entities within this dataset. Such a high dominance means also that a high coverage of surface forms (dominance of entities) or entities (dominance of surface forms) is present. For example, in the WES2015 dataset, which is focused on blog posts on rather specific topics, many rare entities (i.e. entities with a low popularity) with many different notations are used resulting in a likelihood of confusion of 15 surface forms for an entity on the average. The average dominance of entities is quite high with 21%, since the likelihood of confusion is low and topic specific blog posts often vary the surface forms for an entity to enrich the spiritedness of the text. This is commonly known from articles or essays, where the author usually tries to minimize frequent repetitions of surface form by varying the surface form for the entity under consideration to avoid monotony and to make the article more interesting to read. It might be concluded that a high dominance covers the diversity of natural language more precisely and therefore could be considered a means to prevent overfitting.
The News-100 dataset shows an anomaly in the dominance of entities, which is larger than 100 %. The reason for that is that the dataset contains a large number of entities from the German DBpedia. For these entities a surface form cannot be found in the dictionary (which was generated from the English DBpedia). That means, there are more surface forms present in the dataset than in the dictionary, which results in a dominance value larger than 100 %.
This section has introduced and discussed the results of the statistical dataset analysis. Based on the information embedded in the NIF dataset files, a customized reorganisation of datasets can be accomplished as explained in the following section.
To gain more insights on the interplay of annotation systems performance and the introduced dataset characteristics, this section describes how the datasets are reorganized to determine each system’s performance with focus on a given measure.
The approach is to first combine the datasets into one large dataset and then divide it into partitions. Each partition contains only those annotations or documents that lie in a specified interval of values of one of the proposed measures. For this purpose and to insert the statistical data into the NIF document the proposed library has been applied. Subsequently, the entire dataset was stored in an RDF triple store. With the SPARQL queries proposed in the previous sections, each partition was constructed and stored in a separate NIF document, which was submitted to the official GERBIL service to acquire the results.
For the conducted experiments the following public and GERBIL ‘shipped’ datasets have been used: DBpedia Spotlight, KORE50, Reuters128, RSS500, ACE2004, IITB, MSNBC, News100, AQUAINT. Other available datasets were either not publicly available or not in the NIF format.
Since the official GERBIL service was used to conduct the experiments, the therewith provided systems are included in the experiments. Unfortunately, not all systems returned consistent results due to too many errors or insufficient availability. However, if sufficient results could be provided, the system was included in the analysis.
The following annotation systems provided by GERBIL have been used: AGDISTIS [36], AIDA [13], Babelfy [20], DBpedia Spotlight [17], Dexter [3], Entityclassifier.eu [6], FOX [33], Kea [42], WAT [23] and PBOH [9].
The measures used in the subsequent experiments are the measures currently supported by the library (i.e. likelihood of confusion, HITS, PageRank, density, and numbers of annotations). In general, both the A2KB as well as D2KB types of experiments, might be applied. For likelihood of confusion, HITS and PageRank only D2KB is provided because these are characteristics of the annotations. Number of annotations as estimation for the size of the disambiguation context is used with A2KB and D2KB types of tasks, density as characteristic of documents is used with A2KB only. All data as well as the achieved results can be found online.13

Distribution of values (linear scale).
Figure 16 presents the distribution of the data values over all datasets. In total, the dataset contains 16,821 annotation in 1043 documents. The figure shows a distribution chart for each measure. On the charts, the x-axis shows the number of annotations (for confusions, HITS, PageRank) or documents (for density and number of annotations). The y-axis shows the absolute values of the measures. Each of the charts approximate a power-law distribution, i.e. only a few items exhibit large values and many items smaller values. For HITS and PageRank only 14,372 items are available, because for 2,449 entities no HITS or PageRank value could be determined.

Distribution of values (log scale).
We have decided to apply a decile partitioning. It seems a reasonably well choice to indicate low, medium, large as well as the boundary values. When partitioning on the item values an uneven distribution of values over the partitions occurs because of the power-law, i.e. the first partition would contain a very large disproportionate number of items and the last partition only a very few items. To achieve a more even distribution a logarithmic scaling on the values is applied as shown in Fig. 17. The red horizontal dashed lines indicate the partition boundaries. Table 4 shows for each measure the threshold values (thr) for the partition boundaries as well as the number of items per partition (qty). For HITS and PageRank an additional partition was introduced to also include the items without a value (unspec.). Each threshold is meant as the upper boundary of the partition, thus the lower boundary is the threshold of the previous partition. The color coding in the background of the cells will be explained later.
Partitioning thresholds (log-based) and annotation/document quantities (this table is best viewed in color)
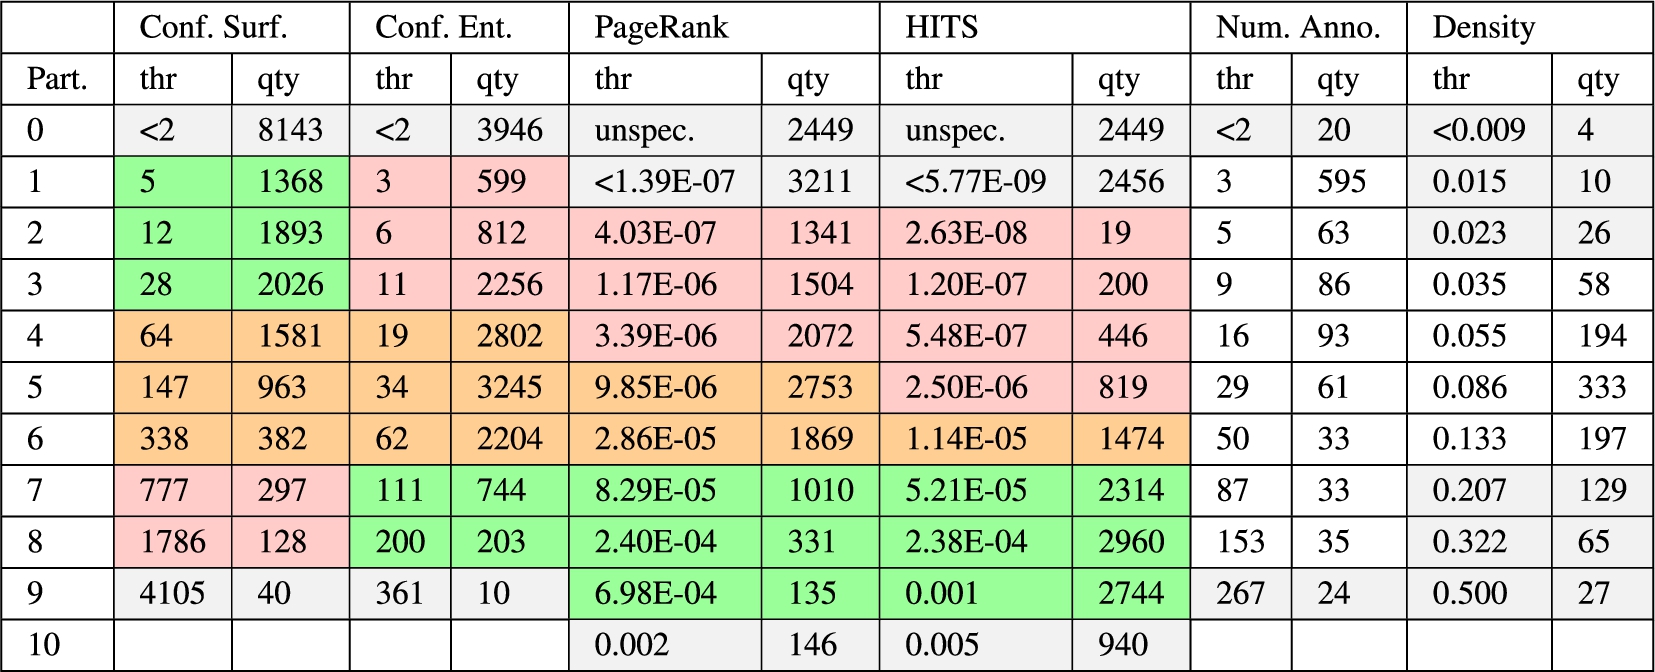
Figure 18 shows the experimental results of each system for the likelihood of confusion of surface forms. Each graph shows the partitions (x-axis), as well as the determined

Likelihood of confusion for surface forms (D2KB).
The likelihood of confusion for surface forms describes the number of entities mapping to one particular surface form. For an annotation in the dataset, a confusion of 30 signifies that 30 possible entities for that surface form exist (homonymy).
The leftmost partition (0) contains lower values, thus annotations contain surface forms with fewer numbers of entities mapping to them and therefore a lower likelihood of confusion. Typical are for example surface forms mentioning full names, as e.g., ‘Britney Spears’, ‘Northwest Airlines’, or ‘JavaScript’. The rightmost partition (9) shows larger values. It is expected that the annotations in the right partitions are more difficult to disambiguate since they exhibit a larger likelihood of confusion. The first partition contains almost half of all values, indicating that for almost half of the annotations only one entity maps to the surface form. For the second to sixth partition a reasonable even distribution is given. Considering Table 4, only 40 items are in the rightmost partition. These include the names Allen, Bill, Bob, Carlos, David, Davis, Eric, Jan, John, Johnson, Jones, Karl, Kim, Lee, Martin, Mary, Miller, Paul, Robert, Ryan, Steve, Taylor, and Thomas.
This experiment was applied as a disambiguation task (D2KB).14
To interprete the figures in general, the presented graphs show a trend from the upper left to the lower right, meaning that the systems performance decreases with growing likelihood of confusion. Many systems, except AIDA and Babelfy, fail with surface forms having more than ca. 1,700 entities mapping to (8th partition and above). Entityclassifier.eu, Dexter, and FOX show a very strong focus on precision, at the expense of recall, as we can also see in the further experiments.
It can be concluded that the fewer entities are mapping to a particular surface form, the easier seems the disambiguation task. For surface forms with more than 1,700 potential entity candidates the reliability of the disambiguation might drop dramatically.

Likelihood of confusion for entities (D2KB).
Figure 19 shows the experimental results of each system for the likelihood of confusion of entities. The graphs are presented in the same way as for the previous measure. The likelihood of confusion for entities describes to how many surface forms the entity of an annotation is mapping to. For an annotation, a confusion of 30 means that 29 surface forms besides the one within the annotation share the same entity.
The leftmost partition (0) contains lower values, thus annotations with entities mapping to only one surface form. The rightmost partition (9) contain annotations with entities mapping to more than 361 surface forms e.g.
This experiment was applied as disambiguation task (D2KB).15
In general, there is an upward trend, i.e., the more surface forms are available for an entity, the better it is. However, almost all systems have in common, that the performance drops rather abruptly on the first partition (0) compared to the second partition (1). A closer look on the partition data revealed that a large share of the entities in partition 0 are resources originating from Wikipedia redirect and disambiguation pages (e.g.
Overall, it can be concluded that the more surface forms an entity is mapping to, the better the systems performances are. Furthermore, the datasets containing a larger number of redirect and disambiguation resources can bias the systems performances. Future work will repeat this analysis without bias to gain insights about, how well the systems really perform on the first partition.

Results for PageRank (D2KB).
Figure 20 shows the systems performances on the popularity estimation via PageRank values. Now, an additional partition is included in the graphs, which is located left (partition 0) showing the results on the 2,449 annotations, where no PageRank was given. For all other partitions, the PageRank values increase from left to right. Thus, popular entities can be found on the right hand. The distribution of values across the partitions is reasonable even.
The experiments were conducted as D2KB task.16
In the graph a general uprising trend can be observed, i.e. popular entities are better disambiguated than unpopular entities, but with the exception of AIDA and Babelfy, all systems struggle with extremely popular entities (partition 10). A view in the data revealed that the 146 annotations only refer to the 4 entities
In conclusion, a positive correlation (>0.7) between the PageRank values and the systems performances can be observed. It seems likely that popular entities are used much more frequently, while being described via many varying surface forms.

Results for HITS (D2KB).
Similarly to PageRank, HITS values were not provided for all entities, thus partition 0 contains the annotations with unspecified values (see Fig. 21). For the other partitions the HITS values are increasing from left to right. According to Table 4, partition 2 contains only very few annotations (19). The other partitions contain a more representative number of items.
Again, the experiments were conducted as D2KB tasks.17
The HITS analysis reveals that for very low values (partition 1) and higher values (partition 6 and upwards) the systems provide better results than for the medium values (partitions 2–5). There is a weak correlation among HITS and the systems performances (>0.4). This could be interpreted as with increasing partition number there are more entities with higher popularity, which might cause better disambiguation results.

Results for number of annotations (D2KB).

Results for number of annotations (A2KB).
Figure 22 and 23 show the results for the number of annotations measure. This measure is not to be interpreted as a quality of the annotations but of the documents. Table 4 shows that more than half (595) of the 1,043 documents contain exactly 3 annotations, indicated by partition 1. Only 20 documents contain fewer annotations (partition 0). The number of annotations also corresponds to the size of the ‘disambiguation context’.
For this measure both experiment types D2KB18
In Fig. 22 (D2KB) it can be observed that some systems are not robust against growing context size, as e.g., AGDISTIS, AIDA, Entityclassifier.eu, and FOX. The other systems exhibit a more or less constant behaviour. The annotation tasks (A2KB) presented in Fig. 22 confirm this observation. Almost every system increases precision with growing context sizes, but on the expense of recall. This drifting apart occurs between the 4th and 6th partition (16 to 50 annotations per document). KEA seems to strongly benefit from increasing context sizes, while FOX benefits from smaller context sizes.
Results for density (A2KB).
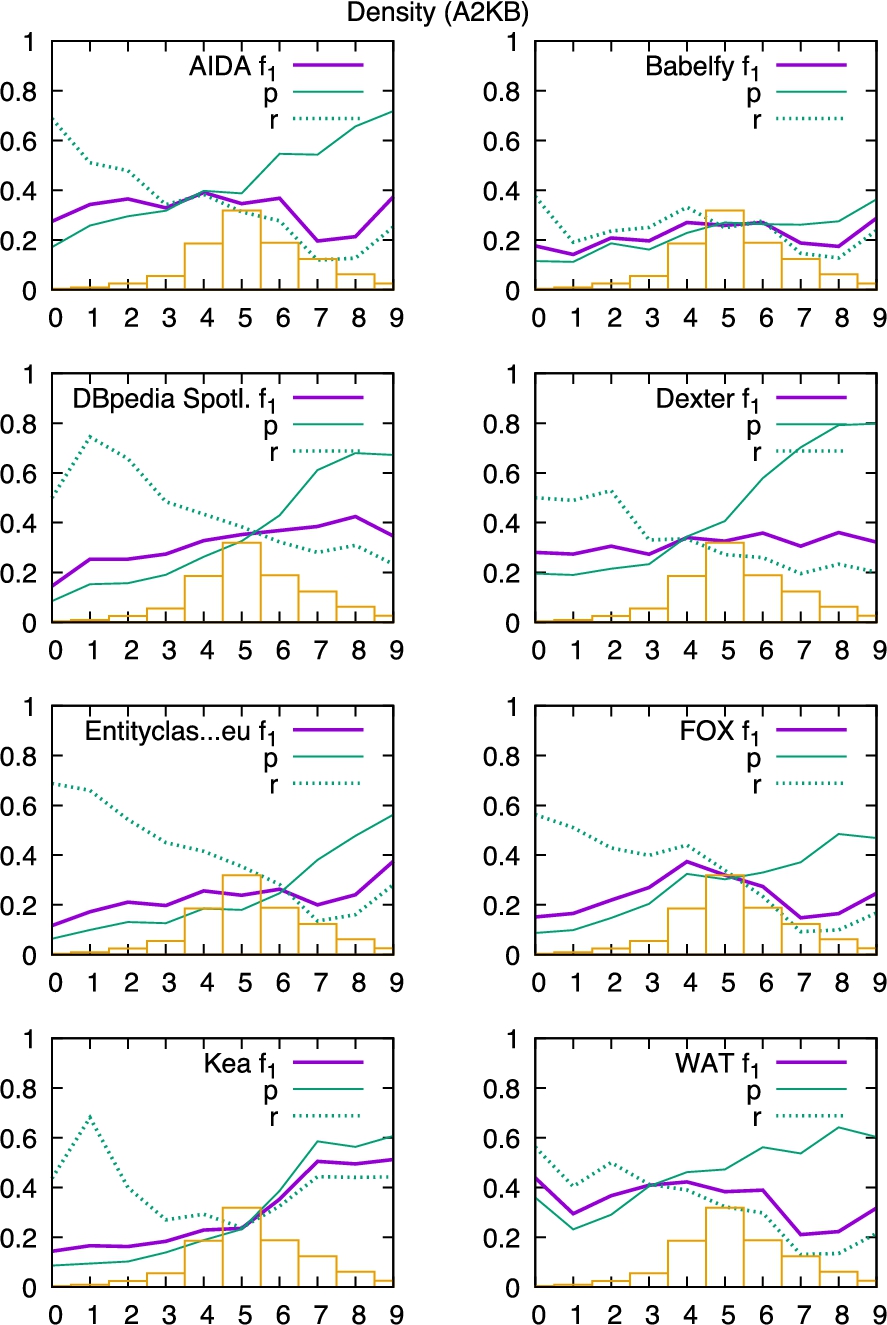
The results for the density measure are presented in Fig. 24. Density also is a quality of the documents and not of their annotations. Low density (left hand partitions) signifies that a longer document has only a few annotations. High density (right hand partitions) on the other hand signifies that a document contains many annotations relative to its length.
For density the experiments were conducted as A2KB tasks.20
From the presented graphs it can be observed that the systems perform on low dense documents with high recall, but comparably low precision. On the other hand, dense documents are annotated with higher precision, but lower recall. While Babelfy performs more or less evenly distributed, KEA seems to also maintain recall with denser documents. The break even point between precision and recall is located between the 4th and 6th partition (density between 0.055 and 0.133).
The density only estimates the number of missing annotations and the correlation between this metric and precision and recall supports this to some extent. However, it is important to also take into account the reasons for sparsity. Sparsity in the annotations can also stem from a specific combination of a knowledge base and documents. Very domain specific documents with little coverage in the knowledge base will often be sparsely annotated, even if the annotation is complete with respect to the knowledge base. This limits this metric’s utility. It would be interesting to asses whether the density can be put in relation to the dominance of entities and surfaces forms in order to reduce domain and knowledge base dependencies.
Micro-f1 results of D2KB systems for different remixed datasets

Table 5 shows the achieved micro-f1 results of the systems for the D2KB task. The top row indicates the original GERBIL results21
For persons,22
The next 2 rows separate annotations into a dataset containing entities with
Another filtering was performed by filtering entities according to class membership of typical classes of the three different domains: Music,27
The last four rows show datasets filtered according to thresholds of the proposed measures. For the first, we removed the first and last decile partition to avoid bias caused by disambiguation and redirect resources, too popular and unpopular entities, entities without information about PageRank and HITS, extremely short and large contexts, extreme homonyms and synonyms (likelihood of confusion). Furthermore, the density was restricted to a moderate level around the break even points between precision and recall to avoid major bias caused by extreme strong and low density. The filtered dataset is denoted as the ‘low skew’ dataset.30
From all these restrictions, all annotations have been filtered, which fall into the intersection of the opposite filters, denoted as the ‘high skew’ dataset31
Table 5 shows that the results for the ‘low skew’ dataset are overall better than for the ‘high skew’ dataset. But surprisingly, 3 systems (KEA, AGDISTIS, Dexter) perform with larger f-measure than on the ‘low skew’ dataset. With a larger value of 0.898 the Pearson value suggests a slightly better correlation with the baseline for the ‘low skew’ dataset than for the ‘high skew’ dataset with 0.866.
For the ‘high skew’ dataset, 66 annotations might not be very representative, but applying all the restrictions resulted in this rather small dataset. To increase the size we attempted to relax the restrictions slightly and created the ‘medium skew’ dataset.32
The last two remixed datasets are derived from the ‘low skew’ dataset. The first one was compiled with the intent to include only annotations, which are comparably ‘easy’ to disambiguate.33
KEA performed well on the dataset that was considered easier, but not on the difficult dataset where PBOH is ahead of all other systems. The average numbers of the easy and difficult datasets suggest that expectations have been fulfilled. The dataset considered more difficult to solve in fact is more difficult to solve and the easy dataset easier to solve than others. The results for the difficult dataset only slightly correlate with the overall results.

Annotation density as relative number of annotations respective document length in words.
For a further detailed view on the data, the characteristics of the remixed datasets have been calculated and are presented in Fig. 25, 26, and 27.

Average number of surface forms (SF) per entity (blue, left) and average number of entities per surface form (red/hatched, right) indicating the likelihood of confusion for each dataset.
Figure 25 shows the density values of the remixed datasets. Since the datasets are filtered on annotation level and therewith some annotations were not included, it is to be expected that the density values are overall smaller compared to the unfiltered datasets (see Fig. 13). For the experiments conducted as D2KB tasks, the density does not influence the results. For A2KB tasks it might be more useful to remix on document level instead of annotation level.
In Fig. 26 the likelihood of confusions are presented. As expected, the difficult dataset contains a larger average number of entities per surface form, indicating more homonyms compared to the easy dataset. Furthermore, the number of surface forms per entity is smaller for the difficult compared to the easy dataset, indicating a smaller number of synonyms. We might conclude, that items of the Science category are more difficult to disambiguate than items of the Place category. The ‘high skew’ category almost only contains one item per surface form, respectively entity. Revising the data revealed that with the filtering of this category (cf. Table 4 grey background cells) partition 9 for the likelihoods of confusion has been completely cleared out by the other restrictions (PageRank, HITS, etc.). Thus, it seems that there exist some dependencies between the measures.
In Fig. 27 the dominance of entities and surface forms is presented. In general, for the remixed datasets the dominance of entities is larger than for the original datasets. This is to be expected, because by filtering out annotations in the dataset (reducing

Average dominance for surface forms (blue) and entities (red/hatched) per dataset.
Coverage of origin datasets and remixed datasets
Coverage of origin datasets and remixed datasets
To also observe the distribution of the origin datasets over the remixed datasets the following analysis is performed. Table 6 shows the coverage of the origin datasets (rows) and the remixed datasets (columns). The first data row shows the number of annotations in the remixed datasets. Column ‘Complete’ corresponds to the join of all origin datasets. The origin datasets are described row by row. Each origin dataset item contains three lines of numbers. The first line shows the number of annotations covered in the columnwise dataset, e.g. the KORE50 dataset contains 144 annotations, whereas 3 of them also belong to the ‘low skew’ dataset. The second line just shows the relative numbers, e.g. the KORE50 dataset contributes 0.86% to the ‘Complete’ set of annotations and 0.39% to the ‘low skew’ dataset. The third line relates the number of annotations of the column to the size of the origin dataset, meaning that e.g. 2.08% of the KORE50 dataset also belong to the ‘low skew’ dataset. Special aspects are highlighted through bold font.
It is observable, that the IITB dataset contributes almost two thirds to the entire experiments, which also leads to a large coverage over the remixed datasets. 4.99% of its annotations fall into the ‘med skew’ category. IITB and KORE50 seemingly are the most ‘high skew’ datasets. But, the number of ‘high skew’ annotations overall is considerably low, so that it can be said, that there is no origin dataset which might suffer too much skewness.
On the other side, we see MSNBC and AQUAINT as considerably low skewed datasets. Over 20% of their annotations fall in that category.
With 11.97% of annotations AQUAINT has the largest fraction of easy annotations. The dataset with the largest relative number of difficult annotations is MSNBC with 5.23%. Surprisingly, the KORE50 dataset does not contribute to the difficult dataset at all, which contradicts KORE50’s creation intention.
In summary, the share of ‘high skew’ elements overall is rather small. There is no dataset that should be excluded in further evaluation experiments because it is completely ‘out of order’.
In this paper an extension of the GERBIL framework has been introduced to enable a more fine grained evaluation of NEL systems.
According to the predefined entity types, the KORE50 benchmark dataset contains the most persons, N3-Reuters-500 the most organizations, and ACE2004 the most places. The IITB dataset on the other hand contains almost no persons, organizations, or places. According to the PageRank algorithm the DBpedia Spotlight dataset contains the most prominent entities, while the Micropost 2014 Test dataset contains the most entities with medium and low prominence. N3-RSS contains the fewest popular and OKE 2015 gold standard the fewest medium and low prominence entities. The HITS value showed a more diverse picture with Micropost 2014 Train containing the most popular entities, MSNBC with the most medium prominence entities, and WES2015 with the most low prominence entities. On the other hand, IITB contains the fewest high prominence entities and OKE 2015 gold standard follows with the fewest medium prominence entities. N3-RSS-500 contains the fewest low prominence entities.
A stand-alone library has been introduced to enrich documents encoded in the NIF format with additional meta information. This enables researchers to remix existing NIF-based datasets according to their needs in a reproducible manner.
An exhaustive example was presented, on how to use the library to reorganize datasets according to the measures introduced earlier. Therefore, datasets were combined and partitioned to determine and visualize for each system correlations between a dataset property and the system’s performance. It was ascertained that systems fail with homonyms with a likelihood of confusion beyond ca. 1,700 entities mapping to the surface form. From the analysis on entities’ likelihood of confusions, it was confirmed that redirect and disambiguation resources strongly bias the overall results. However, the overall performance increases the more surface forms an entity is mapping to. It was also shown that the PageRank of entities correlates with the systems performance, but only up to a certain threshold. Interestingly, for the HITS measure the systems produced poor results on low to medium, but very good results on very low and larger values. It was further shown that not all systems are robust against a rising number of annotations in a text to disambiguate. Many systems tend to suffer loss of recall with larger numbers of items to disambiguate. While FOX greatly performs on smaller contexts, KEA benefits from larger numbers of annotations in a context. Finally, the density measure shows that text with rather few annotations can promote recall and demote precision very unevenly.
Furthermore, an overall comparison of different filtered datasets was given including a focus on specific domains, as e.g., persons, organizations, places, music, science, movies/tv. Although KEA and PBOH perform well in the majority of cases, they are not necessarily the best performing systems. Babelfy greatly performs on the science domain, thus, there are domain and dataset structure specific preferences across the systems. Therefore, it is of major importance always to take into account the characteristics of datasets for entity linking benchmarks.
It is impossible to define how a perfect ‘one for all’ dataset should look like. However, we attempted to compile at least one dataset that is almost free of the apparent biasing factors ascertained from the proposed measures. To determine the ‘difficulty’ of a dataset, the confusion and popularity measures seem to be appropriate measures, but only in combination with moderate size of context and balanced density. Extreme outliers should be avoided as possible. Also redirect and disambiguation resources distort the result very much.
From the remixing we have learned, that there are in fact domain differences in the performance of the annotating systems. The systems have their peculiarities according to the introduced measures and there are differences in the quality of datasets. But, we cannot find evidence, that the datasets under consideration contain a harmful number of inappropriate annotations.
Further biasing factors identified in the datasets are NIL (notInWiki) annotations and the mixture of language versions of DBpedia, as for example caused by including the News-100 dataset. Both should be taken into account in further versions of this work. Unfortunately, the applied online annotation systems were not always available. Moreover, it is not clear what the current development state of the systems is or how many systems exist that are not connected to GERBIL, which might also worthwhile to be included in further analysis.
Ongoing research is focused on the implementation of additional measures, such as e.g. those introduced by [10,24] and the annotation systems’ performance breakdown should also include the dominance and maximum recall measures. More datasets such as WES2015 and the Microposts series should be included in future versions.
Also, we would like to introduce difficulty levels for datasets along with new properties for annotation, which might be useful for further remixing, as e.g. a distinction of the NEL annotation for common and proper nouns, or the dependency on temporal context. The inter-systems agreement might also be a valuable measure to be included into an evaluation.
The results of this work as well as the provided source code and the public online service enable to improve further benchmarks, to optimize systems for a unprecedented level of detail, and the results enable to find the right tool or method for the desired annotation task.
In summary, the evaluation at a finer granular level allows a better understanding of the NEL process and also promotes the development of improved NEL systems.
Footnotes
Mathematical notation
| An annotation with surface form s, entity e, text index i, and length l. | |
| E | A set of entities. |
| Set of entities in dataset D. | |
| Set of entities in a document d. | |
| Set of entities for the surface form s. | |
| A mapping (dictionary) from surface forms to entities of an annotation system. | |
| Set of entities in dictionary for surface form s. | |
| S | Set of surface forms. |
| Set of surface forms in dataset D. | |
| Set of surface forms in document d. | |
| Set of surface forms for the entity e. | |
| A mapping (dictionary) from entities to surface forms of an annotation system. | |
| Set of surface forms in the dictionary for entity e. | |
| P | Arbitrary scoring algorithm (e.g. PageRank, HITS) to estimate popularity. |
Formula overview
Average number of annotations:
Average likelihood of confusion for all surface forms of dataset D
Average likelihood of confusion for all entities of dataset D:
Dominance of surface forms:
Dominance of entities:
Maximum recall:
Set of entities in dataset D with type T where