
Abstract
Social media is a rich source of up-to-date information about events such as incidents. The sheer amount of available information makes machine learning approaches a necessity to process this information further. This learning problem is often concerned with regionally restricted datasets such as data from only one city. Because social media data such as tweets varies considerably across different cities, the training of efficient models requires labeling data from each city of interest, which is costly and time consuming.
To avoid such an expensive labeling procedure, a generalizable model can be trained on data from one city and then applied to data from different cities. In this paper, we present Semantic Abstraction to improve the generalization of tweet classification. In particular, we derive features from Linked Open Data and include location and temporal mentions. A comprehensive evaluation on twenty datasets from ten different cities shows that Semantic Abstraction is indeed a valuable means for improving generalization. We show that this not only holds for a two-class problem where incident-related tweets are separated from non-related ones but also for a four-class problem where three different incident types and a neutral class are distinguished.
To get a thorough understanding of the generalization problem itself, we closely examined rule-based models from our evaluation. We conclude that on the one hand, the quality of the model strongly depends on the class distribution. On the other hand, the rules learned on cities with an equal class distribution are in most cases much more intuitive than those induced from skewed distributions. We also found that most of the learned rules rely on the novel semantically abstracted features.
Introduction
Social media platforms such as Twitter are widely used for sharing information about incidents. Different stakeholders, including emergency management and city administration, can highly benefit from using this up-to-date information. The large amount of new data created every day makes automatic filtering unavoidable in order to process this data further. Many approaches classify the type of an incident mentioned in social media by means of machine learning [1,39,40]. However, to build high-quality classifiers, labeled data is required. Given the large quantity of data in this context, creating such annotations is time consuming and therefore costly. Additionally, datasets are often naturally restricted to a certain context, i.e., labeling data from one particular city only allows training of efficient learning algorithms for exactly this city.
This is the case because the text in tweets from a particular city has special properties compared to other structured textual information. The expectation is that a model learned on one city consequently works well on that city as similar words are used, but not necessarily on data from a different city. These tokens, i.e., words, phrases or symbols, are likely to be related to the location where the text was created or contain certain topics. Thus, when the classifier relies on tokens such as named entities that are unique to the given city, e.g., street names and local sites, it is less suited for other cities where these do not occur. These aspects complicate the task of generalizing a classification model to other cities in the domain of social media texts. As an example, consider the following two tweets:
“RT: @People 0noe friday afternoon in heavy traffic, car crash on I-90, right lane closed”
“Road blocked due to traffic collision on I-495”
Both tweets comprise entities that might refer to the same thing with different wording, either on an abstract (“accident” and “car collision”) or semantically rather low level (“I-90” and “I-495”). With simple syntactical text similarity approaches using standard bag of words features, it is not easily possible to make use of this semantic similarity, even though it is highly valuable for classifying both tweets.
In this paper, we introduce Semantic Abstraction to create a generalized model and tackle this problem. We use training information in the form of Twitter tweets that were collected in different cities. In contrast to traditional Feature Augmentation [8], our approach does not discard features prior to model creation, but makes them abstract and city-independent. In detail, we use automatic named entity and temporal expression recognition to abstract location and temporal mentions. Furthermore, we incorporate background information provided by Linked Open Data1
Our goal is to show that Semantic Abstraction improves classification results significantly whenever a model is trained on one city and applied on data of a different one. We therefore performed a quantitative evaluation on twenty datasets from ten different cities, involving both a two-class- and a four-class problem with more differentiated incident types. Furthermore, we conducted an in-depth analysis of the trained models. We found that (1) Semantic Abstraction indeed improves model generalization, that (2) features generated by Semantic Abstraction are frequently used and that (3) the class distribution of the training dataset affects the quality of the generalized models.
In Section 2, we present our Semantic Abstraction approach for social media data, followed by a description of our datasets in Section 3. In the following Section 4, we outline our evaluation, and present the results from two experiments: The first involves training and testing our models on data from the same cities, followed by training and testing on data from different cities. The results are then interpreted via an in-depth inspection of the learned rules. After the evaluation, we give an overview of related work in Section 5. We close with our conclusions and future work in Section 6.
Our Semantic Abstraction approach requires us to identify named entities and expressions by means of Named Entity Recognition (NER). There is no common agreement on the definition of a named entity in the research community, and we use the following definitions throughout this paper:
An entity is a physical or non-physical thing that can be identified by its properties (e.g., my university). A
We further define the use of toponyms in written text as a specific type of named entities:
A
In natural language, names are not necessarily unique, e.g., there are 23 cities in the USA named “Paris”, and therefore have to be disambiguated. This means that named entities may only be unique within the appropriate context. Nevertheless, in short texts this contextual information is often missing [34]. However, we were able to show in prior work on tweet geolocalization [38] that the combination of different information sources helps us with coping with the disambiguation problem. In this paper, we demonstrate that the combination of different features is valuable, too.
Temporal expressions are another important part of short texts and therefore should be used as features. In this paper, we differentiate them from named entities in the sense as they were defined before. Thus, beside NER we apply Temporal Expression Recognition and Normalization (TERN). TERN copes with detecting and interpreting temporal expressions to allow further processing. We adopt the definition of [2]:
Examples for temporal expressions include “yesterday”, “last Monday”, “05.03.2013” and “2 hours”. We apply different methods for identifying and classifying named entities and temporal expressions in tweets, and will outline them in the following subsections. Linked Open Data (LOD) is used as a source of interlinked information about various types of entities such as persons, organizations, or locations. Additionally, we apply a different NER approach for extracting location mentions and finally, we adapted a framework for the identification of temporal expressions.
Named entity recognition and replacement using Linked Open Data
As a first approach, we use LOD as a source of interlinked information about entities to generate new features. For instance, different named entity mentions in social media texts are used synonymously to refer to the same entity, e.g., “NYC”, “New York City”, and “The Big Apple”. With simple text similarity measures, this relationship is not directly visible. However, as all mentions relate to the same URI in DBpedia, this background knowledge about an entity may be used as a feature. On a semantically more abstract level, the proper location mentions “Interstate-90” and “Interstate-495” can be abstracted to the common DBpedia type “dbpedia-owl:Road”. Both examples illustrate that semantic similarity between named entity mentions, or more precisely the relationship between entities, can be identified using LOD.
Listing 1 highlights two shared relations between our prior sample tweets. However, the extraction of this information is not easily achieved: First, named entity mentions have to be extracted. Second, they have to be mapped to the corresponding URIs, which makes disambiguation a necessity. Third, the valuable relations have to be identified and stored. We use DBpedia Spotlight [25] for the first two steps in this feature generation process. In Section 3.2, we show how features are generated based on these URIs.

Extracted DBpedia properties for two tweets showing semantic similarity.
Location mentions as another type of named entity can be valuable as additional features for text classification. Linked Open Data is less useful here, because location mentions are hard to extract with DBpedia Spotlight and URIs for these entities are often missing in DBpedia. We therefore focus on the different approach of extracting proper location mentions as well as common location mentions. We found that especially the latter ones are used rather frequently in incident-related tweets, e.g., the geospatial entities “lane”, “highway”, or “school”.
For instance, “I-90” is contained in the example tweet in Listing 1, which is a proper location mention. It also contains “right lane”, which is a common location mention. With our approach, we recognize these location mentions, including different named entities such as streets, highways, landmarks, or blocks. In the following approach, both common and proper location mentions are detected and replaced with the general annotation “LOC”.
For location mention extraction and replacement, we use the Stanford Named Entity Recognizer.2
Finally, we extract temporal expressions from tweets. For example, the tweet shown in Listing 1 contains the temporal expression “friday afternoon” that refers to the day when an accident occurred.
For identifying temporal expressions in tweets, we adapted the HeidelTime [43] framework. The HeidelTime framework mainly relies on regular expressions to detect temporal expressions in texts. As the system was developed for large text documents with formal English language, it is unable to detect some of the rather informal temporal expressions in the unstructured texts. Hence, as a first step, we use a dictionary for resolving commonly used abbreviations and slang (see Section 3). As a second step, we use an extension of the standard HeidelTime tagging functionality to detect temporal expressions such as dates and times. The detected expressions are then replaced with the two annotations “DATE” and “TIME”.
Generation of features and statistics of the data
In the following, we describe how our data were collected, preprocessed, and how the features were generated. To foster a better understanding of the data, we then analyze the differences between our datasets in terms of tokens and generated LOD features.
Data collection
We decided to focus on tweets as a suitable example for unstructured textual information shared in social media. Furthermore, we perform classification of incident-related tweets, as this type of event is highly relevant, common for all cities and not bound to a certain place. We focus both on a two-class classification problem, differentiating new tweets into “incident related” and “not incident related”, and a four-class classification problem, where new tweets can be assigned to the classes “crash”, “fire”, “shooting”, and a neutral class “not incident related”. We chose these classes because we identified them as the most common incident types in Seattle using the Seattle Real Time Fire Calls data set,3
As ground truth data, we collected several city-specific datasets using the Twitter Search API.4
Boston (USA)
Brisbane (AUS)
Chicago (USA)
Dublin (IRE)
London (UK)
Memphis (USA)
New York City (USA)
San Francisco (USA)
Seattle (USA)
Sydney (AUS)
We selected these cities as they have a huge geographical distance, which allows us to evaluate our approaches with respect to geographical variations. Also, for all cities, sufficiently many English tweets can be retrieved. We chose 15 km as radius to collect a representative data sample even from cities with large metropolitan areas. Despite the limitations of the Twitter Search API with respect to the number of geotagged tweets, we assume that our sample is, although by definition incomplete, highly relevant to our experiments.
We collected all available tweets during certain time periods, resulting in three initial sets of tweets:
As manual labeling is expensive and we needed high-quality labels for our evaluation, we had to select only a small subset of these tweets. In the selection process, we first identified and gathered incident-related keywords present in our tweets. This process is described in [39]. Following this, we filtered our datasets by means of these incident-related keywords. We then removed all redundant tweets and tweets with no textual content from the resulting sets. In the next step, more than 75k tweets were manually labeled by five annotators using the CrowdFlower5
The datasets are publicly available at
Class distributions for all cities and the two classification problems
Table 1 lists the detailed class distribution, and Figs 1 and 3 illustrate them in a bar chart. Overall, our datasets contain 42,808 manually labeled tweets. As the figures show, the distributions vary considerably, allowing us to evaluate our approach with typical city-specific samples. Also, the “crash” class seems to be the most prominent incident type, whereas “shootings” are less frequent. One reason for this is that “shootings” do not occur as frequently as other incidents. Another might be that people tend to report more about specific incident types and that there is not necessarily a correlation between the real-world incidents and the incidents mentioned in tweets.
For all datasets, the class where no incident happened is the largest one. This reflects the typical situation where usually no incident occurs and only in rare cases something happens. As the following tweet shows, a reason for this is the large proportion of tweets that contain incident-related keywords but that do not refer to an actual incident:
“I watched Air Crash Investigations on my flight from Vancouver to Toronto because apparently scaring yourself is fun.”
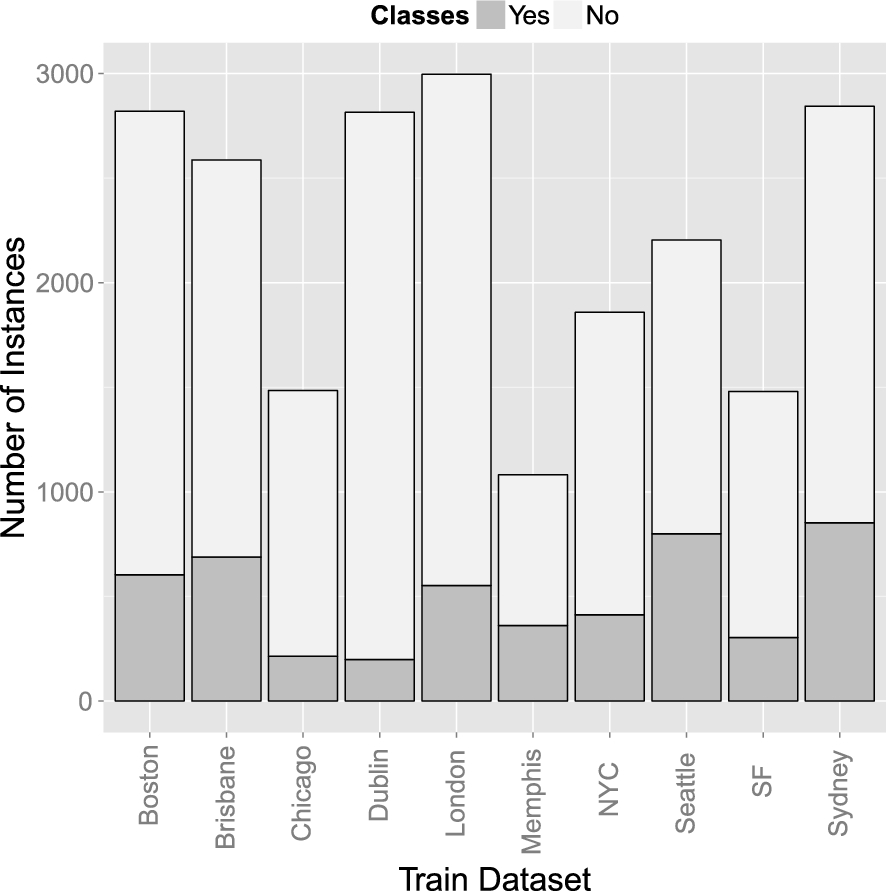
Barchart of the class distributions for all cities and the two-class classification problem.
To use our datasets for feature generation, i.e., for deriving different feature groups that are used for training a classification model, we had to convert the texts into a structured representation.7
Throughout this paper we will use feature as an individual property of an instance that helps training a classifier.

Semantic Abstraction (in dotted lines) and feature generation steps for training a classification model for incident type classification.
Preprocessing As a first step, the text was converted to Unicode as some tweets contain non-Unicode characters, which are not processable by some preprocessing frameworks. Second, commonly used abbreviations were identified by means of a custom-made dictionary based on the Internet Slang Dictionary & Translator.8

Barchart of the class distributions for all cities and the four-class classification problem.
Baseline approach After this preprocessing, we extracted several features from the tweets for training. The general pipeline consists of the following steps: First, we represented tweets as a set of words. In a preliminary evaluation we found that unigrams and bigrams showed the best performance compared to longer n-grams. As features, we used a vector with the frequency of each n-gram. Second, we calculated the TF-IDF scores for each token [24]. Third, we added syntactic features such as the number of exclamation marks, questions marks, and the number of upper case characters. In the following evaluation, we treat these features as the baseline approach.
Percentages of overlapping tokens for two-class datasets
The resulting feature set was then further enhanced with our three Semantic Abstraction approaches. The approaches were used for (1) replacing already present tokens with a more general token and of (2) introducing a set of additional features derived from background knowledge about the text at hand. In contrast to the baseline approach, these approaches were performed on the original tweet, not the preprocessed one, as identifying named entities on lemmatized text is not suitable.
Semantic Abstraction using Linked Open Data As a first approach, we applied Named Entity Recognition and Replacement using Linked Open Data. To conduct this, we used the RapidMiner Linked Open Data extension [28] (the LOD feature group). The extension proceeds by recognizing entities based on DBpedia Spotlight [25] to get likely URIs of the detected named entities. Then, these URIs are used to extract the types and categories of an entity. E.g., for the location mention “I-90”, a type would be dbpedia-owl:ArchitecturalStructure and a category category:Interstate_Highway_System. In contrast to previous works [28], we do not treat the extracted features as binary, but use them as numeric features for our evaluation, i.e., we count how often the same feature appears in a tweet. Though it is unlikely to find the same important tokens twice in only 140 characters, different tokens such as toponyms might refer to the same URI. Counting these occurrences can help in highlighting the importance of this URI.
Finally, for each tweet, the feature encodes the number of words with the same URI. A feature selection was not conducted at this point of time, as we only have a small number of features compared to the huge number of text features in the original dataset. Also, a further analysis of token distribution of geographical close regions is open for future work.
Semantic Abstraction using location mentions As a second approach, we used our location mention extraction approach and replaced location mentions in the unprocessed tweet texts. Based on this, the preprocessing was applied. Thus, location mentions were represented as TF-IDF features and as word n-grams. Furthermore, we counted the number of location mentions in a tweet. In combination, this results in a group of features for location mentions (+LOC feature group).
Top-N incident-related types and categories with frequencies in all two-class datasets
Notes: The Not IR column indicates if the same feature is also present in not incident-related tweets
Semantic Abstraction using temporal expressions Third, the same mechanism was applied to the temporal mentions, resulting in additional TF-IDF features, word-n-grams, as well as the number of temporal mentions in a tweet (+TIME feature group).
As we do not know which Semantic Abstraction approach performs best, we also provide the +ALL feature group in the following evaluations. This feature group is the combination of the +LOD, +LOC, and +TIME feature groups.
To foster a better understanding of the data, we analyzed the differences between our datasets in terms of tokens and generated LOD features.
Tokens One of the key questions that motivates our work is how much the used words vary in each city. We thus analyzed how similar all datasets are. Table 2 shows the percentages of overlapping unique tokens after preprocessing for the two-class datasets. The results indicate that after preprocessing, between 14% and 23% tokens are shared between the datasets. We do not assume that every unique token is a city-specific token, but the large number of tweets in our evaluations gives a first indication that there is a diversity that supports the initial hypothesis that using plain n-grams as features is not sufficient for the training of efficient models. Later on we will show that Semantic Abstraction indeed improves the training of high-quality models.
LOD features We also analyzed the twenty most representative LOD features for the classes in all datasets. For calculating the representativeness, we counted the number of LOD features of a specific Type and Category in all two-class datasets. In Table 3 the most representative Types and Categories for the two-class datasets are shown. The selected eighteen features have considerable higher frequencies compared to all other Types and Categories.
On the one hand, the results indicate that mostly types related to location mentions are relevant for incident-related tweets. On the other hand, for both Types and Categories a large number of features is representative for the incident-related and the not incident-related tweets. However, also very discriminative features such as the Types …yago/ Disease114070360 (915) and …yago/Accidents (851) as well as the Categories …/Category:Accidents (1405) and …/Category:Fire (828) are primarily present in incident-related tweets.
Consequently, we expect that these features will also be prominent in the models. We will pick this up in our later interpretation of the rule-based models from our experiments (cf. Section 4.3).
We observed the same effects for the four-class datasets. Some of the most representative features, i.e., features that are either present for incident-related or not incident-related tweets, are shared among all four classes. However, there are also very discriminative categories for all cases such as …/Category:Road_accidents (825) for the crash class, …/Category:Firefighting (203) for the fire class, and …/Category:Murder (69) for the shooting class. Also in this case, mostly types related to location mentions are present for all classes. This could be an indicator that features derived for location mentions are not discriminative for the three incident classes.
In this analysis of the datasets we showed that all datasets contain a large number of unique tokens, which underlines our hypothesis that Semantic Abstraction could be useful for training a generalized model. Furthermore, the analysis also showed that LOD features only partly differentiate classes, which could be a first indication that these might not work well. In the following, we conduct an evaluation of our approaches.
Evaluation
We evaluated our Semantic Abstraction approaches in two critical scenarios: In the first, training and testing was performed on data from the same city. In the second, testing was performed on datasets from different cities than the ones used for training. For each scenario, we investigated both the two- and four-class problem. We want to show that Semantic Abstraction improves performance independently of the classification algorithm, and therefore evaluated each approach with five different classifiers.
The first subsection describes the methodology common to all evaluated scenarios. The sampling procedure for each scenario is described in detail in individual subsections. This is followed by both a descriptive and inferential analysis of the performances.
Method
In the following, we describe which Semantic Abstraction approaches were evaluated on which performance measure, which classifiers we used, and which statistical tests we applied. For the statistical evaluation and reporting of results, we developed and used the Open Source framework STATSREP-ML [13].9
The framework is available at
Semantic Abstraction approaches We evaluated nine feature groups that emerge from the Semantic Abstraction approaches and their combinations. These feature groups extend a baseline and were described in Section 3.2. In the following sections, we reference the different combinations with their respective abbreviations: +ALL, +LOC, +TIME, +LOD, +LOC+TIME, +LOC+LOD, +TYPES, +TIME+LOD, and +CAT.
Classifiers In our experiments, we evaluated each feature group on a number of different classifiers. As each classifier needs to be trained several times (either in a cross validation or on data from different cities), we had to restrict their number to keep the experimental setup feasible. For training and testing, we relied on the learning algorithm implementations in the WEKA framework [14].
To ensure a fair selection, we decided to include some statistical methods such as an SVM (LibLinear) as well as symbolic ones. As often the decision trees and rule sets of tree and rule learners are quite different also in terms of performance, both types were included. Additionally, for later experiments (cf. Section 4.3), where the primary interest is what the learned models look like, it is important to have interpretable models that statistical methods are not providing.
NaiveBayes shows good performance in text classification tasks [32], which was the reason to include this algorithm. Also, the Random Forest algorithm was used as a representative of ensemble learners. We relied on the LibLinear implementation of an SVM because it has been shown that for a large number of features and a low number of instances, a linear kernel is comparable to a non-linear one [17]. Since for SVMs parameter tuning is inevitable, we evaluated the best settings for the slack variable c whenever an SVM was used. In total, we selected five classifiers, namely J48 [31], JRip [7], LibLinear [11], NaiveBayes [20], and Random Forest [4].
In summary, we have included five different classifiers that stem from the most prominent types of machine learning algorithms such as statistical or ensemble learning methods. In doing so, we want to highlight that the results of the proposed Semantic Abstraction are valid in general and do not depend on a certain type of learning algorithm.
Performance measure We used the F1-Measure for assessing performance, because it is well-established in text classification and allows one to measure the overall performance of the approaches with an emphasis on the individual classes [18]. In Section 3.3, we demonstrated that the proportion of data representing individual classes varies strongly. We therefore weighted the F1-Measure by this ratio and report the micro-averaged results.
Statistical tests Our goal was to determine differences in the effect of different feature groups, determined by the Semantic Abstraction approaches, on classification performance. Our performance values generally do not fulfil the assumptions of normality and sphericity required by parametric tests for comparing more than two groups. It was empirically shown that under the violation of these assumptions, non-parametric tests have more power and are less prone to outliers [10]. We therefore relied exclusively on the non-parametric tests suggested in literature: Friedman’s test [12,18] was used as a non-parametric alternative to a repeated-measures one-way ANOVA, and Nemenyi’s test [18,27] was used post-hoc as a replacement for Tukey’s test. Although it is conservative and has relatively little power, we prefer Nemenyi’s test over alternatives (cf. [15]) because it is widely accepted in the machine learning community. When comparing only two groups, the Wilcoxon Signed Rank test [18,46] was used.
Unfortunately, the Friedman and Nemenyi tests only accept a single independent variable. We therefore compared the performance of individual classifiers using different feature groups, but had to average the classifier performance over the different classification algorithms to eliminate one variable. This counteracts our goal to show universal performance improvements due to Semantic Abstraction, because the information about the individual classifier performance is lost in aggregation. To support our findings, we therefore also performed tests on the F1-Measure values of the individual classifiers.
For our analysis, the feature groups used thus represent the independent variable that affects (aggregated) model performance. P-values in tables will be annotated if they are significant. While * indicates low significance (
In this experiment, we assessed the impact of different Semantic Abstraction approaches on the performance of classifiers that are both trained and tested on data from the same city. We therefore evaluated if Semantic Abstraction can support classification even if variation in tokens is low.
We performed a 10-fold cross-validation on the 20 datasets from Boston, Brisbane, Chicago, Dublin, London, Memphis, NYC, San Francisco, Seattle, and Sydney. We used stratification to ensure an equal distribution of the different classes in each fold [18]. The cross-validation was performed for every feature group and classifier algorithm, resulting in 500 raw F1-Measure values.10
500 raw values = 10 feature groups × 5 classifiers × 10 folds
Descriptive statistics for the aggregated F1-Measurfold cross-validation with two classes
Figure 6 in the appendix shows a Box-Whisker diagram of the sample distributions for the two-class problem. We also retrieved the minimum and maximum performance per sample set, as well as the median and interquartile range (IQR) as non-parametric measures for the average value and dispersion. These descriptive statistics are listed in Table 4. Similarly, Fig. 7 in the appendix and Table 5 describe the sample distributions for the four class case.
For the two-class problem, the average performance varies only slightly for different feature groups, as does the persistently low dispersion. The average performance values are not much different for the four class problem, but their dispersion is a little higher. We performed a Friedman test on both sample sets. The p-values indicate weak significant differences between the performance values of the feature groups for both the two-class (
Although we mainly reported the results for the aggregated performance, we will add a few results from the tests for individual classifiers to support the discussion. A comparison of the baseline results with the +ALL feature group using the Wilcoxon Signed-Rank test showed medium and strong significant differences in performance for the two-class case and JRip (
Descriptive statistics for the aggregated F1-Measurfold cross validation with four classes
Discussion We did not discover any significant differences in the case of the 10-fold cross validation on a single dataset, as was suggested by the descriptive statistics. Nevertheless, the low power of the Nemenyi test and the fact that ordinary k-fold cross validations fosters type-I error inflation [10] might have complicated this investigation additionally. The results for the two-class case indicate that Semantic Abstraction is mostly not beneficial compared to the well-performing baseline. However, using the +LOC+TIME feature group shows a small increase for most cases. Using the +ALL feature group is only beneficial for the Memphis and Seattle datasets. The results for the four-class case are similar to the effects shown in the two-class case; the increase in performance whenever Semantic Abstraction is used is negligible. Solely, the +LOC feature group provides increases of up to 1% in F1-Measure.
Though Semantic Abstraction did not show as valuable when evaluating aggregated performance from training and testing on data from one city, we found that specific classifiers with the +ALL feature group significantly outperformed the equivalents that only used the baseline features. Surprisingly, +LOD as the combination of the +TYPES and +CAT approaches provides significantly better results than the baseline approach. It is likely that the combination of approaches helped here in selecting more appropriate features for the classification problem. These individual comparisons show that although Semantic Abstraction does not increase general classification performance, it can be valuable for specific classifiers whenever they are trained and tested on data from the same city.
In the second experiment, we trained and tested our feature groups on datasets from different cities in order to see how Semantic Abstraction is able to contribute to classification performance if the tokens in the data vary strongly. We sampled performance by means of a holdout strategy, i.e., one dataset was picked for training and the remaining nine datasets were used for testing. This was repeated ten times until all datasets were used once for testing, resulting in 4500 raw11
4500 raw values = 10 feature groups × 5 classifiers × 9 testing datasets × 10 datasets
The descriptive statistics for the two-class problem are listed in Table 6, and the sample distribution is illustrated in the Box-Whisker diagram in Fig. 8 in the appendix. The average performance is consistently lower than in the previous scenario, and the dispersion is considerably higher. Additionally, there are larger differences between the performances. A Friedman test showed that these differences are highly significant (
We illustrated the ranks and significant differences between the feature groups by means of the critical distance (CD) diagram in Fig. 4. Introduced by Demsar [10], this diagram lists the feature groups ordered by their rank, where lower rank numbers indicate higher performance. Two feature groups are connected if they are not significantly different. The CD diagram shows that +ALL, +TIME+LOD, +LOC, +LOC+TIME, and +LOC+LOD do not differ significantly. However, as shown by the Nemenyi test, these approaches differ significantly from the baseline approach, i.e., provide better performance. No statistical difference could be found for the +TIME, +TYPES, and +CAT approaches, which do not statistically outperform the baseline. +LOD as the combination of the +TYPES and +CAT approaches provides significantly better results than the baseline approach.
Descriptive statistics for the aggregated performance from holdout sampling with two classes
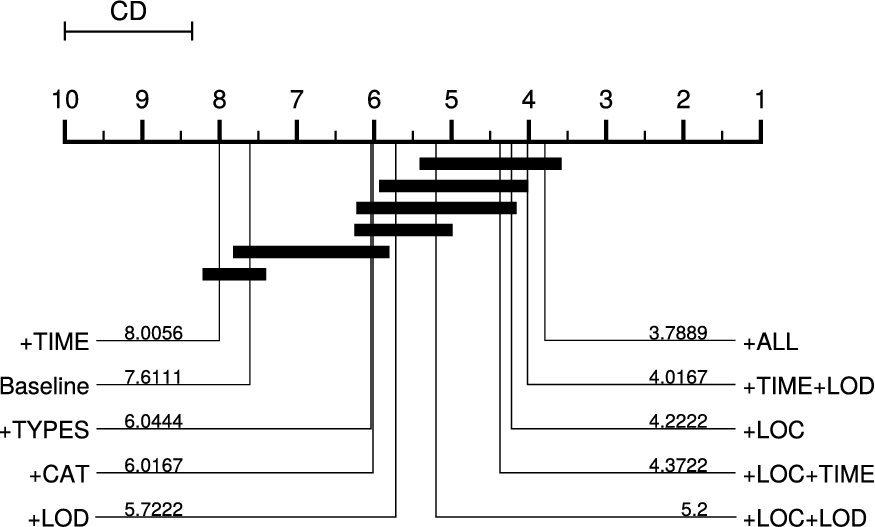
Critical distance (CD) diagram showing a comparison of all feature groups against each other based on the holdout sampling with two classes. Feature groups that are not significantly different at
Descriptive statistics for the aggregated performance from holdout sampling with four classes
Table 7 shows the descriptive statistics for the four-class problem, and Fig. 9 in the appendix illustrates the sample distributions. The average performance is in many cases lower than for the two-class problem, and the dispersion is a bit higher for most feature groups. The Friedman test again shows strong significant differences between the performances of the feature groups (

Critical distance (CD) diagram showing a comparison of all feature groups against each other based on the holdout sampling with four classes. Feature groups that are not significantly different at
As in the first experiment, we want to support these findings with comparisons of the baseline against the +ALL feature group for individual classifiers. For the 2-class problem, the Wilcoxon Signed-Rank test indicated medium and strong significant differences for all classifiers, in detail for J48 (
Discussion The results support our hypothesis that Semantic Abstraction can contribute significantly to classification performance when training and testing is not performed on data from the same city.
As we wanted to get a better understanding of the effects caused by Semantic Abstraction, we investigated two crucial questions regarding the properties of the different datasets:
How well does a model that was trained on datasets of other cities perform on the dataset of the city at hand?
What makes a good training set, i.e., how well does the dataset of a particular city at hand serve as a training set to build a classifier for datasets from other cities?
For answering these questions, we investigated the individual classification performance for datasets from each city. Also, to backup our findings, we examined the rules learned by the JRip rule learner in more detail. The effects of Semantic Abstraction on the models can best be grasped by considering the rule sets with a focus on the semantic features +LOC, +TIME, and +LOD.
Two-class problem: F1-Measure for training on one city (header) using the +ALL feature group and testing on a different city (first column)
Highlighted: The datasets that were best (
Four-class problem: F1-Measure for training on one city (header) using the +ALL feature group and testing on a different city (first column)
Highlighted: The datasets that were best (
Individual classification performance We first examine the average F1-Measure for datasets from each city in more detail. Table 8 concerns the two-class problem and lists the performance values for each city with the +ALL feature group applied. Table 9 shows the results for the four-class case. We selected the +ALL model as it showed the best performance (cf. Figs 4 and 5). In the two-class problem, the datasets for the two cities Dublin and Chicago (depicted in bold in Table 8 at the left hand side) have shown the best classification performance (about 2–3% F1-Measure less than the single-city model). However, the datasets for Seattle and Sydney performed poorly with up to 15% less. As we show, the reason for the good performance of the Dublin and Chicago datasets is strongly related to the class distribution. For the Dublin dataset, the baseline F1-Measure is the highest while the Chicago dataset ranks at the second place.12
The baseline F1-Measure is computed by utilizing a classifier that predicts the majority class, i.e., the class with the most tweets, for all instances.
To support this observation, we computed the Spearman Rank Correlation [23] between two rankings: first, we calculated the differences in F1-Measure between the cross validation result using the baseline approach, i.e., the baseline single-city model, and the average of all train/test splits using the +ALL approach. The training datasets were then ranked according to the differences. Second, we determined the majority class of each dataset to have a representation of the actual class distribution and also ranked the datasets accordingly.
The analysis of the rankings using Spearman’s rho for the two-class problem indicates that the ranking of the differences and the majority classes are significantly positively correlated (
Interestingly, the situation appears to be similar when four classes have to be predicted (cf. Table 9t works best with only 3% less F1-Measure but the Chicago dataset was ranked third as the Memphis dataset showed to be very well classified. The Seattle dataset performed worst with a crude 34% lower F1-Measure, followed by the Sydney dataset as in the two-class problem (both shown in italics in Table 8). The analysis of these rho indicates that the ranking of the differences and the majority classes are strong significantly positively correlated (
Thus, datasets of cities with a skewed class distribution, i.e., with a larger majority class, can better be classified compared to more equally distributed classes. This holds true for both the two-class problem and the four-class one. However, for the latter the distribution is even more important as the dataset with the worst performance showed a 33% performance drop compared to the model learned just using data of that city.
Quality of training set In the following, we cope with the second question, i.e., which datasets serve well to create a training set on. Answering this question could contribute to a better selection of cities to train models for other cities on. Also, the models themselves are of interest as on the one hand the improvement Semantic Abstraction brings can be implicitly shown and on the other hand valuable features for the classifier can be identified. For this investigation it is crucial to understand the models that have been trained, thus, we rely on the rules learned by the JRip algorithm and proceed with a similar procedure as in [19]. Please note that different feature groups might be used for different classifiers.
For the two-class classification problem, the two datasets for Boston and Seattle yielded the highest performance with about 85% and 84% (depicted in bold in the header of Table 8 and Dublin showed the worst results with only about 76% and 80%. Dublin and Chicago were best to classify (cf. Table 9) but now are worst to learn a model from. This emphasizes the importance of an appropriate class distribution and at least partly confirms prior findings that more equally distributed classes often yield more robust classifiers [44,45]. Not surprisingly, the rules learned on data from these two cities with skewed class distributions also showed to be suboptimal.
For instance, the first rule learned on the dataset of Dublin (cf. Rule 1) tests for the category accidents and for the music genre, which clearly is a bad choice.
Another rule tests for the category trucks combined with a check for the presence of a URL (cf. Rule 2. The first condition might be plausible for the dataset at hand, but in general trucks are not involved more often in incidents than other vehicles.13
Table 1107 of census data from 2009 shows that actually a lot less trucks were involved in crashes compared to cars or other vehicles, cf.
In Chicago, the first rule checks for the category accidents which seems to be a good choice (the rule covers 82 positives and 28 negatives, cf. Rule 3). But already the third rule tests if the word “woman” is present, which is not a good indicator for an incident related tweet (see Rule 4). Despite, it covers 22 positive examples and 5 negative ones which means that the rule works well in Chicago. Nevertheless, in other cities, “women” are usually not directly related to incidents.
The other way around, the rules for the datasets of Boston and Seattle show good generalization capabilities. For example, the first rule for the Boston dataset checks the category accidents and if at least six letters are upper case (cf. Rule 5). Usually, upper case letters are an indicator that people want to emphasize the content of a tweet, e.g., during incidents.
The second one tests for the word “fire” in addition to the +LOD feature “city” (Rule 6) and the third rule simply considers the word “accident” (Rule 7). In the Seattle dataset, the first six rules all contain abstracted location mentions in their body in conjunction with different other features. The first one additionally checks for the word “lane”, the second the TF-IDF of the word “unit” (i.e., a specific police squad) and the third the TF-IDF for “crash”. All of these rules appear to be also universally valid.
For the four-class problem, the datasets of Boston and Sydney worked best to train a model on while the datasets of Dublin and Memphis performed worst when used for training. Again, these two showed the best performance in classification. About 30% of the rules for the Boston dataset had +LOD features in their body where some were plausible (such as category:Security (class “shooting”), category:Fire (class “fire”), category:Accidents for the class “crash”) but, however, there were also some rather unintuitive ones such as specific geographic places or Early_ American_Industrial_Centers (class “fire”). In the Sydney dataset, more exotic categories like Wildland_Fire_Suppression or Former_Member_States_Of_The_United_Nations are present for the class “fire”. However, also here some rather unintuitive features were included in the rules.
In summary, the class distribution to a high extent affects the quality of the models. This is not only reflected by the correlation between the difference of the models of datasets from other cities to that induced on datasets of the same city, but also by the inspected rule sets. Here, we showed that in many cases the rules found on datasets of the cities that are better suited to train a classifier on are also more intuitive than those of the cities where no high-quality model could be learned. Also, we showed that Semantic Abstraction indeed is valuable to build high-quality models as most often the novel semantically abstracted features were used in the rules.
In the domain of machine learning, there already exists related work covering the use of external knowledge sources as well as information about named entities [16,28]. In this section, we will describe the methods related to our Semantic Abstraction approach in more detail. However, our approach is also related to the field of domain adaptation, which is discussed afterwards. Finally, we present related approaches in the domain of incident type classification.
Saif et al. [35] showed that adding the semantic concept for a named entity is valuable for sentiment analysis on tweets. The authors used the concept tagging component of the AlchemyAPI to extract one concept for each named entity in a tweet, and then used it as a feature. For instance, the concept “President” is derived from “Barack Obama”. This approach works well for very large datasets with a multitude of topics, but not on small datasets. Compared to their work, our approach makes use of multiple types and categories extracted for a named entity, providing us with a much richer set of background information.
Cano et al. [5] proposed a framework for topic classification, which uses Linked Data for extracting semantic features. They compared the approach to a baseline comprising TF-IDF scores for word-unigrams, concepts extracted using the OpenCalais API,14
Domain adaptation [9] also is related to our approach. However, where in domain adaptation the domains are to a large extent different, in our setting the domain, i.e., incident type classification of tweets, remains the same, but the input data is subject to change. This means, that certain features, i.e., tokens, are changing from city to city. Therefore, feature augmentation [8] is related to our approach. However, where domain-specific features are simply discarded in regular feature augmentation, our method abstracts them in advance and then they are used in union with domain-independent features. Another way of adapting domains is structural correspondence learning [3] where shared features are identified, augmented and used to build classifiers that are applicable in both domains. The main difference is that the shared features that are then used have to be present. However, we instead create these shared features based on existing ones by the proposed Semantic Abstraction methods.
Several prior work focused on the classification of incident-related user-generated content. The works of [6,21,30,36] were designed for incident type classification. However, the models were trained on traditional features such as word-n-grams. Also, Twitter-specific features such as hashtags and @-mentions have been used. In contrast to these approaches, several works tried to incorporate information about named entities present in tweets, which is somehow related to our Semantic Abstraction approach. Agarwal et al. [1] proposed an approach for classifying tweets related to a fire in a factory. As features, they use the number of occurrences of certain named entities such as locations, organizations, or persons that are extracted using the Stanford NER toolkit. Furthermore, the occurrence of numbers and URLs is used as a feature. Also, word occurrences remaining after stopword filtering are used. Similarly, Li et al. [22] built a classifier using text features and Twitter-specific features, such as hashtags, @-mentions, URLs, and the number of spatial and temporal mentions for incident type classification. Nevertheless, the authors do not specifically try to generalize the tokens at hand, but only introduce a set of features based on identified named entities. In [42] clusters were built in order to identify huge forest fires. However, the found clusters had to be inspected manually and no supervised learning method was used. In summary, none of the prior works focus on datasets of different cities as we did in our evaluation.
In this paper, we introduced Semantic Abstraction to foster the generalization of classification models in the domain of social media text classification. Using Twitter data collected from ten different cities, we were able to show that our approach is indeed very useful, especially in the domain of incident type classification.
We first demonstrated that Semantic Abstraction can also improve the classification of datasets derived from only one city. Nevertheless, we also found that Semantic Abstraction is most valuable when training and testing is done on datasets from different cities, i.e., with a diverse range of tokens. Furthermore, we discovered that the success of our approach in this scenario depends on the choice of the classifier. We noticed that not all feature groups and abstracted features contribute to a high-quality model. Especially features derived using the temporal expression recognition approach and features based on LOD seem to need further rework. Finally, an in-depth analysis of the train/test case showed that the class distribution affects the quality of the models to a high extent. This is an important finding, as it might help to create datasets that generalize better.
Nevertheless, training such a generalizing classification model is highly desirable for several reasons. For instance, generalizing models only have to be trained once, and can therefore help decreasing time and costs of training data labeling. Furthermore, they can help to ensure high classification rates even in areas where only few training samples are available. Finally, in times of increasing growth of cities and the merging with surrounding towns to large metropolitan areas, they allow to cope with the latent transitions in token use.
The applicability of Semantic Abstraction for a real-world use case has also been shown in our prior work [40]. In that paper, we proposed an approach for small-scale incident detection based on spatial-temporal-type clustering. We employed Semantic Abstract and extracted generalized features to increase robustness a classification model that identifies incident-related tweets.
For future work, a first goal is to experiment with feature selection on the LOD features. Because preliminary experiments using the information gain did not indicate better results [37], more sophisticated approaches such as the one presented by Ristoski and Paulheim [33] will be needed. A second goal is to include additional approaches for Semantic Abstraction such as the concept of level abstraction used by Saif et al. [35]. We also plan to intensify our analysis of the LOD features. For instance, we pointed out the relation between location mentions and incident-related tweets, which is also visible in form of LOD features. However, currently we lack appropriate instruments to make use of this information.
Also, a more diverse set of Linked Data sources might contribute to our approach. However, as our NER approach is based on DBpedia Spotlight, it might be difficult to relate named entities to the corresponding URIs of other sources. A solution might be a brute force approach as proposed by [29], that creates and matches URI patterns based on the named entity mentions. Furthermore, SPARQL endpoints or REST APIs might also be used for efficient retrieval of URIs. Nevertheless, in all of these cases, one needs to take care of the disambiguation steps.
Additionally, also non-LOD sources could improve Semantic Abstraction. Spatial data as we used in our previous work [38] might provide additional information about locations. Furthermore, company or governmental data, including domain-specific information, could also be used as additional features.
In a future analysis, we plan to investigate the relation between specific tokens and the Semantic Abstraction in more detail for individual cities. The goal is to identify which approach works best given a certain type of token. Also, in order to increase the general validity of our results, we plan to include more classifiers in the experiments.