
Abstract
PURPOSE:
Obesity prevalence and the relationship between obesity and motor function in children with ambulatory cerebral palsy (CP) were investigated.
METHODS:
This was a cross-sectional study. The obesity profile of 75 children aged 2–18 years with ambulatory CP was investigated. GMFCS levels were recorded, and BMI was calculated using height and weight data and converted into Z-scores. Age- and gender-specific growth charts were used for children and adolescents.
RESULTS:
The mean BMI of the participants was 17.78, with an obesity rate of 18.67% and an overweight rate of 16%. Gross motor function was found to be associated with height, weight, and BMI (p < 0.05). No relationship was found between obesity + overweight and gender and CP subtype (p > 0.05).
CONCLUSION:
Turkish children with CP had a higher rate of obesity compared to typically developing peers and also their counterparts in other countries. There is a need for studies to identify the causes of obesity and to develop effective intervention programs for prevention of it in children with CP.
Introduction
Childhood obesity has become a major public health concern with an increasing prevalence. Childhood overweight and obesity are associated with a wide range of problems, such as cardiovascular diseases, diabetes, musculoskeletal problems, mental issues, impaired social and emotional well-being, and school failure [1, 2].
The epidemic of childhood obesity may be an even more severe problem in disabilities in which limitations in movement and participation are frequently seen [3, 4]. Cerebral palsy (CP) is the most common disability of childhood and describes a group of permanent disorders of the development of movement and posture that cause activity limitations [5]. Children with CP are known to be less physically active than their peers [6]. As well as motor problems that cause limitations in their physical activities, children with CP are also affected by various personal and environmental factors and barriers that contribute to difficulty with movement [5]. All these factors lead to an increased risk of obesity in children with CP.
To date, few studies have investigated the prevalence of overweight and obesity in ambulatory children with CP, revealing conflicting results [7–9]. Obesity prevalence varies widely from country to country. Although over time, studies have emerged in recent literature, there is no baseline data on obesity in children with CP in Turkey.
In the current study, the prevalence of obesity and the relationship between obesity and motor function in children with ambulatory CP presenting to the pediatric rehabilitation outpatient clinic was investigated.
Materials and methods
Participants
This was a cross-sectional study in which the obesity profile of 75 children with ambulatory CP aged 2–18 years who were followed at a tertiary rehabilitation clinic was investigated.
Inclusion criteria were as follows: children (i) having a diagnosis of CP, (ii) aged between 2–18 years, (iii) classified as GMFCS (Gross Motor Function Classification System) Level I to III.
Ethics approval was obtained from the Ethics Committee. All caregivers signed written informed consent.
Data collection
For all children, demographic information (gender, age) and CP subtype were recorded, and a detailed physical examination was performed.
The functional status was evaluated with the GMFCS, which was developed by Palisano et al. in 1997 and expanded in 2007 to classify gross motor functions of children with CP. It is a standardized method that categorizes gross motor skills in 5 levels, with particular emphasis on differences in sitting and walking in children with CP. Level I walks without restrictions, Level II walks with restrictions, Level III walks using hand-held mobility devices, Level IV independent self-movement is restricted and can use motorized mobility vehicle, and Level V is transported in a hand-pushed wheelchair [10, 11].
Children were weighed on an electronic scale that is calibrated daily, and height was measured using a stadiometer in a vertical upright position, feet parallel to the shoulders and heels touching the wall. Height and body weight were measured twice by the investigator, and average values were recorded. The same equipment was used for all patients. BMI was calculated using height and weight data and converted into Z scores. Growth charts were used for children and adolescents between the ages of 2–20, depending on the child’s age and gender. In this study, the percentile curves created by Neyzi et al. for Turkish children were used primarily, and the percentile values established by the WHO (https://www.who.int/toolkits/child-growth-standards/standards/body-mass-index-for-age-bmi-for-age) and US CDC BMI growth standards (for CP) (https://www.LifeExpectancy.org/Articles/NewGrowthCharts.shtml) were also recorded and compared [12, 13].
Obesity was defined as a BMI≥the 95th percentile on the gender-specific BMI-for-age growth charts. Being overweight was defined as a BMI above the 85th percentile and below the 95th percentile according to the gender-specific BMI-for-age growth charts. Being underweight was defined as a BMI <10th percentile [14].
Statistical analysis
Statistical analysis was conducted using the Statistical Package for the Social Sciences, version 22.0 (IBM Corp., Armonk, NY). Demographic and clinical data were compared using descriptive statistics, which were summarized as mean±standard deviation (minimum-maximum) values and median values for continuous variables and frequency values (number of cases) and percentages for categorical variables. For categorical variables, whether there was a significant difference between the groups was checked using the chi-square test when assumptions were met and by Fisher’s exact test when assumptions were violated. Differences between the two groups for continuous variables were analyzed using non-parametric Mann-Whitney U test. Logistic regression analysis was utilized to compare variables to the dependent variable of BMI. The model included covariates of age, gender, CP subtypes, and GMFCS levels. The main dependent variable BMI was dichotomized, y1: obesity or not, y2: obesity or overweight or not. CP type has been recorded as two dummy variables: (1) “Spastic hemiplegic” vs. others, (2) “Spastic diplegic” vs. others. Results were evaluated using the two-tailed test, with statistical significance set at p < 0.05 and p < 0.01 at 95% confidence interval.
Results
Seventy-five children with CP were included in the study. Descriptive statistics of the participants are presented in Table 1.
Descriptive statistics of patient characteristics (n = 75)
Descriptive statistics of patient characteristics (n = 75)
CP: cerebral palsy. GMFCS: Gross Motor Function Classification System.
The distribution of BMI is shown in Fig. 1, and distribution of BMI by age and GMFCS levels is shown in Figs. 23.
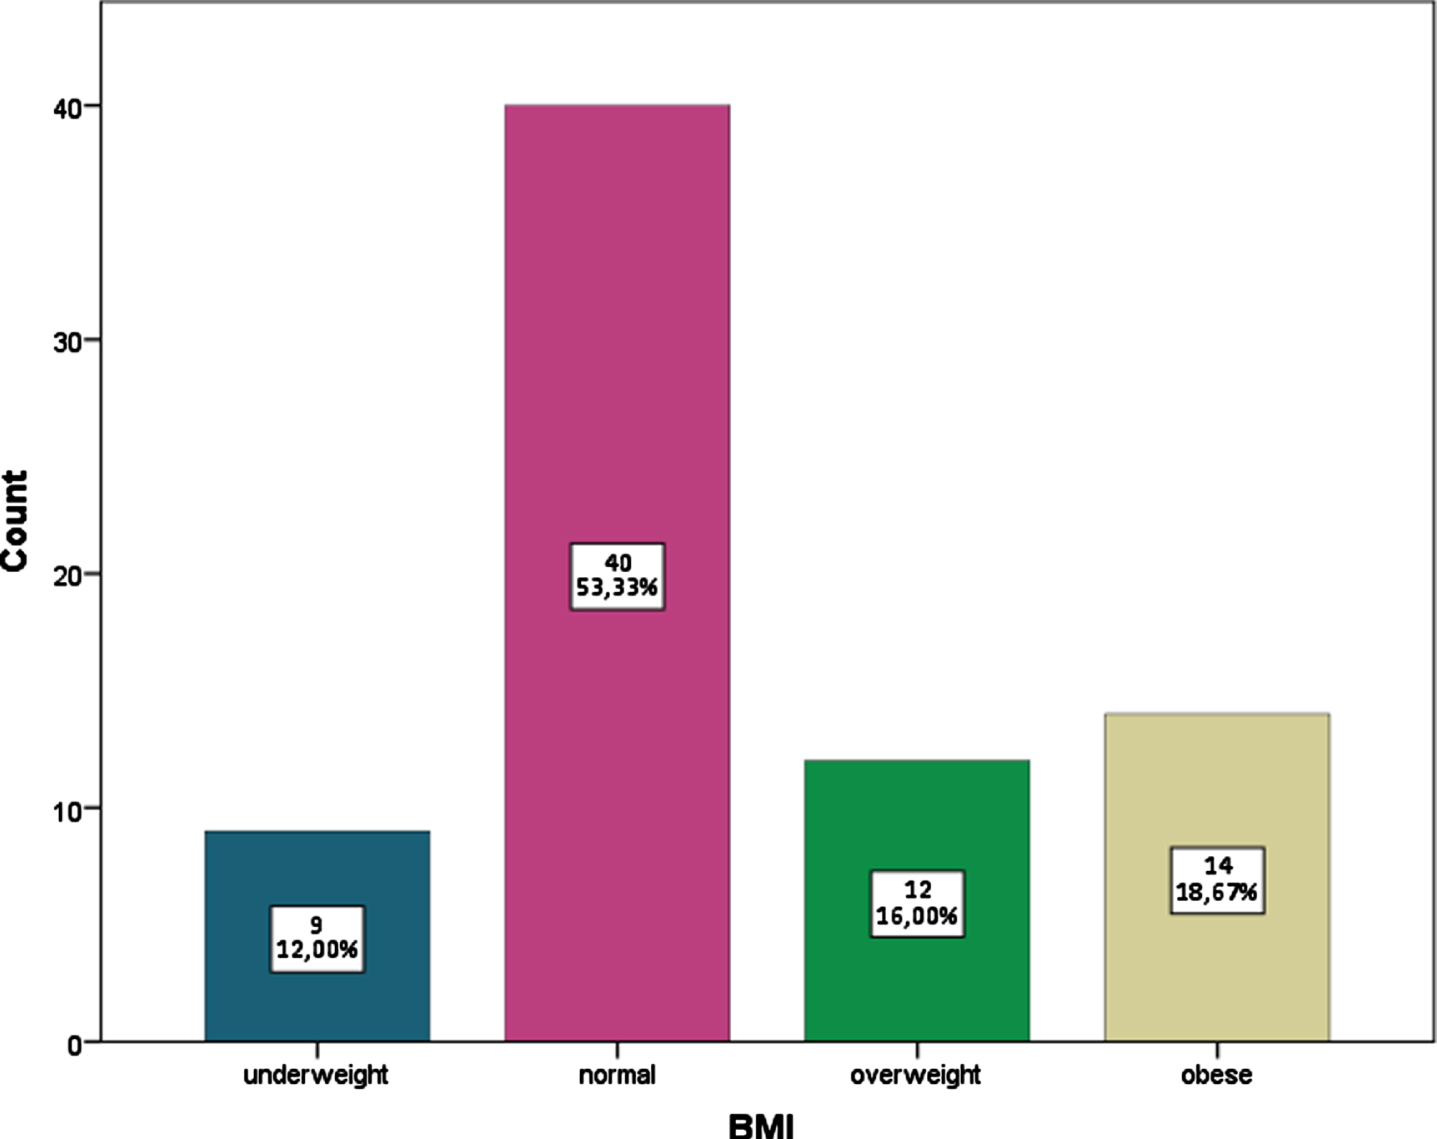
Distribution of BMI.
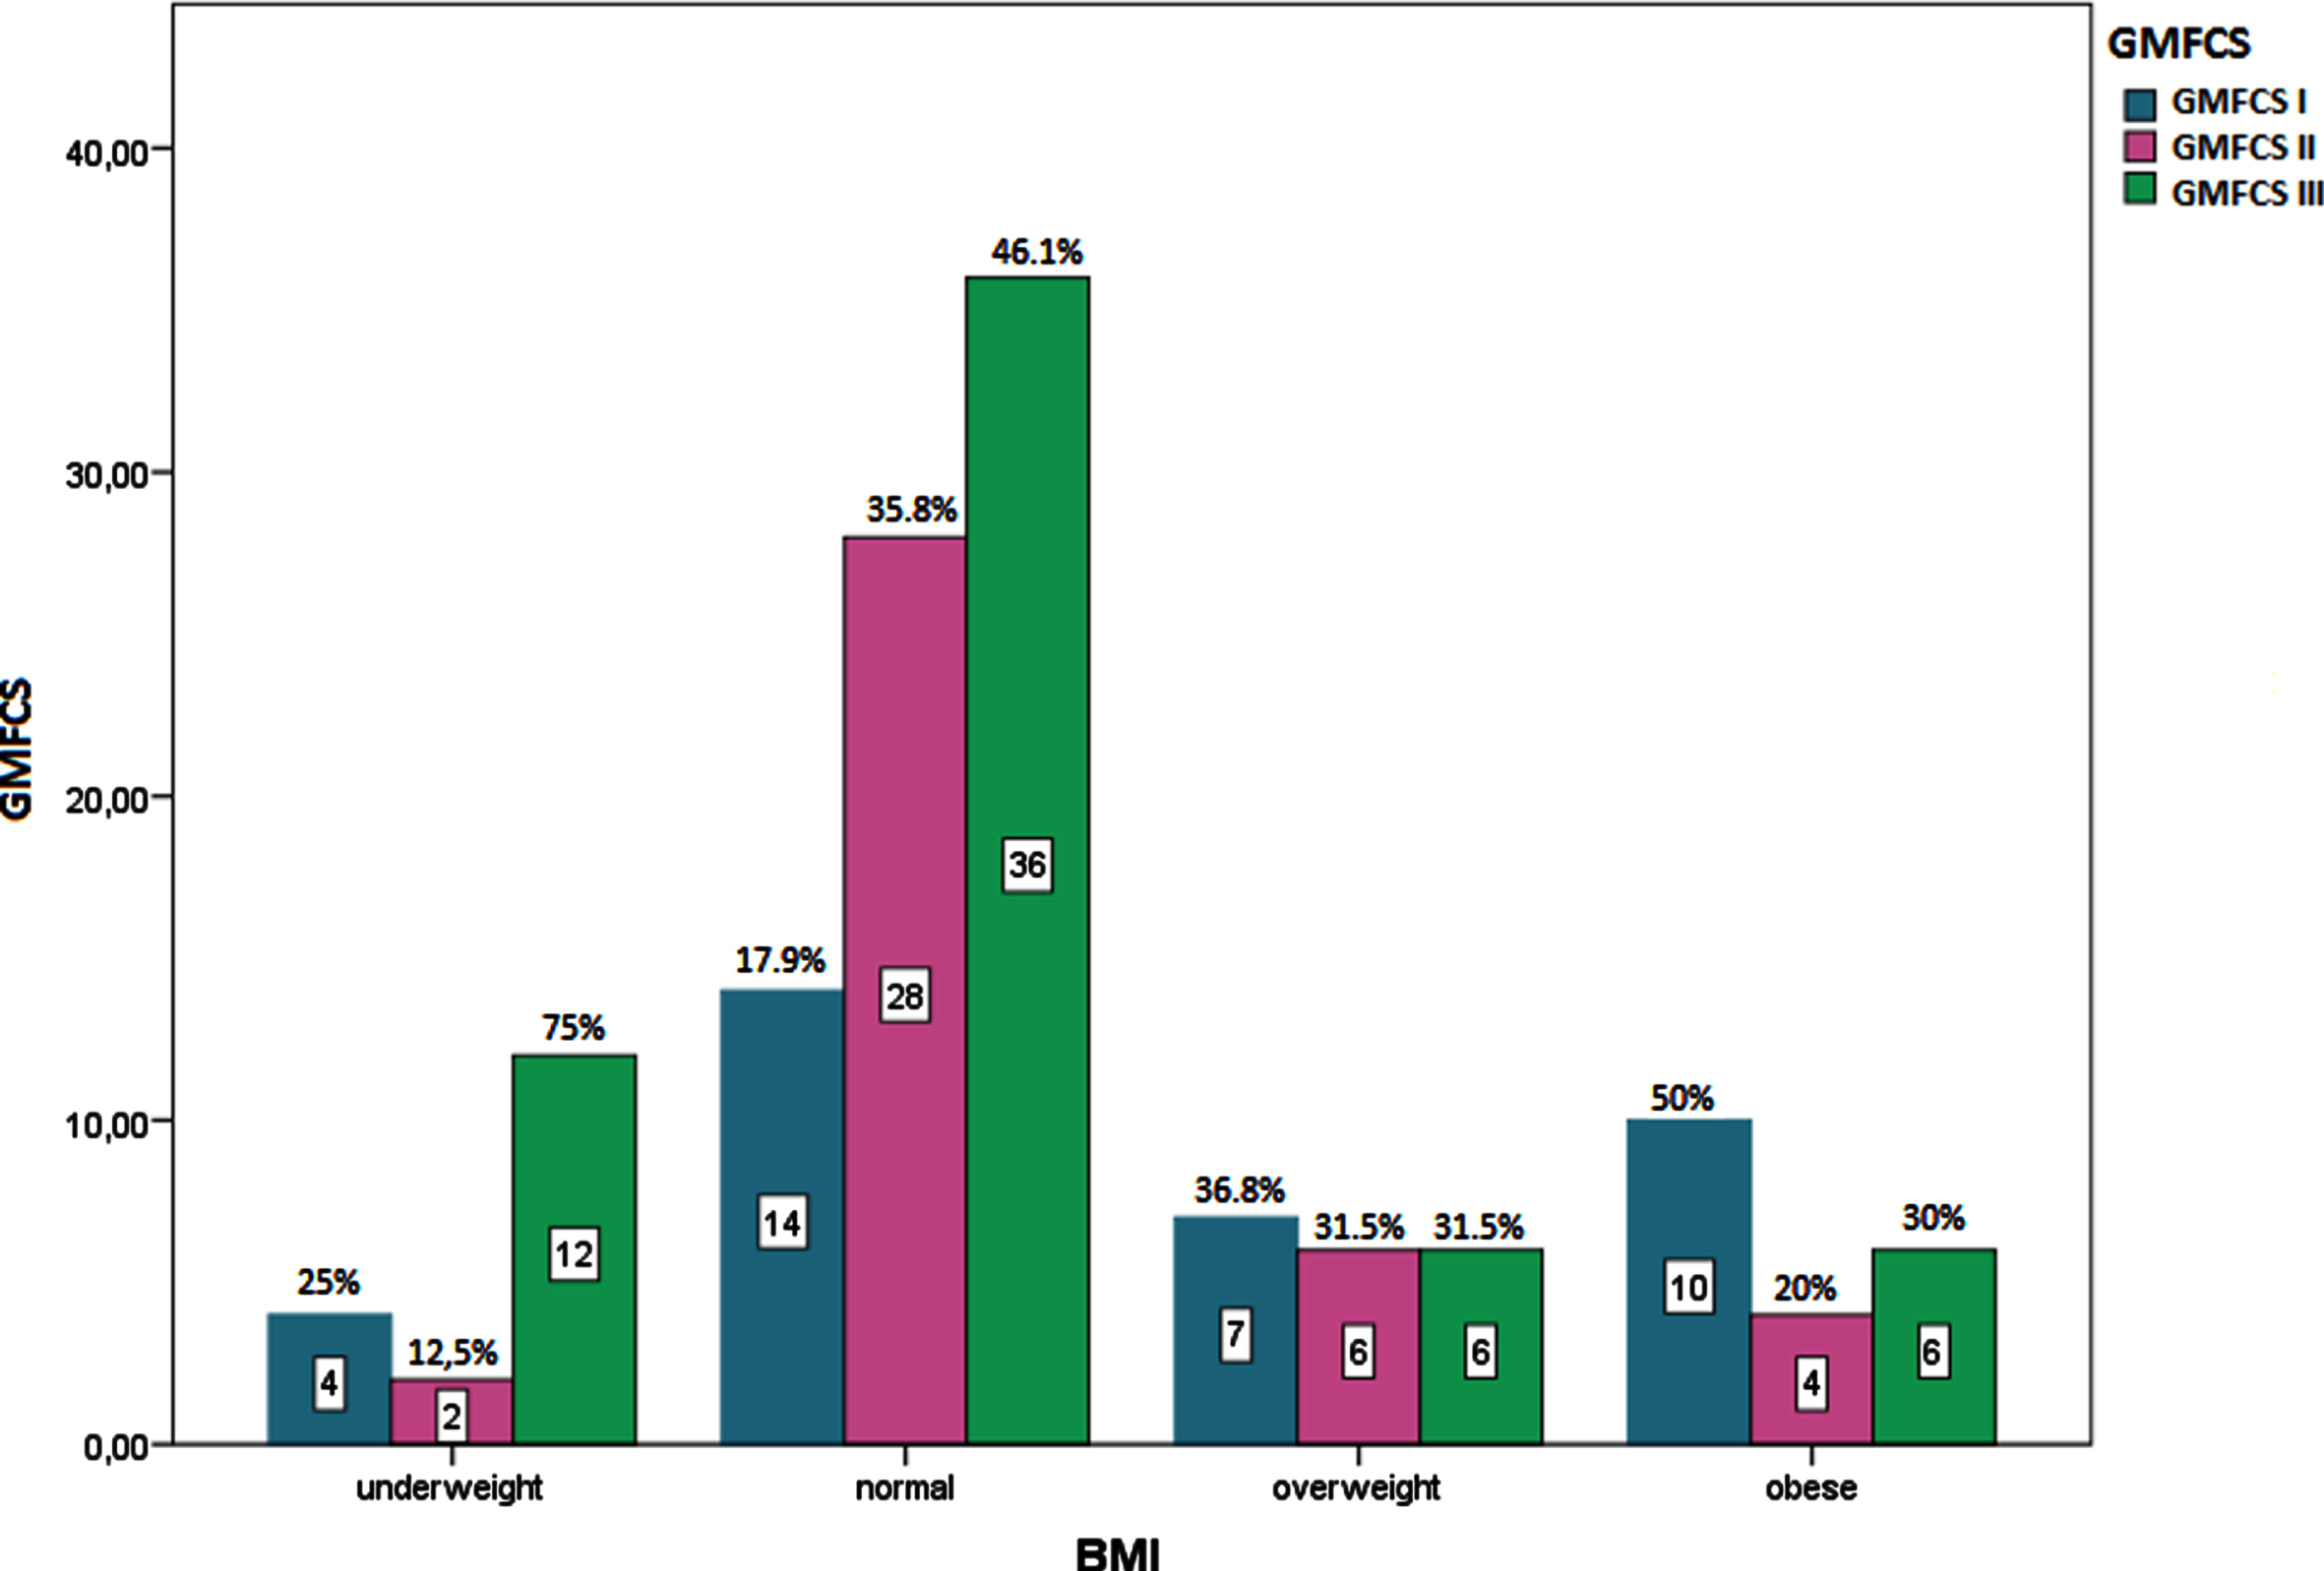
Distribution of BMI by GMFCS level.
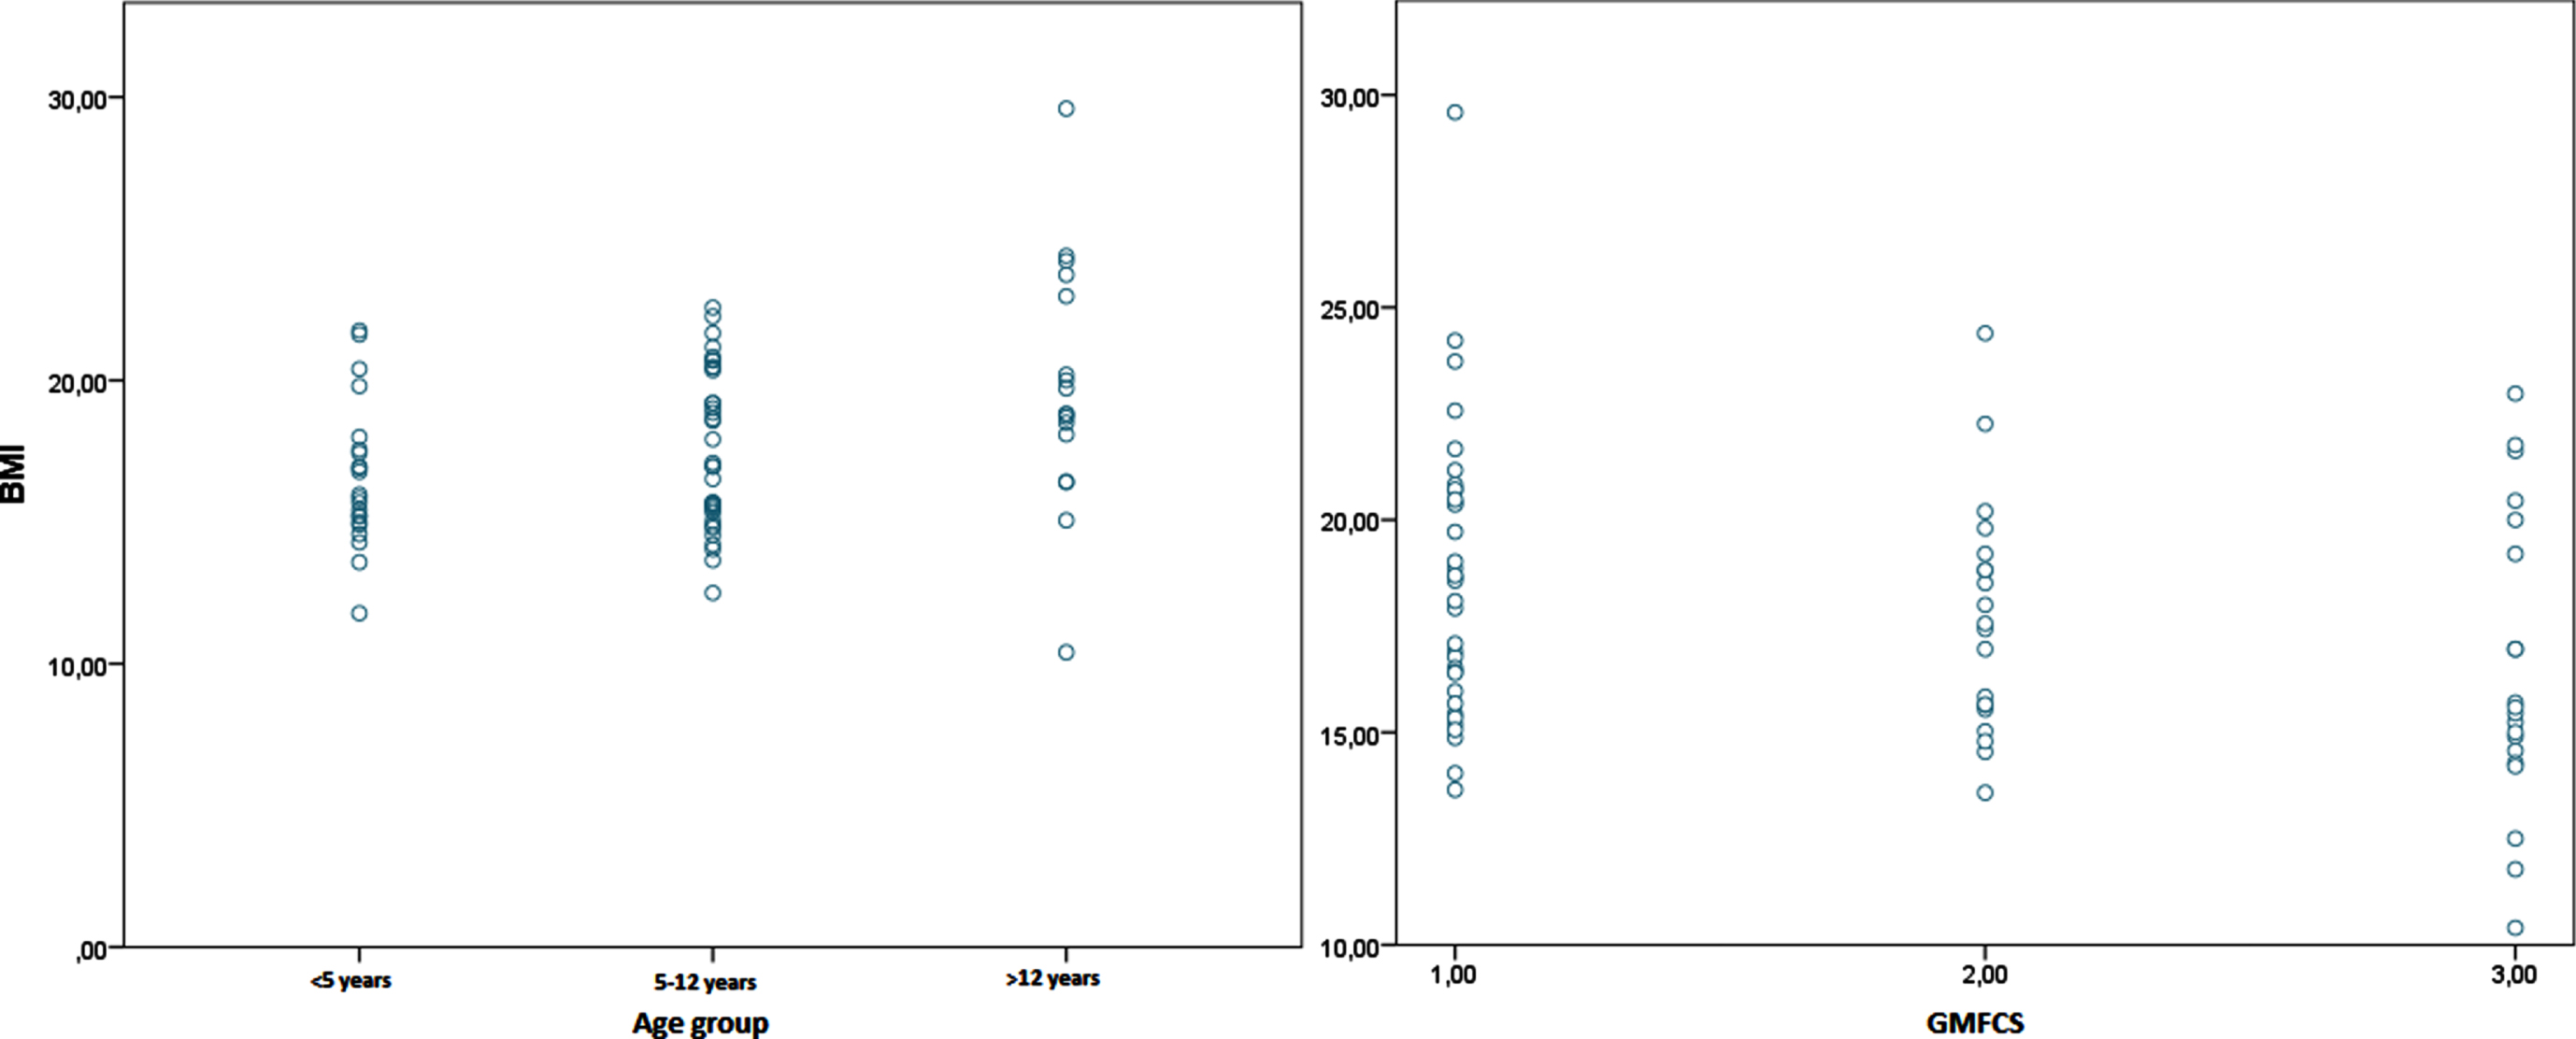
Scatter plot diagram of BMI by age groups and GMFCS level.
Of the children, 12% were underweight (n = 9), 53.3% were of normal weight (n = 40), 16% were overweight (n = 12), and 18.67% were obese.
When BMI was evaluated according to GMFCS levels, 50% of obese children were categorized as level I (n = 10), 20% were level II (n = 4), 30% were level III (n = 6). Thirty six point eight percent of overweight children were GMFCS level I (n = 7), 31.5% were level II (n = 6), 31.5% were level III (n = 6). Seventeen point nine percent of normal-weight children were level I (n = 14), 35.8% were level II (n = 28), and 46.1% were level III (n = 36). Among underweight children, 25% were GMFCS level I (n = 4), 12.5% were level II (n = 2), and 75% were level III (n = 12).
Participants were investigated separately in two groups: obese and obese + overweight. In Table 2, the differences between the variables of age, gender, CP type, and GMFCS type were investigated separately, comparing the obese and obese+overweight groups against typical weight. The difference between the obese and obese+overweight groups was not investigated.
Chi-square test results
CP: cerebral palsy. GMFCS: Gross Motor Function Classification System. US: United States. TR: Turkey.
GMFCS was regrouped as mild for levels I and II, and severe for level III. The relationship of weight, height, and BMI with GMFCS level was investigated using the Mann-Whitney U test since the groups were not normally distributed. The data from Mann-Whitney U test are shown in Table 3.
Mann-Whitney U test results
GMFCS: Gross Motor Function Classification System.
Binary logistic regression analysis showed that GMFCS level (p = 0.038) was the associated factor for being obese which explained 19.6% of the variance, and GMFCS level (p = 0.023) and being hemiplegic (p = 0.026) were the associated factors of being obese or overweight, which explained 21.9% of the variance. Age and gender did not appear to affect BMI (p > 0.05) (Table 4).
Binary logistic regression analysis of BMI for obesity and obesity or overweight
BMI: body mass index. GMFCS: Gross Motor Function Classification System.
Using the Turkish reference data in the study [12] and the references published by WHO and US CDC BMI Growth Standards, the data were further analyzed to investigate their agreement. The quadratic weighted Kappa Measure of Agreement value was 0.87 for WHO and 0.47 for CDC, with a significance of p < 0.001. According to Peat [15], a value of above 0.8 represents very good agreement between BMI (TR) and BMI (WHO), and a value of 0.41–0.60 represents moderate agreement between BMI (TR) and BMI (US) classifications. Results are shown in Table 5.
Kappa measure of agreement analysis
*% within BMI (TR). BMI: body mass index. US: United States. TR: Turkey.
Childhood obesity is a growing concern all over the world. It causes a significant increase in obesity-related health problems, which are predicted to have a major impact on the child’s physical and psychosocial well-being, health expenses, and even life expectancy in later years. Prevention and detection are very important to prevent undesirable health outcomes in overweight and obese children. In a study, Guardi et al. showed that 99% of overweight and obese children lack a formal clinical diagnosis [16]. There is no nationwide systematic obesity study conducted in Turkey. However, Bereket et al. reported that an increasing trend is seen in the prevalence of obesity in Turkey, as in many countries, although it is still lower compared to North America and Western Europe [17].
Children with disabilities are at greater risk of obesity compared to their typically developing peers [18]. Those with disabilities are generally less active and have less social participation [19]. Secondary health problems such as chronic pain, social isolation, and depression are other factors that increase weight gain [20]. The fact that a child with disability is obese increases the need for caregiver help in daily life activities and also adversely affects the health of both the child and their caregiver, leading to increased healthcare expenses [3].
CP is the most common childhood disability that causes movement and activity limitations. In the limited literature, it has been reported that obesity rates are increasing steadily in children with ambulatory CP [7, 22]. In a recent study, the effect of obesity on gait patterns in children with CP was investigated. Although BMI had little effect on gait patterns, it was found to affect long-distance mobility [23].
This is the first study investigating the prevalence of obesity among ambulatory children with CP in Turkey. Secondarily, the association of obesity with age, gender, CP type, and GMFCS level in children with CP was investigated.
In this study, the mean BMI of the participants was 17.78 kg/m2, with an obesity rate of 18.67%, and an overweight rate of 16%. These findings indicate a considerably higher rate of obesity compared to those reported by Pascoe et al. (7.3% overweight and 12.1% obese), Kiernan et al. (12.8% overweight and 7.1% obese), and Kwon et al. (8.9% overweight, 5.7% obese) [7, 22]. While the overweight rate was also higher in Rogozinski et al.’s study, obesity rate was similar to data in this study (7.5 % overweight and 16.5% obese) [21].
Although there is no recent national data from Turkey, by comparing with typically developing children, Özcebe et al. reported an overweight rate of 14.5% and obesity rate of 8.6% in children aged seven years, overweight rate of 13.9% and obesity rate of 8% in those aged eight years in their study as part of the WHO European Childhood Obesity Surveillance Initiative (COSI) [24]. This finding reveals that the obesity rate is very high in children with CP compared to their typically developing counterparts.
In this study, the combined rate of obesity + overweight children was found to be associated with age and was significantly higher in children with CP aged 5 to 12 years. The mean age of the children was 7.76 years. In the studies of Rogozinski and Kwon, the mean age of the participants was higher (10.2 and 9.5 years, respectively) [21, 22]. However, they reported differential results on the relationship between obesity and age. While Rogozinski reported a higher prevalence of obesity under eight years of age, Kwon reported that BMI increased significantly with age. In the current study, obesity showed a weak positive correlation with age and appeared to be more common in children between the ages of 5–12.
It was observed that obesity and overweight were not associated with gender and CP subtype, in line with Pascoe et al.’s report [7]. Rogozinski et al. reported a more significant increase in the prevalence of obesity over time in females [21].
The participants were divided into two groups (I and II as mild, III as severe) according to the GMFCS level (to evaluate the effect of assistive device usage on obesity), and the relationship of weight, height, and BMI with GMFCS level was investigated. Gross motor function was found to be associated with height, weight, and BMI. Children with better GMFCS levels (I and II) had greater height, weight, and BMI values. The mean BMI of the children with GMFCS III was 16.47 kg/m2, and the rate of underweight children was 20%. Nevertheless, this finding needs to be clarified by further studies as to whether it is due to malnutrition in children with GMFCS III or due to increased obesity in children with GMFCS I and II.
The reference values used in the study were developed by Olcay Neyzi in 2008. Neyzi noted that the weight-for-age values of Turkish children are higher than those of American children, and BMI values in adolescence are much higher than the Western European values [12]. This confirms that childhood obesity is becoming an increasingly prominent public health problem in Turkey. Also, the findings of Neyzi show that the so-called “trend of the century” still affects Turkish children, and therefore, the reference values should be updated periodically [12].
Study limitations
There are several limitations to this cross-sectional study. It is not possible to extrapolate the findings to the entire population of ambulatory children with CP, as this study was conducted in a single center. Population-based studies are warranted to obtain more reliable results. In addition, the distribution of CP subtypes was not homogeneous, and the numbers of children with dyskinetic and ataxic CP subtypes were very low. Results may differ in a more homogeneous group.
According to the results of analysis based on Neyzi’s reference values, it is not possible to compare the prevalence of obesity according to the WHO criteria. However, this study reveals that WHO and Neyzi’s reference values represent very good agreement and obesity seems to be an important issue in children with CP when analyzed both according to Neyzi’s and WHO reference values. In fact, in 2011, Brooks et al. [13] developed reference multiple growth charts based on data from a large population of children with CP and classified by functional severity. As can be seen from the results, while these references show a high agreement for being underweight, the obesity rate is much lower in the CP-specific CDC chart than in the Neyzi reference and the WHO reference. Brooks et al. mostly focused on the relationship between low weight and mortality and did not find a relationship between obesity and morbidity or mortality. Although the accuracy of using charts designed for typically developing children in children with CP is controversial, comprehensive studies with CP-specific CDC references are needed to obtain more objective results.
Conclusion
Turkish children with CP showed a higher rate of obesity compared to their typically developing peers and also their counterparts in other countries. There is an urgent need for studies to identify the causes of overweight and obesity in children with ambulatory CP and to develop effective preventive programs. It is also important to ensure the continuity of follow-up studies in order to evaluate the effectiveness of intervention programs.
Footnotes
Acknowledgments
The study protocol was approved by the Ethics Committee of Istanbul Medeniyet University Goztepe Training and Research Hospital (2021/0025). All participants provided informed consent.
Conflicts of interest
The authors certify that there is no conflict of interest with any financial organization regarding the material discussed in the manuscript.
Funding
The authors report no involvement in the research by the sponsor that could have influenced the outcome of this work.
Author contributions
Author AI and author BDK have given substantial contributions to the conception or the design of the manuscript, author BDK, GK and author AI to acquisition, analysis and interpretation of the data. All authors have participated to drafting the manuscript, author BDK revised it critically. All authors read and approved the final version of the manuscript.
All authors contributed equally to the manuscript and read and approved the final version of the manuscript.