
Abstract
PURPOSE:
Hemiplegic cerebral palsy (hCP) typically impacts sensorimotor control of the hand, but comprehensive assessments of the hands of children with hCP are relatively rare. This scoping review summarizes the development of hand function for children with hCP.
METHODS:
This scoping review focused on the development of hand function in children with hCP. Electronic databases (PubMed, PEDro, Web of Science, CINAHL, and SpringerLink) were searched to identify studies assessing hand function in children with hCP. The search was performed using keywords (e.g., “hemiplegia”). An iterative approach verified by two authors was used to select the studies. Articles which reported quantitative data for children with hCP on any items of a specified set of hand evaluations were included. Measures were sorted into three categories: quantitative neuromechanics, clinical assessments, and clinical functional evaluations.
RESULTS:
Initial searches returned 1536 articles, 131 of which were included in the final review. Trends between assessment scores and age were examined for both hands.
CONCLUSION:
While several studies have evaluated hand function in children with hCP, the majority relied on clinical scales, assessments, or qualitative descriptions. Further assessments of kinematics, kinetics, and muscle activation patterns are needed to identify the underlying impairment mechanisms that should be targeted for treatment.
Abbreviations
Cerebral Palsy (CP) Hemiplegic Cerebral Palsy (hCP) Jebsen-Taylor Test of Hand Function (JTTHF) Melbourne Assessment of Unilateral Upper Limb Function (MUUL) Purdue Pegboard Test (PPT) Box and Block Test (BBT) EMG, Range of Motion (ROM) Two Point Discrimination (2PD) Assisting Hands Assessment (AHA) Typically Developing (TD)
Introduction
Cerebral palsy (CP), arising from neurological damage incurred during the prenatal, perinatal, or early postnatal periods [1], is one of the most common movement disorders among children. It occurs in approximately 2.11 out of every 1000 live births [2]. Hemiplegic CP (hCP), the second most common form of CP [3], affects sensorimotor function of the limbs predominantly on one side of the body, often to a greater extent in the upper extremities. Almost half of all children with hCP have greater impairment in their upper limb than in their lower limb [4]. Within the upper limb, the hand is most likely to be impaired [5]. Hand impairment can lead to substantial disability since the hand is the primary means of interacting with the world. As 96%of all children with CP live into adulthood, chronic hand dysfunction will impact employment, recreational, and social opportunities for decades [6].
Despite the importance of research into upper limb impairments in hCP, reviews focusing on characterization and quantification of deficits in the hand have been relatively limited. One previous review article on quantitative measures of upper limb impairments in hCP focused largely on reach, with relatively few studies describing grasp in conjunction with reach [7]. Other review articles describing upper limb sensorimotor control in children with CP have described clinical assessments and their reliability [8–10] or specific areas such as three-dimensional limb kinematics or bimanual task performance [7, 11]. Thus, motor control of the hand itself has not been well characterized. Furthermore, because past reviews focus on reliability of the assessments, they typically do not provide the absolute values of measurements that are needed to assess performance in children with hCP.
Since past reviews have been preferentially more focused on the arm than the hand, and more focused on the characteristics of upper limb assessments than on summarizing the results of these measures, a scoping review of published articles was warranted to address these gaps in knowledge. This review allows for a broad search of the literature to identify and summarize original research focused on assessing hand function of children with hCP, thereby identifying gaps in the research. Primarily, this review was intended to provide researchers and clinicians with an overview of quantitative measures of hand function in children with hCP, as well as to create a summary of the current state of research in this area. This was accomplished by: summarizing the results of common quantitative measures and assessments of hand function in children and adolescents with hCP; examining the extent of methodological variation for different hand assessments for children; and identifying areas for further research on hand function of children with hCP. While both qualitative and quantitative assessments can provide important information about hand impairment, this scoping review was limited to quantitative measures, as they enable more direct comparisons between children which can give insights into the underlying causes of impaired hand function and inform development of effective treatments of it.
Methods
Article search and inclusion
This work presents a review of quantitative measures and imaging techniques assessing hand function in children (18 years old or less) with hCP. A search and a data inclusion protocol were written prior to the search. This review was written to comply a posteriori with Joanna Biggs Institute scoping review protocol requirements. Table 1 summarizes the inclusion/exclusion criteria for this scoping review. A comprehensive search for original research journal articles of the following databases was conducted in May and June of 2018 and updated in October of 2019: PubMed, PEDro, Web of Science, CINAHL, and SpringerLink. Conference proceedings and review articles were excluded to avoid potential “double counting” of the same data set app-earing in multiple publications. The searches were performed using the combined keywords ‘cerebral palsy’ and ‘hemiplegia’, ‘hemiparetic’, or ‘unilateral’ to capture the population and ‘hand’ to focus the search. These required terms were combined with optional terms that described different measures and outcomes (e.g., ‘strength’, ‘force’, ‘kinetics’, ‘EMG’, ‘activation’, ‘brain’, ‘imaging’, ‘skill’, ‘function’, or ‘motor’). Articles using all types of study designs were included but some were excluded based on criteria such as subject population and characteristics of the reported data. In order to focus on hand function in children, articles had to have three or more participants aged 18 years or under for inclusion. Results were limited to articles available in the English language due to a lack of access to translation services. No restriction was placed on the date of publication. As upper limb surgery or botulinum toxin treatment would acutely alter the natural progression of sensorimotor control, data collected following these interventions were excluded. Pre-operative data were included.
Inclusion/Exclusion Criteria Summary
Inclusion/Exclusion Criteria Summary
After examining the relevant papers, common measures were selected for evaluation and data extraction. For clinical assessments that evaluated the same or similar components of hand function, the most common assessment was used. Articles that assessed children (18 years of age or under) with hCP with at least one of the following quantitative measures of hand function were included: pinch strength, finger forces, grip strength, range of motion (ROM), electromyograph (EMG), two-point discrimination (2PD), pegboard tests, Box and Block Test (BBT), Jebsen-Taylor Test of Hand Function (JTTHF) [12], Melbourne Assessment of Unilateral Upper Limb Function (MUUL) [13], and the Assisting Hand Assessment (AHA) [14]. While this list is not exhaustive (e.g., the SHUEE [15]), preliminary analysis had revealed that this set included popular means of evaluation while covering a range of sensorimotor characteristics.
The searches of the five databases yielded 1536 articles. Two of the authors independently reviewed the title and abstract of each of these articles to screen them for potential inclusion in the review and entered their search results and inclusion decision in a shared data record. In cases where a determination could not be made from the abstract alone, the entire text was examined. Differences in opinion regarding inclusion of a specific article were discussed until consensus was made. Articles that failed to contain data that fit into one of the chosen categories (quantitative neuromechanics, clinical assessments, and clinical functional evaluations) were excluded from further analysis. Critical appraisal of the sources of evidence was not performed due to the focus of this scoping review on baseline characterization of impairment rather than the efficacy of an intervention. Many of the measures employed are standardized and have been validated.
Once the list of selected articles was finalized, the identified quantitative measure(s), along with participant ages, neurological status, assessment results, and MACS, GMFCS or Zancolli scores were extracted from each article. The selected articles are listed in Appendices A1, A2 and A3 with the characteristics of the articles, reported participant age ranges and sample sizes, and the relevant evaluations provided in each article. Each appendix lists articles reporting measures which fell under one of the three categories: quantitative neuromechanics, clinical assessments, or clinical functional evaluations. This information was extracted for half of the articles by one author, while another author extracted data for the rest of the articles. The data for each was extracted by one author and verified by the other author.
Extracted data were collected using worksheets with standardized fields. In cases where opinions regarding data extraction diverged, the original article was reviewed jointly to resolve differences. These data were sorted into the aforementioned categories and then into appropriate subcategories. Quantitative neuromechanics included the subcategories of pinch strength, finger forces, grip strength, range of motion (ROM), EMG data, and magnetic resonance imaging (MRI). Clinical assessments included: two-point discrimination (2PD), pegboard tests, the Box and Block Test (BBT), and the Jebsen-Taylor Test of Hand Function [12] (JTTHF). Clinical functional evaluations included: the Melbourne Assessment of Unilateral Upper Limb Function [13] (MUUL) and the Assisting Hand Assessment [14] (AHA). For each type of quantitative measurement, the context of use, values for different age groups, the relationship between quantitative measurement values, and the results of relevant clinical evaluations were examined.
Presentation of results
The mean values for each group for participant age and characteristics and assessment outcomes in each study were extracted or calculated from reported values for individuals. In some cases, articles reported averaged values for all participants or groups of participants. In some cases, data for individual participants were also obtained (e.g., Fig. 6b), and data for each individual was screened for exclusionary criteria (age, hCP status). The included data values were averaged or charted separately. Mean assessment outcomes were charted against mean ages or MACS scale. Data sets were associated with one of the hands of either children with hCP or with typically developing (TD) children. Where practical, the source for data points were identified in the legend. Figures with legends list the referenced studies and associate each with a specific marker shape and/or color so that sources of specific data points can be identified. Studies reporting data from both the paretic and non-paretic hands may be referenced twice in a figure legend. Trend lines were added to figures to provide a rough visual guide; the trend lines were created by computing a least-squares linear fit to the data.
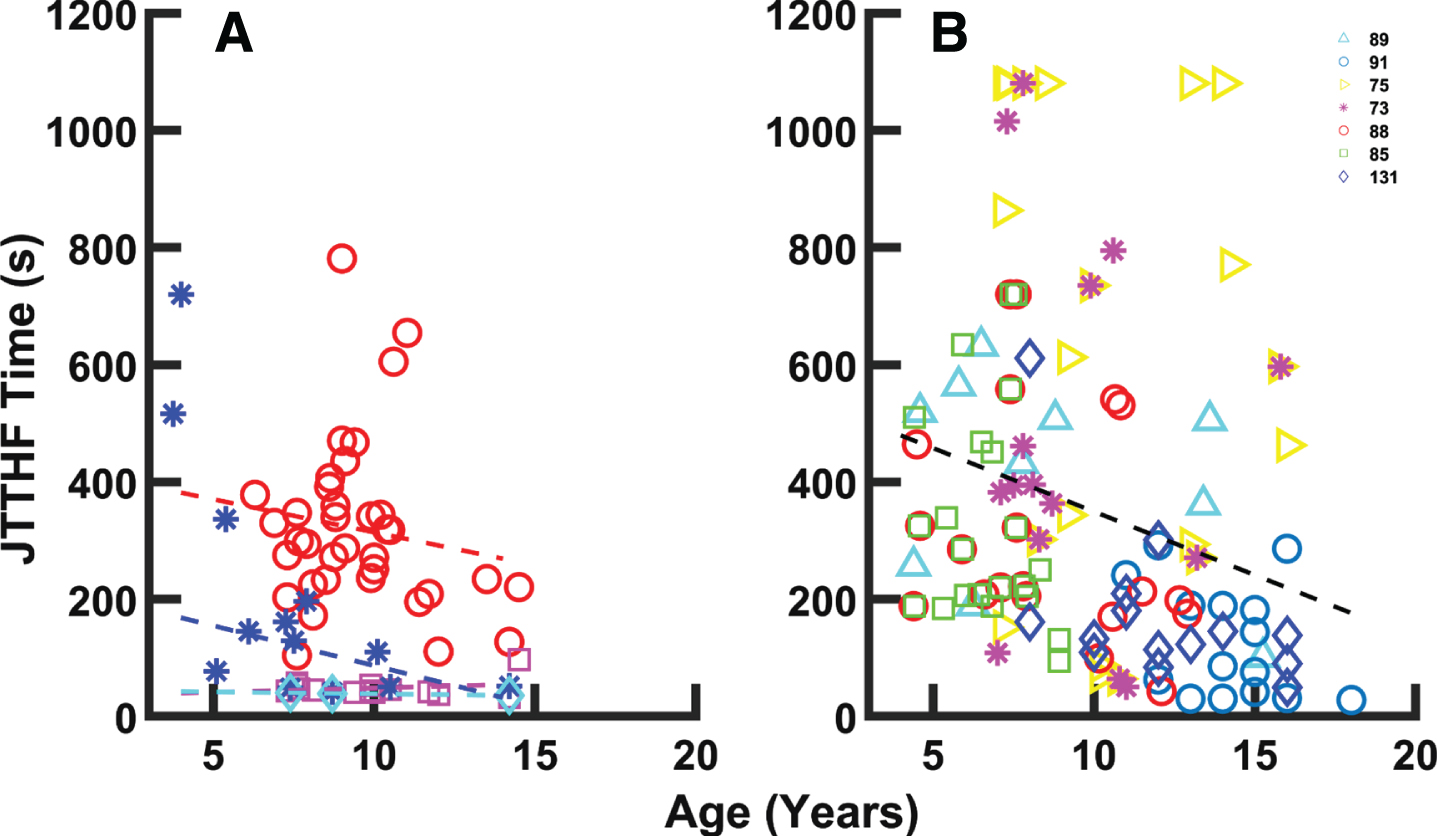
A) Average JTTHF times reported across 32 studies [20, 111–130]. Times for children with CP demarcated with shades of red (paretic hand: red symbols and linear fit, y = –11.25x + 426.6; non-paretic hand: magenta symbols and linear fit, y = –1.43x + 34.04). Times for TD children demarcated with shades of blue (dominant hand: cyan symbols and linear fit, y = –0.664x + 45.08; non-dominant hand: blue symbols and linear fit, y = –13.63x + 222.85). B) Individual JTTHF times vs. age for the paretic hand of children with CP from seven studies [73, 131]. Regression: y = –21.66x + 566. The legend numbers indicate the references associated with specific data points.
Of the 1536 unique articles identified through the searches, 327 met the inclusion criteria for full text review. A total of 131 of the 327 met the inclusionary/exclusionary criteria in terms of subject number and age and the type of data collected (Fig. 1). The other 196 were primarily excluded due to a lack of quantitative data, the inclusion of multiple forms of CP, or comingling of data from subjects over 18 years of age.
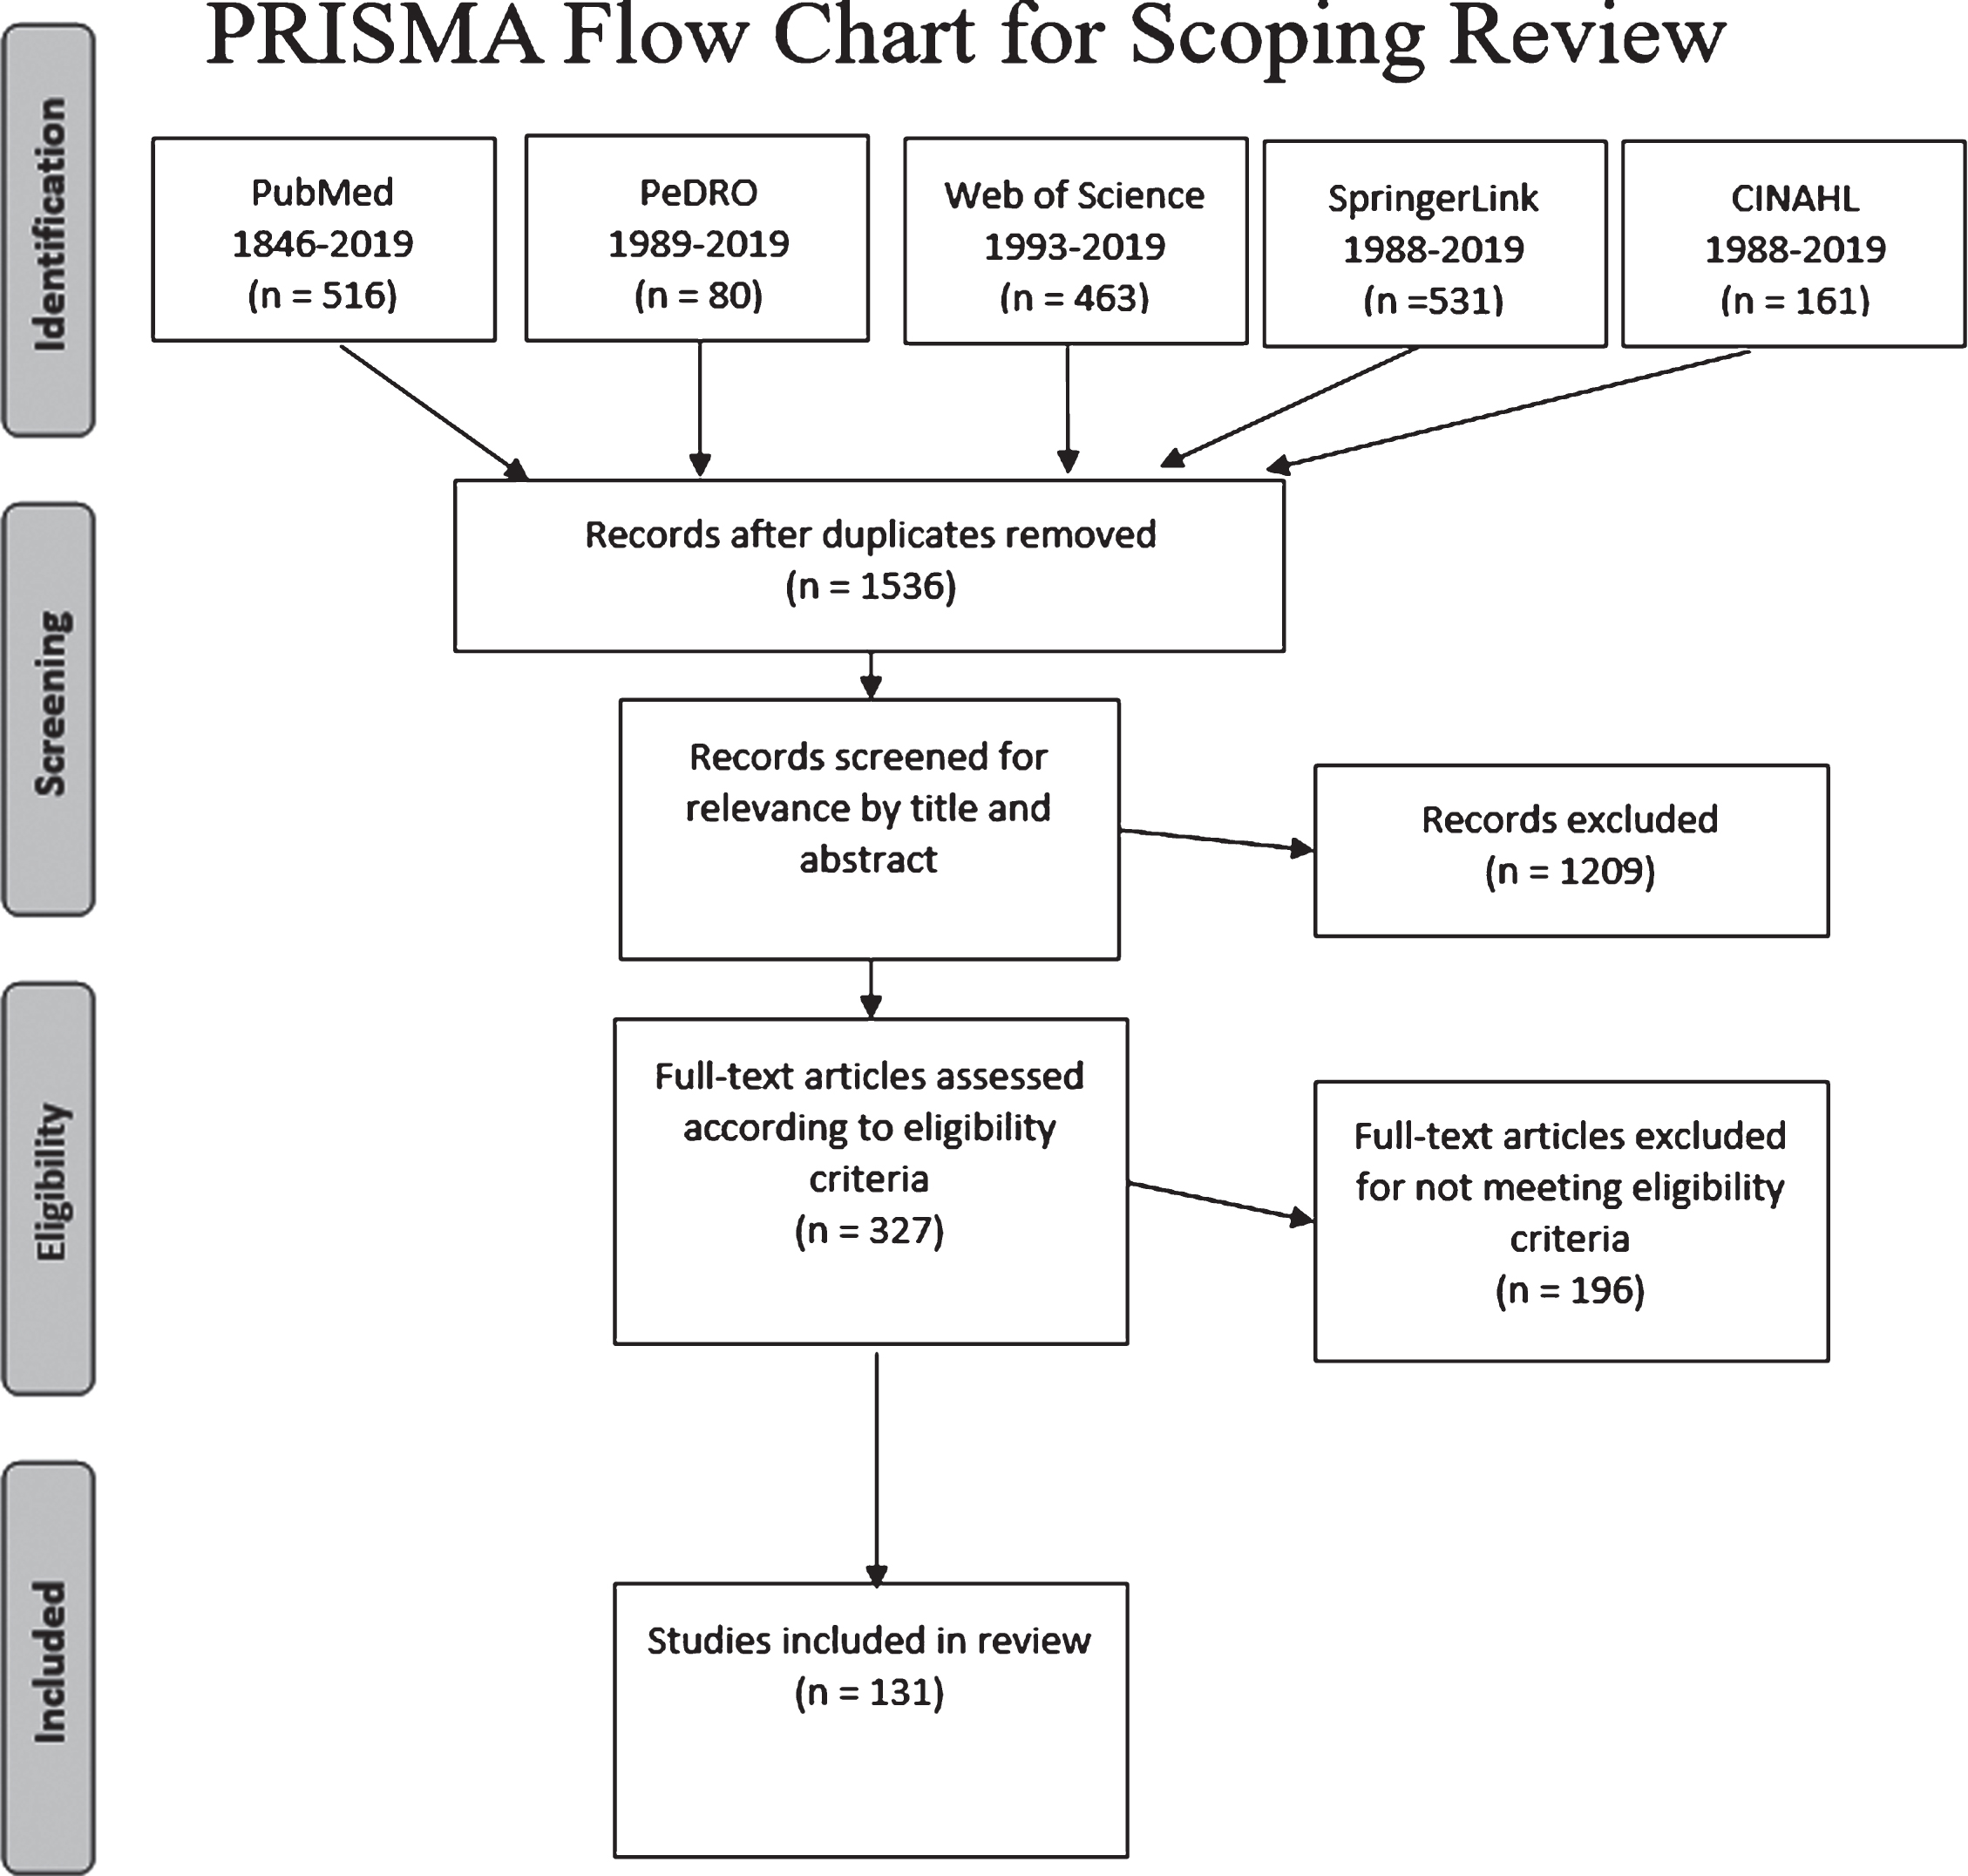
PRISMA diagram of article selection. A total of 327 articles were assessed; 131 articles met the desired criteria and were included in this review.
Of the 131 articles included in the review, 72 described neuromechanics, 34 evaluated clinical assessments, and 67 included data for functional evaluations. Most articles reported data covering more than one of the categories; in these cases, each qualifying set of data was reported separately in the appropriate section. The included studies generally reported their funding sources, which primarily consisted of governmental agencies and universities (Appendix A4). These sources of funding do not raise particular concern regarding introduction of bias.
Pinch
Of the 12 articles that measured pinch force, 8 included data for one or both hands of children with hCP; some also included pinch force data for both hands in TD children or normative data [16–23]. Data from these articles were aggregated (273 participants in total) to provide an overview of the development of lateral pinch strength with age in children with hCP.
Data for the TD non-dominant hand showed a mean lateral pinch strength of roughly 44 N at 6.5 years of age. Lateral pinch strength for the TD children increased up to 69 N by age 12 (Fig. 2a). Lateral pinch strength was considerably lower even at a young age in the paretic hand in children with hCP, with a mean value of 19.0 N (44%of the TD value) at 8.2 years old. In contrast to the TD subjects, pinch strength showed no increase with age for the paretic hand in hCP subjects. Thus, hCP pinch strength was less than 29%of the TD value at age 12 (Fig. 2a); impairment relative to TD children increased with age.
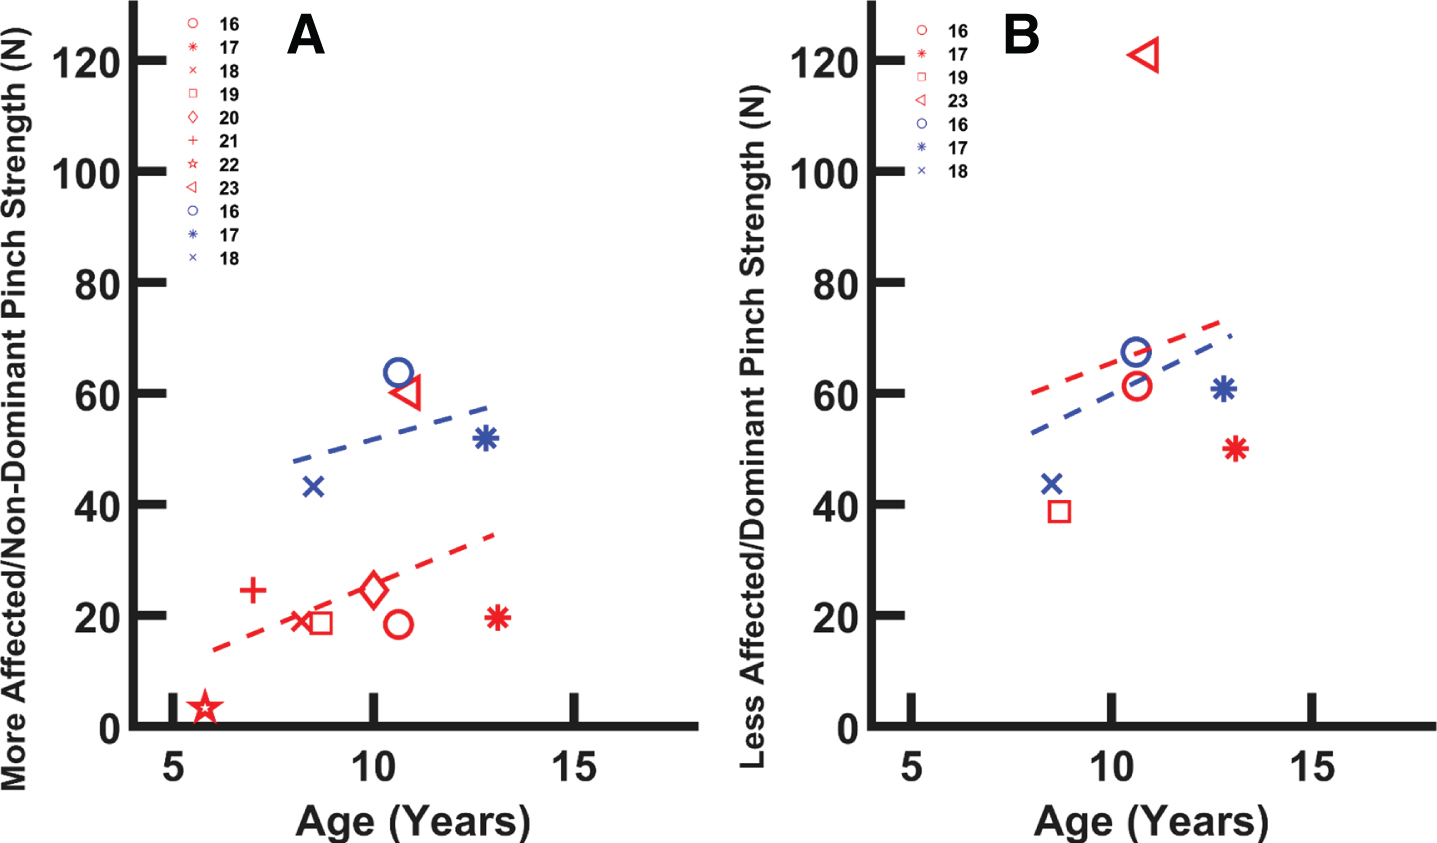
A) Maximum lateral pinch vs. age for the paretic hand in children with CP (red (lighter) symbols, y = 2.97x –4.086) and the non-dominant hand of TD children (blue (darker) symbols, y = 2.00x + 31.69). Data aggregated from 8 articles with a total of 257 participants with CP, 16 TD participants, and TD normative data. Trend lines represent a linear fit to the aggregated data. Reported paretic hand data appears to increase with age but was less than non-dominant hand strength at all ages. B) Maximum lateral pinch strength for the non-paretic hand of children with CP (red (lighter) symbols, y = 2.73x + 38.22) and the dominant hand for TD children (blue (darker) symbols, y = 3.53x + 24.56). Values for non-paretic hand exhibit a more normative increase with age. Red (lighter) symbols are associated with data from the paretic hand; blue (darker) symbols are associated with data from the non-paretic hand. The legend numbers indicate the references associated with specific data points [16–23].
Across the studies, the dominant hand in TD children had a mean lateral pinch strength of 44 N at 6.5 years old and this value increased to 69 N by the age of 12.0 (Fig. 2b). These pinch values were slightly less than those reported for the TD non-dominant hand. Mean lateral pinch strength for the non-paretic hand in children with hCP was around 38.7 N, a value similar to the dominant hand in TD children, at 8.5 years old. Unlike the situation for the paretic hand, strength in the non-paretic hand increased with age, up to 50 N for 11-year-olds (Fig. 2b). For the 6.5-year-olds with hCP, maximum lateral pinch was three times greater for the non-paretic hand in comparison with the paretic hand. This disparity was almost four-fold for 15-year-olds.
Three articles were included in the review which examined finger flexion force or finger extension force. Participants ranged in age from 6.5 to 12.5 years old [24–26]. Finger flexion force was evaluated by having the index and middle fingers press together on a lever. The finger flexion force of the dominant and non-dominant hands of TD participants tended to be greater in older children, with similar values for both hands (dominant hand: 20 N at 6.5 yrs and 40 N at 12.5 yrs; non-dominant hand: 18 N at 6.5 yrs, 38 N at 12.5 yrs).
The finger flexion force values of participants with hCP were substantially reduced compared to the values for TD children, although older subjects with hCP were generally stronger than younger ones (8 N at 6.5 yrs, 14 N at 10.9 yrs, 12 N at 12.5 yrs) [24, 25]. The reported non-paretic finger flexion force of participants with hCP was relatively high for younger children but low for older children (non-paretic hand: 35 N at 6.5 yrs and 25 N at 12.5 yrs). Only one of the articles located by the search reported measurements for extension force; the actual fingers used in the measurement, however, were not specified [26].
Grip strength
Fourteen articles evaluated and reported maximum grip strength in children with hCP. A total of 12 studies provided quantitative measures of grip strength and age (Fig. 3). Some studies only provided correlation coefficients for grip strength [27]. Overall, children with hCP were found to have a decreased maximum grip strength with their paretic hand relative to their non-paretic hand or the hands of the TD children [17, 28–31].
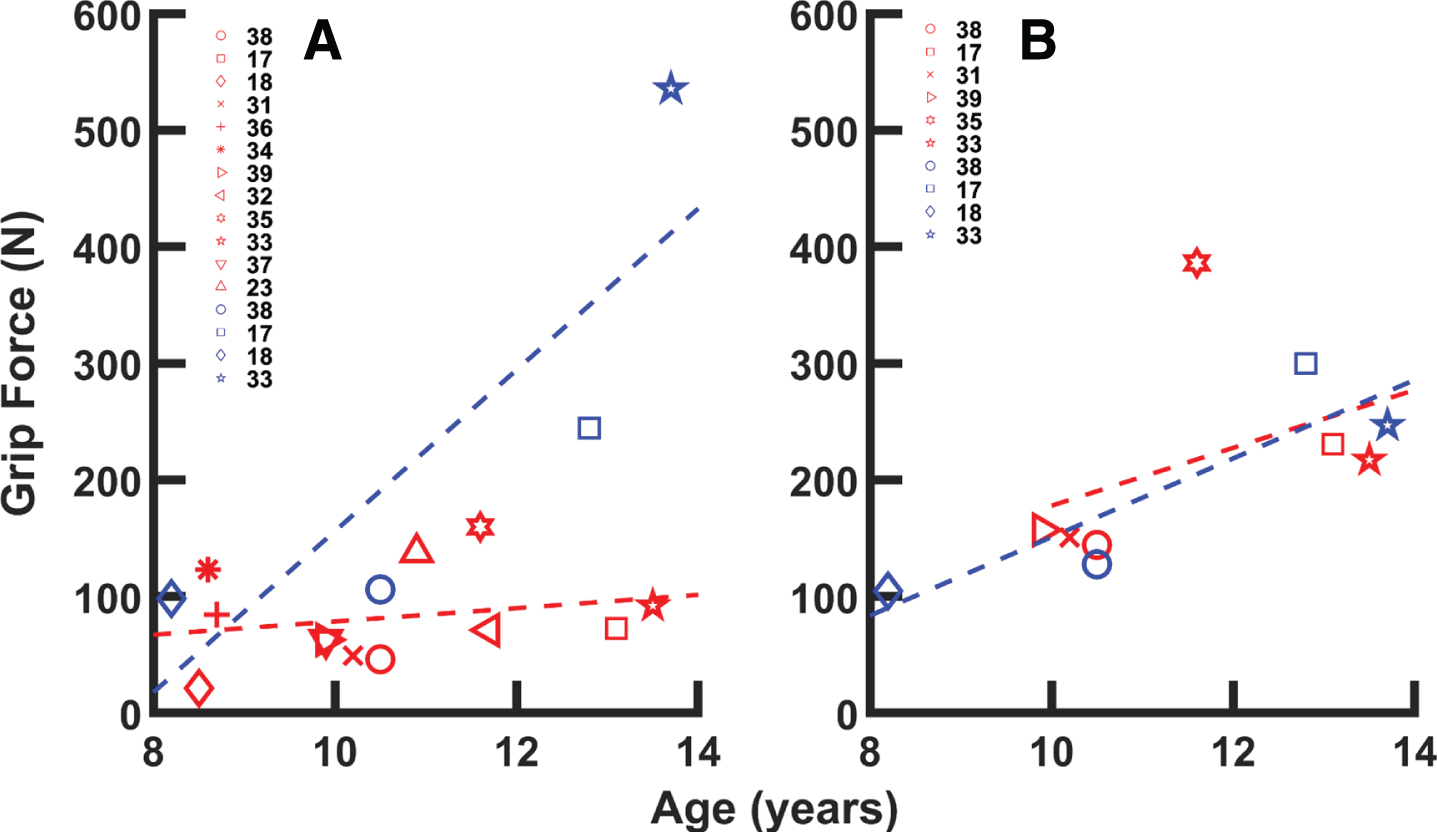
Maximum grip strength data aggregated from 12 studies. Symbols represent mean data for a given age group for the referenced study. A) TD non-dominant hand (blue (darker) symbols, y = 69.15x –535.47) and paretic CP hand (red (lighter) symbols, y = 5.71x + 21.39). Substantial deficits were present in the paretic hand. B) TD dominant hand (blue (darker) symbols, y = 33.70x –186.06) and non-paretic CP hand (red (lighter) symbols, y = 24.82x –70.31). Dashed lines indicate linear fit to data. Red (lighter) symbols are associated with data from the paretic hand; blue (darker) symbols are associated with data from the non-paretic hand. The legend numbers indicate the references associated with specific data points [17, 31–39].
Of the articles included in this subcategory, six obtained grip force data using similar techniques, namely with a handheld dynamometer. In total, these six studies involved 176 children with hCP and 48 TD children [17, 28–31]. The aggregated data suggest substantial relative deficits in grip force with the paretic hand, which achieves only about 30%of the force achieved by the non-dominant hand in TD children (Fig. 3a). The magnitude of the deficit increases with age; the absolute difference at 13 years of age approaches 200 N. Values for the non-paretic hand were similar to those for the non-dominant hand in TD children (Fig. 3b).
Five articles measured grip during lifting tasks that required the generation of sufficient normal force to create the frictional shear force needed to counteract gravity and inertia. Two of these articles did not report normal maximal grip force and were excluded from Fig. 3 [29, 40] When children with hCP were asked to lift an object with their paretic hand, they produced excessive grip force, thereby introducing a large safety margin [29, 40–42]. Those with hCP also had a slower reaction time when responding to an increasing variable load [43].
Eight articles reported data on ROM of the wrist or fingers. Methods used to determine ROM varied across studies, but all eight used a goniometer to measure joint angles. One article examined passive range of motion (PROM) of thumb joints and noted that the PROM of the carpometacarpal joint of the paretic hand was reduced for abduction and extension compared to the non-paretic hand [44]. Passive extension of the fingers of the paretic hand was severely limited in comparison to the passive extension range of non-paretic fingers, even when the wrist was flexed to aid finger extension [44]. Klingels et al. reported hyperextension of the finger proximal and distal interphalangeal joints [45]. They found that PROM limitations in the upper extremity were generally greater in older children [45]. The five studies evaluating wrist PROM in children with hCP all reported normal wrist PROM for the paretic hand. These articles reported “no movement limitation” [45], PROM wrist extension of 67°–80° [44, 47], wrist flexion of 78°–95° [44, 47], and total wrist PROM of 177° [48].
Studies also investigated active range of motion (AROM) in the wrist and digits. One article found a significant negative correlation between AROM of the wrist and the Ashworth score for the finger flexors [46]. Additionally, AROM was generally decreased in individuals who exhibited high variation of force (60%coefficient of variation or higher) when attempting to maintain an isometric force [46]. One article reported wrist ROM achieved during performance of several upper limb tasks [49]. Three articles, totaling 144 participants ranging in age from 4.6–7.8 years, reported AROM for the wrist together with either the Manual Ability Classification System (MACS) or Gross Motor Function Classification System (GMFCS) classification [48, 51]. These articles reported that participants with higher overall function had greater wrist AROM. Participants classified as GMFCS I and either MACS I or II had a mean wrist AROM of 105°, while participants classified as MACS III had a mean wrist AROM of 22°. A fourth study reported maximum active wrist extension, together with Zancolli classification, for 20 children with hCP [46]. Those children classified as Zancolli I could achieve 27° of wrist extension beyond the neutral position, while those classified as Zancolli IIB could not extend the wrist beyond 42° of wrist flexion relative to the neutral position.
General kinematics
Thirteen articles that analyzed hand or finger kinematics were identified [42, 52–61]. Almost all of these studies, however, examined displacement of the hand relative to the body or to an object rather than rotation of the joints of the digits. Most of the cited articles recorded hand motion while participants reached out and grasped an object (reach-and-grasp) or reached out and touched a target (reach-and-touch). These articles examined hand displacement in space, hand posture, and timing during unimanual and bimanual tasks. For bimanual tasks, a higher correlation between the positions or velocities of the two hands was considered an indication of interlimb coupling. For reach-and-touch, two studies found evidence of coupling between the mean velocities of the hands during bimanual motion [55, 56]. During reach-and-grasp, three studies found evidence of coupling between mean hand velocities for a bimanual motion [55, 60]. Two studies also found that the non-paretic hand affected the paretic hand during reach and grasp tasks.
A few studies have tracked wrist joint angles during upper limb movements. Mutsaarts et al. measured the joint angles at the wrist, elbow, and shoulder during reaching and grasping. They reported differences in the velocity trajectories between children with hCP and TD children [47]. Mailleux et al. placed markers on the trunk, acromion, humerus, forearm, and hand and performed three-dimensional motion analysis on the upper limb during hand-to-head, hand-to-mouth, and reach-to-grasp tasks in children with hCP [61]. They found significant differences in the upper limb movement pathology among children with different impairment levels, as measured with MACS. Gaillard et al. created a method of using 3D kinematic assessment of bimanual performance in a game-like situation [49]. They were able to successfully use this system to detect differences in upper limb kinematics between typically developing children and those with hCP.
EMG
While use of EMG recordings was limited in the reviewed studies, three articles did measure wrist EMG signals during various hand tasks. One article found that muscle activation and coactivation in the wrist flexors and extensors were increased in the paretic hand when compared to the non-paretic hand during grip [62]. Another article described a correlation between grip and pinch and the integral of the EMG signal envelopes (IEMG) of the paretic wrist muscles (flexor carpi radialis and extensor carpi radialis) [63]. During grip, the children with hCP had significantly lower wrist IEMG values than TD children. No differences were detected in the arm IEMG (biceps and triceps). During pinch, the arm and wrist IEMG activations were not significantly different between the CP and TD children [18]. Some studies discussed EMG but their results did not directly relate to hand function [64].
Magnetic Resonance Imaging (MRI)
Due to the disparity in methods used for acquiring and analyzing MR data, it was difficult to draw comparisons across the 49 studies reviewed which reported MRI and hand function data for children with hCP (see Appendix). Seven articles reported MRI data which was not easily comparable to other studies and did not include any of the other functional or clinical measurements sought for in this review [65–71]. Data from nine representative articles are presented: one reported asymmetry indices (AI) obtained from diffusion tensor imaging (DTI) data, four reported laterality index (LI) scores obtained from fMRI data, and four reported relationships between AI or LI scores and hand function measurement scores [72–80]. Five of these studies examined the relationship of AI or LI to MACS or GMFCS [72–76]. The AI values were calculated using the cross-sectional area of the corticospinal tracts at the level of the middle of the cerebellar peduncles [72]. Higher GMFCS levels (indicating a lower level of functioning) were associated with lower AI values. TD children had an average AI value of 0.99, while those with hCP GMFCS I had an average AI value of 0.54. Children with hCP GMFCS II had an average AI value of 0.45. Greater symmetry between the corticospinal tracts (indicated by an AI score closer to 1) has been associated with better scores on tests of digital dexterity, manual dexterity, stereognosis, and the ABILIHAND-Kids score [77]. The LI values were calculated using fMRI data recorded during cyclical squeezing of a sponge ball or extending and flexing the fingers at a rate of 2 Hz [73–76]. An LI = 1 indicates contralateral activation, LI = 0 indicates bilateral activation, and LI = –1 indicates ipsilateral activation [74]. The studies reported that higher LI scores (closer to 1, thereby indicating activation of the contralateral hemisphere) were associated with less impairment, as measured with MACS (Fig. 4).
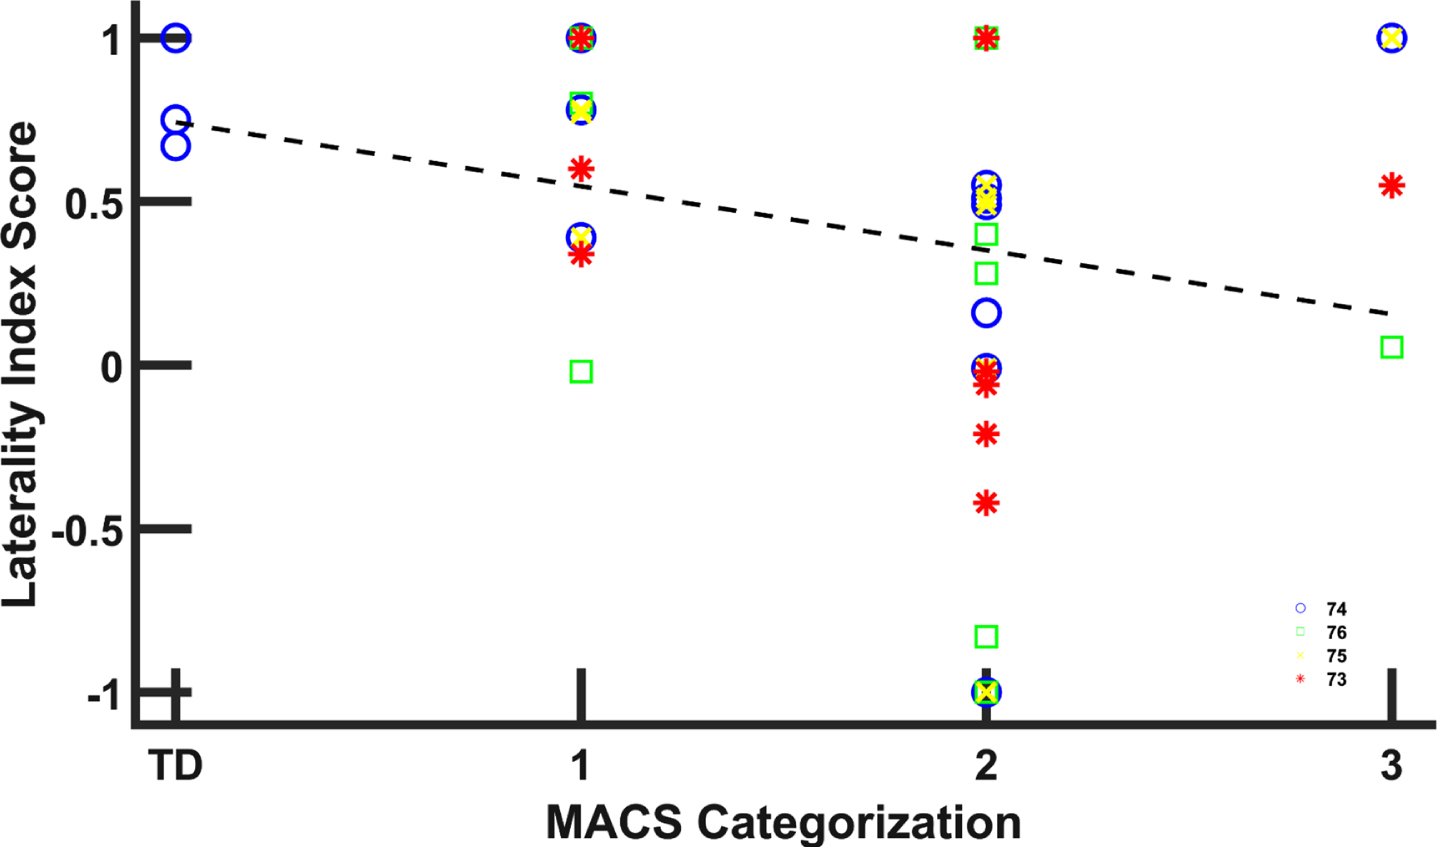
Laterality index (LI) values for children with hCP and TD children [73–76]. LI = 1 indicates activation entirely of the motor cortex contralateral to the hand; LI = 0 indicates bilateral activation; and LI = –1 indicates ipsilateral activation [74]. Greater contralateral activation was associated with less impairment. Trend lines indicate linear fit to LI data (y = –0.196 + 0.742). The legend numbers indicate the references associated with specific data points which are distinguished by marker shape and color.
Several studies also reported associations between MRI measurements and performance on tests of hand function and sensory capability. One study found that improved AHA and MUUL scores were associated with more symmetrical corticospinal tracts as measured by DTI [78]. Another found that LI values closer to 0 during bimanual tasks, indicative of better symmetry, tended to be associated with better performance on MUUL and AHA [79]. Yet, another found that better two-point discrimination performance was associated with higher LI values for the primary and secondary somatosensory cortexes [80].
Two-point discrimination
Twelve articles reporting two-point discrimination (2PD) data in the fingers were included [32, 81–91]. The articles described a variety of methods for determining 2PD, such as with paper clips [81], monofilaments [87], aesthesiometer [82, 91], and a device called the Discriminator [32, 86]. The 338 participants with hCP in these articles ranged in age from 4–18 years old. No 2PD data were reported for TD children. Across the aggregated group of subjects, discrimination was found to be poorer in the paretic fingers, with a mean static 2PD score of 5.5 mm as compared to 2.4 mm in the non-paretic fingers [32, 81–91].
No significant relationship between age and 2PD ability was observed for either the paretic or the non-paretic hand. Three of these articles, however, reported that some participants did not give reliably repeatable results for the 2PD tests, potentially due to the reliance on the subject to communicate their perception [84, 89]. Reliability substantially improved in children more than 8 years old [84, 89].
Purdue Pegboard Test
Ten articles described outcomes for subjects per-forming the Purdue Pegboard Test (PPT), an assessment requiring a participant to place as many pegs as possible (up to 50) in holes within 30 seconds [47, 92–99]. The aggregated data from these studies came from 175 participants with hCP who ranged in age from 8 to 18 years.
Aggregated data show a trend for increasing PPT score as age increases from 8 to 19 years old for participants with hCP. TD participants scored higher on the PPT with their non-dominant hand than their hCP counterparts did with their paretic hand. Values for the non-paretic hand in children with hCP were quite similar to those of the dominant hand in TD children for the ages studied.
Box and Block Test (BBT)
Twelve articles described use of the BBT to evaluate manual dexterity and provided the average BBT score as well as participant age data (Fig. 5) [16, 100–105]. Not all studies reported this data which prevented inclusion in the comparison [106]. The aggregated data from these studies includes outcomes for 375 paretic hands and 319 non-paretic hands in children with hCP (Fig. 5). The scores for the paretic hand were generally smaller than for the non-paretic hand, thereby indicating impairment in dexterity, although the deficits appear to be smaller in older children [92, 104]. Scores for both the paretic and non-paretic hands improved with age.
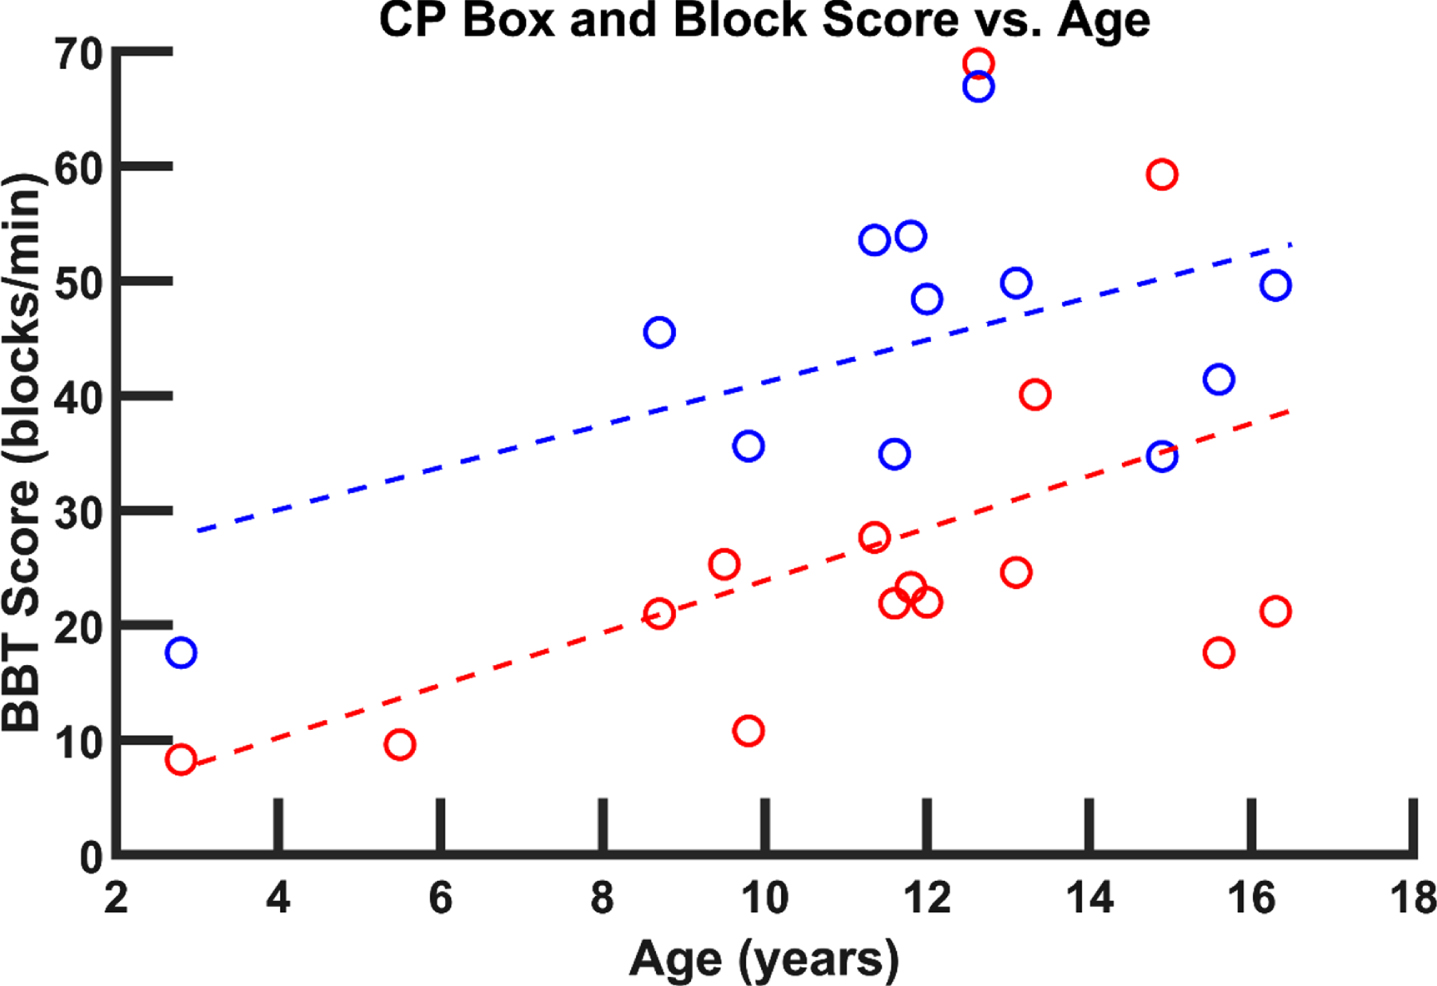
BBT score versus age for data aggregated from twelve studies. Trend lines suggest higher scores in older children for both the paretic (red (lighter) linear fit, y = –2.28x + 1.09) and non-paretic (blue (darker) linear fit, y = 1.85x + 22.65) hand in children with hCP. Red (lighter) symbols are associated with data from the paretic hand; blue (darker) symbols are associated with data from the non-paretic hand [16, 110].
In comparison to the scores for TD children, the hCP participants exhibited substantial deficits. Tomhave et al. found that children with hCP on average moved 24.8 less blocks with their affected hand than the contralateral hand. They also scored statistically significantly lower in the BBT than normative values across all age groups for both the paretic and non-paretic hand [16]. Holmstrom et al. also found that the paretic hand scored lower than normative data as reported by Mathiowetz et al. [107, 108]. In both studies, sensory impairment was correlated with a diminished BBT score. Furthermore, children who had contralateral projections that controlled their affected hand rather than only ipsilateral projections produced higher BBT scores [104].
Scores for the JTTHF, requiring the participant to perform a set of 7 tasks with one hand, were evaluated from 32 of the articles reviewed. From the mean data reported for different age groups for the 32 studies, it can be seen that across a range of ages (6 –15 years old), children with hCP required substantially more time to complete the JTTHF with their paretic hand (Fig. 6a) [20, 111–130]. In contrast, times for the non-paretic hand were quite similar to those of TD children. Seven studies provided individual data, including that from older children. These data suggest that JTTHF performance with the paretic hand may improve with age (Fig. 6b) [73, 131]. The combined data from these 7 studies shows that children younger than 10 years old had an average paretic hand JTTHF time of 449 seconds, while those older than 10 had an average JTTHF time of 242 seconds, still well above the time achieved with the non-paretic hand average (48.4 seconds) or by TD children with the dominant hand (38.4 seconds).
Functional evaluations
Melbourne Assessment of Unilateral Upper Limb Function (MUUL)
Eleven different articles reporting MUUL scores as a percentage of the total possible score were identified [32, 132–138]. Some studies did not provide comparable pre-intervention values [139, 140]. The aggregated data were obtained from 380 children with hCP. It exhibited a trend for higher relative MUUL scores in the paretic hands of children between 9 to 13 years of age versus children between 4 to 8 years old.
Bimanual Function: Assisting Hand Assessment Score (AHA)
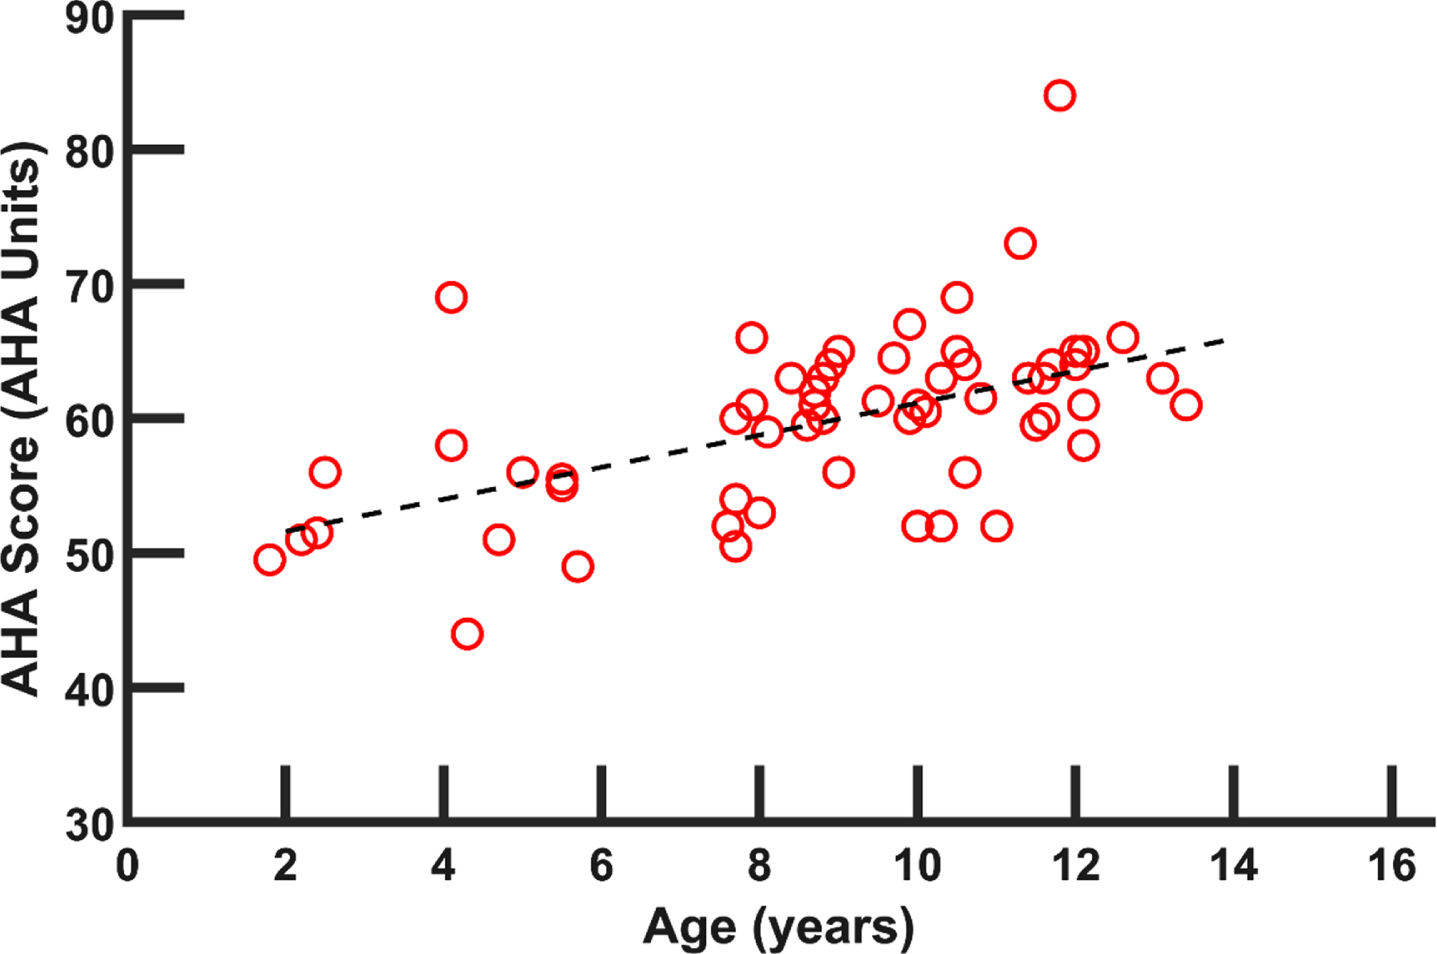
A total of 47 articles reported group scores, along with average age of the cohort, for the AHA instrument (see Appendix). Some studies only reported post-intervention values [141]. The AHA measures how children with unilateral hand impairment were able to use their paretic hand effectively with their non-paretic hand [142]. Across the studies, data were collected from 2332 children with hCP. A general trend shows improved (higher) scores on the AHA in older children (Fig. 7).
In general, paretic hand function of children with hCP was worse than for the non-paretic hand or the dominant or non-dominant hands of TD children. While most of the examined outcome measures indicated an improvement in paretic hand function with age (Finger Force, PPT, BBT, JTTHF, MUUL and AHA), in general, the rate of improvement failed to match that seen in TD children. This led to greater relative deficits with increasing age. Other measures revealed little (2PD, Pinch, Grip Force) or no (PROM) improvement in the paretic hand with age. For all available measures, the non-paretic hand performed similarly to the hands of TD children.
Discussion
The 131 included articles covered kinetics, kinematics, sensory perception, and task performance. In agreement with the findings of a past review article [7], the studies examined in this scoping review showed that children with hCP generally performed worse on upper limb assessment with their paretic hand than their non-paretic hand.
Study designs
The included articles utilized a wide variety of study designs, including: Randomized Controlled Trials, Cohort Studies, Cross-sectional Studies, and Case Series. For some of the measures examined (Kinematic analysis, MRI, 2PD), it was found that methodology, including the equipment used, varied significantly between studies.
In addition to a wide range of study designs, reporting of the exact methodology was often lacking. Previous reviews of upper limb assessments have reported that many hand assessments for children with hCP were not standardized and that there was no consensus on how to collect, analyze, or report measurement values [7, 9]. Other outcomes, such as AHA and JTTHF, were more formally standardized but often studies did not adhere to the standardized protocol or standardized data format, thereby making comparisons across studies difficult.
Data types
Kinetics
Grip and pinch strength were the main kinetic measurements identified in the included studies. The included articles were primarily from cross-sectional studies and longitudinal study designs. Measurements were typically made using mechanical gauges instead of load cells. In general, the paretic side performed worse than the non-paretic hand in grip and pinch strength. In addition, paretic hand deficits compared to typically developing children increased with age for pinch strength but not for grip strength. Wrist strength, individual finger flexion and extension strength were not reported.
Techniques used to measure grip and pinch strength were consistent across the examined articles. Typically, a mechanical pinch gauge was employed to measure maximum pinch (primarily lateral) force, and a mechanical dynamometer was used to record maximum grip force. This uniformity facilitated aggregation and analysis of the data across multiple studies. For both pinch and grip, substantial force deficits were evident in the paretic hand relative to the non-paretic hand or the hands of the TD children [17, 28–31]. The absolute deficits for children with hCP, relative to the abilities of their typically developing peers, appear to remain or even increase with age. For older children with hCP, grip and pinch strength values in the non-paretic hand were similar to those of TD children, but grip and pinch strength in the paretic hand were typically reduced by more than 50%.
These force deficits could arise from several sou-rces. Alterations in the muscle physiology may contribute to the weakness. Lieber and Fridén reported substantially increased sarcomere lengths in spastic wrist muscles [152]. Muscle fiber force generation would be reduced at these lengths. Additionally, infiltration of the muscle with collagen fibers and fat may decrease force-producing capabilities. The infiltration has been associated with a reduced number of muscle satellite cells in individuals with CP [153]. The described muscle weakness may also have neurological origins. Xu et al. reported larger EMG signals in the non-paretic wrist muscles than those of the weaker paretic hand and excessive co-activation of the flexors and extensors in the paretic hand [63]. Limited activation of agonists and involuntary activation of antagonists could both contribute to observed weakness. Further studies, particularly involving EMG, are needed to better determine the origin of the profound hand weakness.
Presumably, force deficits are even greater for wrist and finger extension, but relatively few studies have examined finger extensor strength, despite the prevalence of finger extensor weakness in children with CP [26]. Only a few articles employed load cells to quantify fingertip forces [24–26]. Potential issues such as finger force individuation or differences in relative weakness across fingers require further investigation to direct rehabilitation efforts.
Kinematics
Most of the reviewed kinematic analyses focused on active or passive range of motion of the wrist or on reach-to-grasp tasks. The included articles were primarily from cross-sectional studies and longitudinal study designs. Use of technology, such as 3D motion tracking, was limited to gross movement and was not used to examine movement of the fingers. Greater range of motion was associated with higher motor function and 3D kinematic analyses were successfully used to discriminate between children with different MACS levels.
Results for PROM of the paretic wrist tended to show normal ranges, similar to those of the non-paretic hand or TD children. The typical PROM and the lack of contractures in the evaluated children may be explained by several factors. Contractures and reduced PROM generally develop over time; four of these articles had participant groups with mean ages of 5 [48], 9 [45, 46], and 13 [44]. Many of these participants would not be old enough yet to develop significant contractures. Additionally, three of these studies focused on children with mild to moderate hand dysfunction (MACS I, II and III or Zancolli I, IIA, and IIB) [44–46]. PROM reduction may be greater in children with hCP who have greater hand impairment and thus are less likely to use the hand. Also, children who had undergone hand surgery or botulinum toxin injections in the previous six months were explicitly excluded in two studies, potentially excluding participants with reduced PROM or contractures [44, 45]. The AROM of the paretic wrist, in contrast, could be quite limited. Greater wrist AROM was associated with higher function [48, 51], as determined by the MACS or Zancolli scales.
Examination of finger and thumb movement was quite limited. The use of available measurement sensors and technologies could facilitate fully three-dimensional kinematic analyses of digit motion. Simultaneous tracking of individual digits, for example, would allow evaluation of finger individuation and fine motor control.
Sensory perception
Two-point discrimination was the most common sensory perception measure identified in the included articles. It was evaluated in 24 articles, including both cross-sectional studies and longitudinal interventions.
Comparison of study results across these articles, however, was hampered by the range of equipment and techniques employed to measure 2PD. For example, several studies tested moving 2PD, for which the two points of contact are moved across the skin, while others measured static 2PD, for which the two points remain in fixed locations. In general, studies reported that children with hCP frequently have impaired 2PD ability compared to TD children. Unlike the strength values, however, the 2PD values do not appear to vary much with age for either the paretic or non-paretic hand. It should be noted that participants 6–8 years old may give relatively unreliable results (35%of subjects) and those less than 6 years old may give very unreliable results (44%) [84, 89], which means that 2PD tests may not be appropriate for young children. For children older than 8 years, it would be beneficial in future studies to have the 2PD test applied and assessed via a more standardized method.
Functional performance
Clinical evaluation of task performance was the most widely reported measure of hand ability in children with hCP. These measures were reported primarily in articles based on cross-sectional study designs and longitudinal interventions. The use of standardized instruments, such as the JTTHF and BBT, facilitated aggregating data in order to examine performance across a large cohort and range of ages. General trends showed that older children with hCP typically performed better on the tasks with their paretic hand than younger children with hCP, although scores continued to lag in those of the non-paretic hand or of TD children. In contrast to the strength measurements, the deficits of the paretic hand relative to scores of the TD hand tend to decrease with age. Part of the reduction may be attributable to a ceiling effect for time to perform a task (e.g., JTTHF) or number of objects that can be moved (e.g., PPT). Additionally, or alternatively, older children may have better learned how to best exploit existing capabilities of the paretic limb to perform tasks.
The clinical instruments included in this review place different relative requirements on hand and arm control and their coordination. The PPT, for example, may require considerable arm and trunk control to position the hand away from the body to complete the task. Similarly, the BBT was highly reliant on arm movement. The score increases seen with age for these measures may result in part from improved motor control of the arm and the rest of the body rather than improved control of the hand. Interestingly, while the aggregated data largely showed deficits in the paretic hand in BBT scores in comparison with the non-paretic hand, some investigators have reported no difference between performance with the two hands [92]. Further studies examining BBT scores across various ages and skill levels for children with hCP would help to better establish performance outcomes.
Other measures may better capture fine manual dexterity. The 9-hole peg test and modified 9-hole peg test focus more specifically on the hand by employing smaller boards that do not require extensive reaching away from the body. Several of the tasks of the JTTHF similarly focus on precise finger movements with limited arm movement. For the articles included in this review, the JTTHF was the instrument used most often. It has the added advantage that normalized data for the JTTHF have been produced for age ranges 5–19 years old in TD children [154, 155].
Limitations
While the review focused on measures that have been shown to have good reliability when aggregating data from different studies (e.g., BBT, grip strength, JTTHF), various techniques may have been used by different investigators. As this was a scoping review, there was no critical appraisal of the included studies. As quality appraisal was not performed, some of the data sets included may not be as reliable as others. This risk is mitigated in part by the high inter-rater and intra-rater reliability inherent in a number of these measures, especially the clinical assessments and functional evaluations. Also, the presentation of aggregated data helps to identify potential outliers. A total of 196 identified studies had to be excluded from assessment for this review due to lack of reported data, the reporting of only post-intervention data, heterogeneous subject pools (including multiple patient populations), or the inclusion of data from adults with CP. Unfortunately, it was not possible to include studies not available in English. The exclusion of these articles may limit the applicability of the results in regions where scientific literature is not generally published in English. The large majority of articles identified by the searches, however, were available in English (22 of the 1536 articles were not available in English). Future work would ideally include all articles regardless of language.
Conclusions
Despite the profound functional role of the hand, sensorimotor characteristics of it have been studied to a lesser extent than those for the rest of the arm in children with hCP. The specific impairment mechanisms of the hand are not completely understood, thereby limiting the capacity to target therapy for the individual. Data were especially limited for kinematics and kinetics of individual fingers and the thumb and both voluntary and reflexive muscle activation patterns. These data are needed to better mitigate possibly life-long disabilities.
Conflict of interest
The authors have no conflict of interest to report.
Funding
The authors received no financial support for the publication of this article.