
Abstract
PURPOSE:
Down Syndrome (DS) is a common genetic disorder caused by trisomy 21. Due to cognitive challenges associated with DS, individuals often experience difficulty performing activities of daily living (ADLs), at levels that can range from mild to significant. This study aimed to measure psychometric properties of the Italian version of the Pediatric Evaluation of Disability Inventory (PEDI-I) in the DS population.
METHODS:
The PEDI-I was administered to children with DS. The internal consistency was examined using Cronbach’s Alpha. Test-retest reliability was demonstrated by intraclass correlation coefficient (ICC) and Bland–Altman plots. The concurrent validity was evaluated with the Italian version of the Barthel Index.
RESULTS:
The PEDI-I was administered to 54 children with DS. Cronbach’s Alpha showed statistically significant values (0.899 –0.986). The ICC confirmed the reproducibility of the scale with a range of (0.988 –1), while Bland-Altman plots showed a smallest detectable change of (0.18–1.63). The Pearson Correlation Coefficient with the Barthel Index showed statistically significant values for all PEDI-I subscales (range 0.75–0.95).
CONCLUSION:
The study provides evidence of good test-retest reliability and convergent validity when used in children with DS. Other psychometric proprieties need to be investigated in future studies.
Introduction
Down Syndrome (DS) is a common genetic disorder caused by trisomy 21. DS is characterized by several dysmorphic features, including a small chin, slanted eyes, poor muscle tone, flat nasal bridge, a single crease of the palm, and a protruding tongue due to a small mouth and relatively large tongue [1, 2]. Individuals with DS typically have developmental delays and mild-to-moderate intellectual disability [3].
Children with DS, in correlation with their cognitive skills, have significant difficulty in performing activities of daily living (ADLs), according to their cognitive skills [4]. It is important to investigate this aspect within a conceptual framework based on the International Classification of Functioning, Disability, and Health (ICF) [5]. For DS, examples of appropriate assessment for body function and structure could include different strategies and outcome measures, such as range of motion using goniometric measurements or the Gross Motor Function Measure (GMFM) [6]. The GMFM is an assessment tool generally used in children with Cerebral Palsy; however, Palisano and colleagues studied and created gross motor function growth curves for children with DS [7]. Different assessment tools, such as Vineland Adaptive Behaviour Scale (VABS) [8], the Battelle Developmental Inventory (BDI) [9], the Functional Independence Measure for Children (WeeFIM) [10–12]and the Pediatric Evaluation of Disability Inventory (PEDI) [13], are used to investigate Activity and Participation in ICF domains. A systematic review revealed that assessment tools that can measure the consequences of developmental disabilities in young children, such as the PEDI, need to be further studied [14]. However, the PEDI showed a good correlation with the ICF framework [15], and proved to be a useful instrument for the evaluation of children with DS [13]. Thus, there are no validation studies of the PEDI specific for persons with DS.
The PEDI [16] was developed by Haley and fellows in the New England Medical Center Hospital (Boston). It evaluates and measures performance and functional ability in children with physical and cognitive disabilities, aged six months to 7.5 years. PEDI is widely used in different countries such as Norway [17], Germany [18], China [19], Uganda [20], and Netherlands [21]. Recently, Murgia and colleagues [22] have validated PEDI in an Italian healthy population (PEDI-I), in children with Spastic Cerebral Palsy, and in those with autism [23]. PEDI-I showed good psychometric properties and usefulness in measuring functional abilities in the target population [22].
However, to better understand functional skills in children with DS, a specific population cross-sectional study is required. As previously outlined, there is no study investigating the psychometric proprieties of PEDI with DS, despite its use for this population in Norway [13, 24], Netherlands [25], and Brazil [26]. It is important that rehabilitation professionals understand how the PEDI subscales work.
The objective of this study is to investigate the internal consistency, test-retest reliability, and convergent validity of the PEDI-I in an Italian population with DS. The a priori hypothesis for convergent validity was the existence of a moderate to high correlation between PEDI-I and the Barthel Index because they measure similar constructs.
Methods
A cross-sectional study was designed to investigate the psychometric properties of the PEDI-I. It was conducted by a research group composed of medical doctors and rehabilitation professionals from the Rehabilitation Outcome Measure Assessment Association (R.O.M.A) and Sapienza University of Rome [27–34]. In the past few years, this group has validated several outcome measures in Italy. For the present study, an experienced neurologist and two experienced occupational therapists were involved in administering the PEDI-I in hospital and community settings. They have experience in using the PEDI-I for greater than 5 years in both DS and other developmental conditions. All procedures followed the ethical standards of the responsible committee on human experimentation (institutional and national) and the Helsinki Declaration of 1975, as revised in 2008. All recruited parents were informed about the aims and methods of the study and those who were interested signed informed consent [35, 36].
Participants
For the present investigation, it was determined that at least 50 patients were required according to previous validation studies regarding the same tool. Recruitment strategies aimed to enroll people in both the hospital and community setting. Thus, for hospitals, different meetings for both in-patient and out-patient rehabilitation services were organized, while for the community setting, the research group sent an e-mail invitation to the Associations of People with DS. The subjects were recruited from March to October 2018 through the “Vaclav Vojta” rehabilitation center and the San Raffaele Pisana in Rome, the AMAR Down association of Martina Franca, and the Italian Down People Association of Catanzaro, Reggio Calabria, Trento, and Belluno. The test-retest reliability was evaluated on a sub-sample represented by the first 30 parents evaluated for this study by administering the PEDI-I twice after three days again. To be enrolled in the study, participants had to fit the following inclusion criteria: diagnosis of DS; aged between six months and 7.5 years; or aged greater than 7.5 with functional abilities below those expected in a typically developing 7.5-year-old typically developing child, according to Diagnostic criteria for intellectual disability (DSM V) [37]. The mean (Standard Deviation) age for the total sample was 5.62 (4.03) years and was equally distributed for gender. A child neurologist clinically determined the cognitive rating with the Mini-Mental State Pediatric Examination (MMSPE) [38, 39]. The majority of the sample (88.9%) had a mild delay. The distribution of DS types was trisomy 21 (90.7%), mosaic type (5.6%), and translocation type (3.7%).
Data measurements
PEDI-I
The PEDI-I contains three scales that may be used together or individually: 1) the Functional Skills Scale (FSS) that identifies clinical patterns of deficiencies in functional skill attainment; 2) the Caregiver Assistance Scale (CAS) that indirectly measures capability and evaluates actual performance by assessing the extent of help a parent provides in daily functioning; and, 3) the Modification Scale (MS) which is a frequency count on the type and extent of environmental modifications that support functional performance. Each scale includes the domains of self-care, mobility, and social function. FSS consists of 197 items in total, divided as 73 items in self-care, 59 items in mobility, and 65 items in social function. Each item in this latter scale is scored as unable (0) or able (1) [16]. CAS consists of 20 items, divided as 8 items in self-care, 7 items in mobility, and 5 items in social function. Caregiver assistance for each item is rated from 5 (independent) to 0 (totally dependent), yielding an aggregate score for each domain [16]. MS consists of the same 20 items as the CAS section, which are rated on the modifications element (i.e., the environmental or technical adaptations required to facilitate performance): N (none); C (child-oriented modification); R (rehabilitation equipment or assistive devices required); or E (extensive modifications required). The modification section of the PEDI is a frequency count regarding the type and extent of environmental changes the child is dependent on to support their functional performance [40]. PEDI is user friendly and can be administered by parents, caregivers, or therapists. Scores are distributed from 0–100, where higher scores represent greater functionality.
IcaBI
The Italian version of the Barthel Index (IcaBI) [41–43] includes ten ADL categories. The individual is scored by their degree of independence in performing each item. The original 10-item form includes: feeding, bathing, grooming, dressing, bowel and bladder control, toilet use, transfers (bed to chair and back), mobility, and stair climbing. Items are rated by task performance independently, with assistance, or total dependence (scored as 0, 5, or 10; 15 points per item for transfers and mobility). As reported in the literature, the Barthel Index has no age limit and is used in developmental disabilities.
Procedures and data analysis
First, three experienced researchers (a neurologist and two occupational therapists) independently assessed parents of children with DS according to the aforementioned inclusion criteria. The research group explained the objective of the study to the legal guardians of the participants, who then signed the informed consent on behalf of their children [35, 36]. All participants were asked to complete a socio-demographic questionnaire followed by administering the PEDI-I and the IcaBI assessments. The researcher who administered the PEDI-I was blinded from the one who administered the IcaBI.
Reliability
The Cronbach’s alpha was used to examine the PEDI-I’s internal consistency to obtain an indication of the correlation of items within the scale. In line with Nunnally, Cronbach’s alpha of 0.70 or higher was considered sufficient [44].
The intraclass correlation coefficient (ICC) and the absolute measurement error in the form of a Bland-Altman plot were calculated to assess test-retest reliability. In a sub-sample represented by the first 30 parents evaluated for this study, the same participant (parent) was evaluated twice by the same professional. The second evaluation was scheduled three days after the first interview to ensure that no clinical changes occurred. This time frame was appropriate and in line with previous validation studies [20, 45]. As recommended in the literature, a minimum sample size of 30 individuals was considered adequate [46]. ICC ranges from 0 (no agreement) to 1 (perfect agreement) and was interpreted as follows: 0.00–0.25 = little, if any, correlation; 0.26–0.49 = low correlation; 0.50–0.69 = moderate correlation; 0.70–0.89 = high correlation; and 0.90–1 = very high correlation [47].
Authors used the Bland-Altman plot to describe agreement between the two administrations. These statistical limits are calculated by using the mean and the standard deviation(s) (SD) of the differences between two measurements. The distance between the upper or lower limit of agreement and the mean value reflects the smallest detectable change (SDC). The SDC on a measurement scale is the amount of difference for which anything smaller cannot be reliably distinguished from random error in the measurement [48]. The mean difference between test and retest scores and its SD are calculated, and the SDC is the 95% confidence interval (CI) of the difference, that is, 1.96 times the SD of the difference between scores [49].
Validity
The a priori hypothesis was the existence of a moderate to high correlation between PEDI-I sub-scales (FSS and CAS) and the IcaBI because they measure similar constructs. To evaluate convergent validity, PEDI-I and IcaBI were administered together, and the Pearson Correlation Coefficient (PCC) was calculated. It can be interpreted as follows: values between 0 and 0.3 (0 and –0.3) indicate a weak linear relationship; values between 0.3 and 0.7 (0.3 and –0.7) indicate a moderate linear relationship; values between 0.7 and 1.0 (–0.7 and –1.0) indicate a strong linear relationship [50]. All statistical analyses were carried out using the Statistical Package for Social Sciences (SPSS) version 23.0.
Results
Participants
The PEDI-I and IcaBI were administered to a sample of 54 children with DS. The characteristics of the sample for both the total and reliability sub-groups are summarized in Table 1. The sample showed that it was normally distributed. In fact, the mean, median, and mode were equal. Table 2 shows the results for the sub-scale of PEDI-I data for the whole cohort.
Characteristics of the sample
Characteristics of the sample
Results for the PEDI-I data of the whole cohort
Cronbach’s Alpha showed statistically significant values for all PEDI-I subscales because they are included in a range of good and excellent internal consistency. The results are summarized in Table 3. Reliability was determined for 30 children, and the ICC was calculated. ICC values showed a very high reliability for both FSS (0.997 –1) and CAS (0.988 –0.997). The results are summarized in Table 4. Reliability was demonstrated by the Bland–Altman plots as shown in Figs. 1–6. Table 4 shows the SDC values for every sub-scale of PEDI-I. These values range between 0.18–1.63.
Internal Consistency of the PEDI-I
Internal Consistency of the PEDI-I
*> 0.70 is sufficiently consistent
Reliability of the PEDI-I
ICC: Intraclass Correlation Coefficient; CI: Confidence Interval; SDC: smallest detectable change.
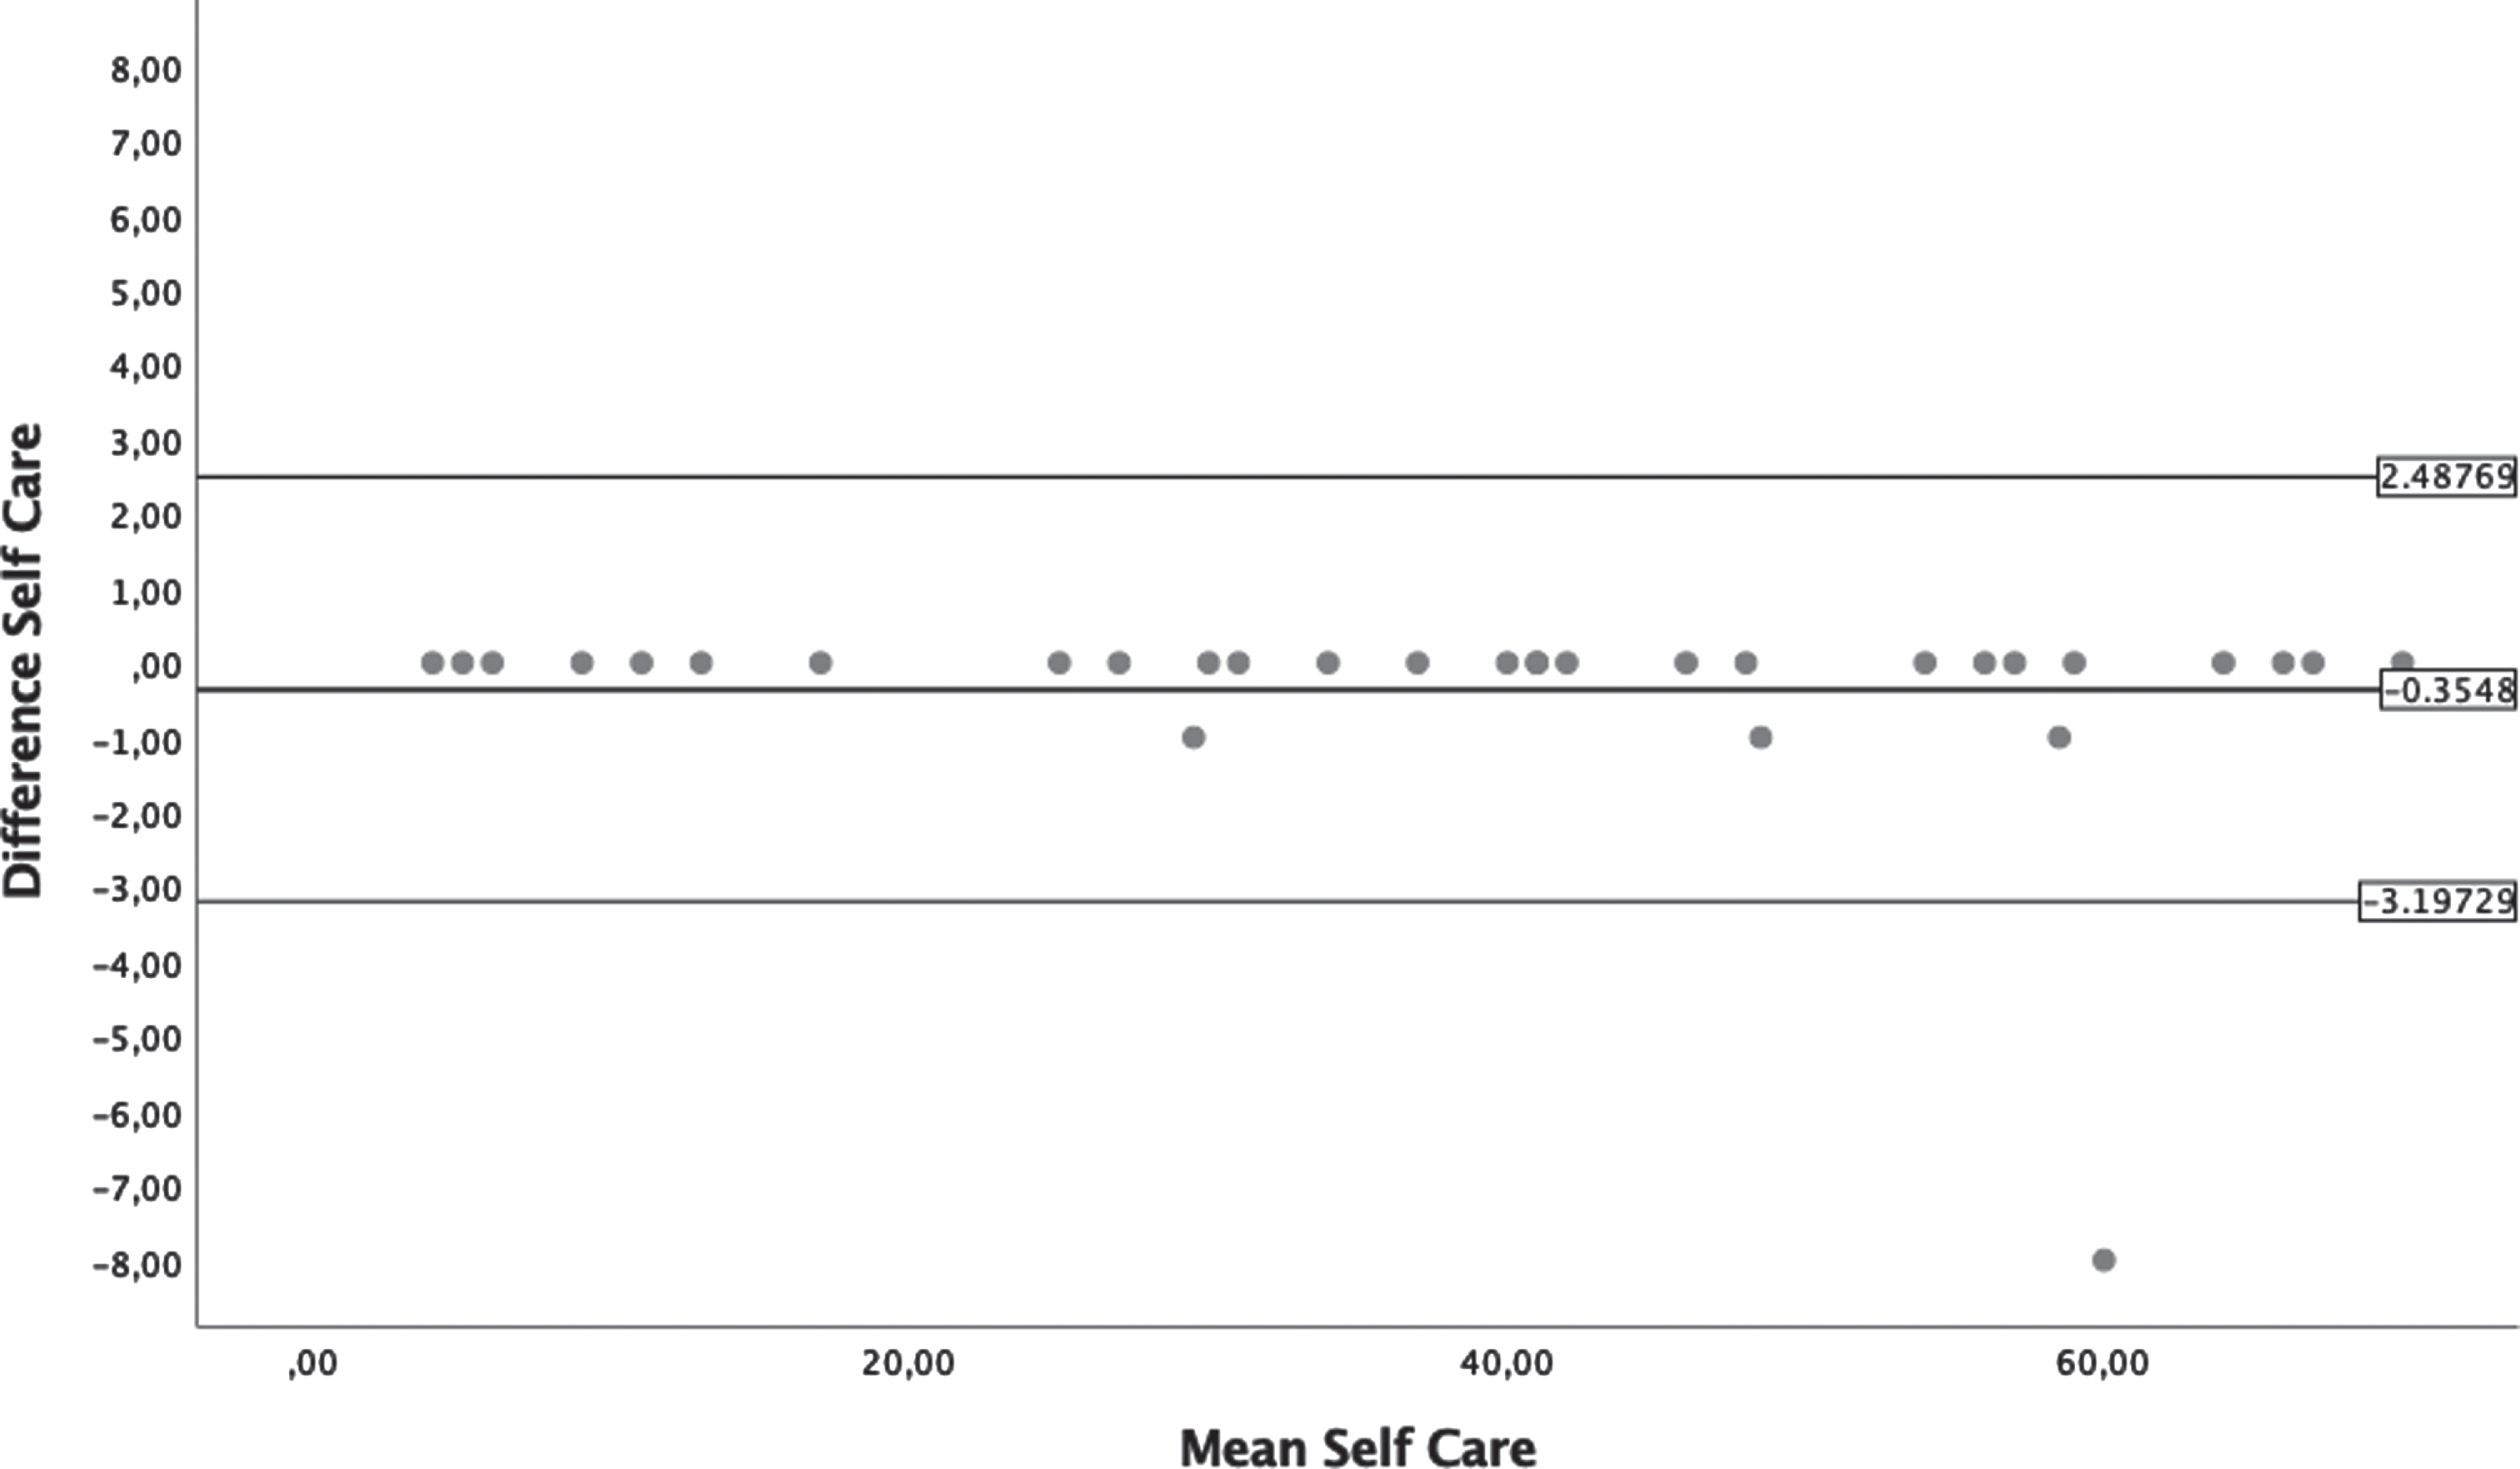
Bland-Altman plots from Self-Care section of Functional Skill Scale.
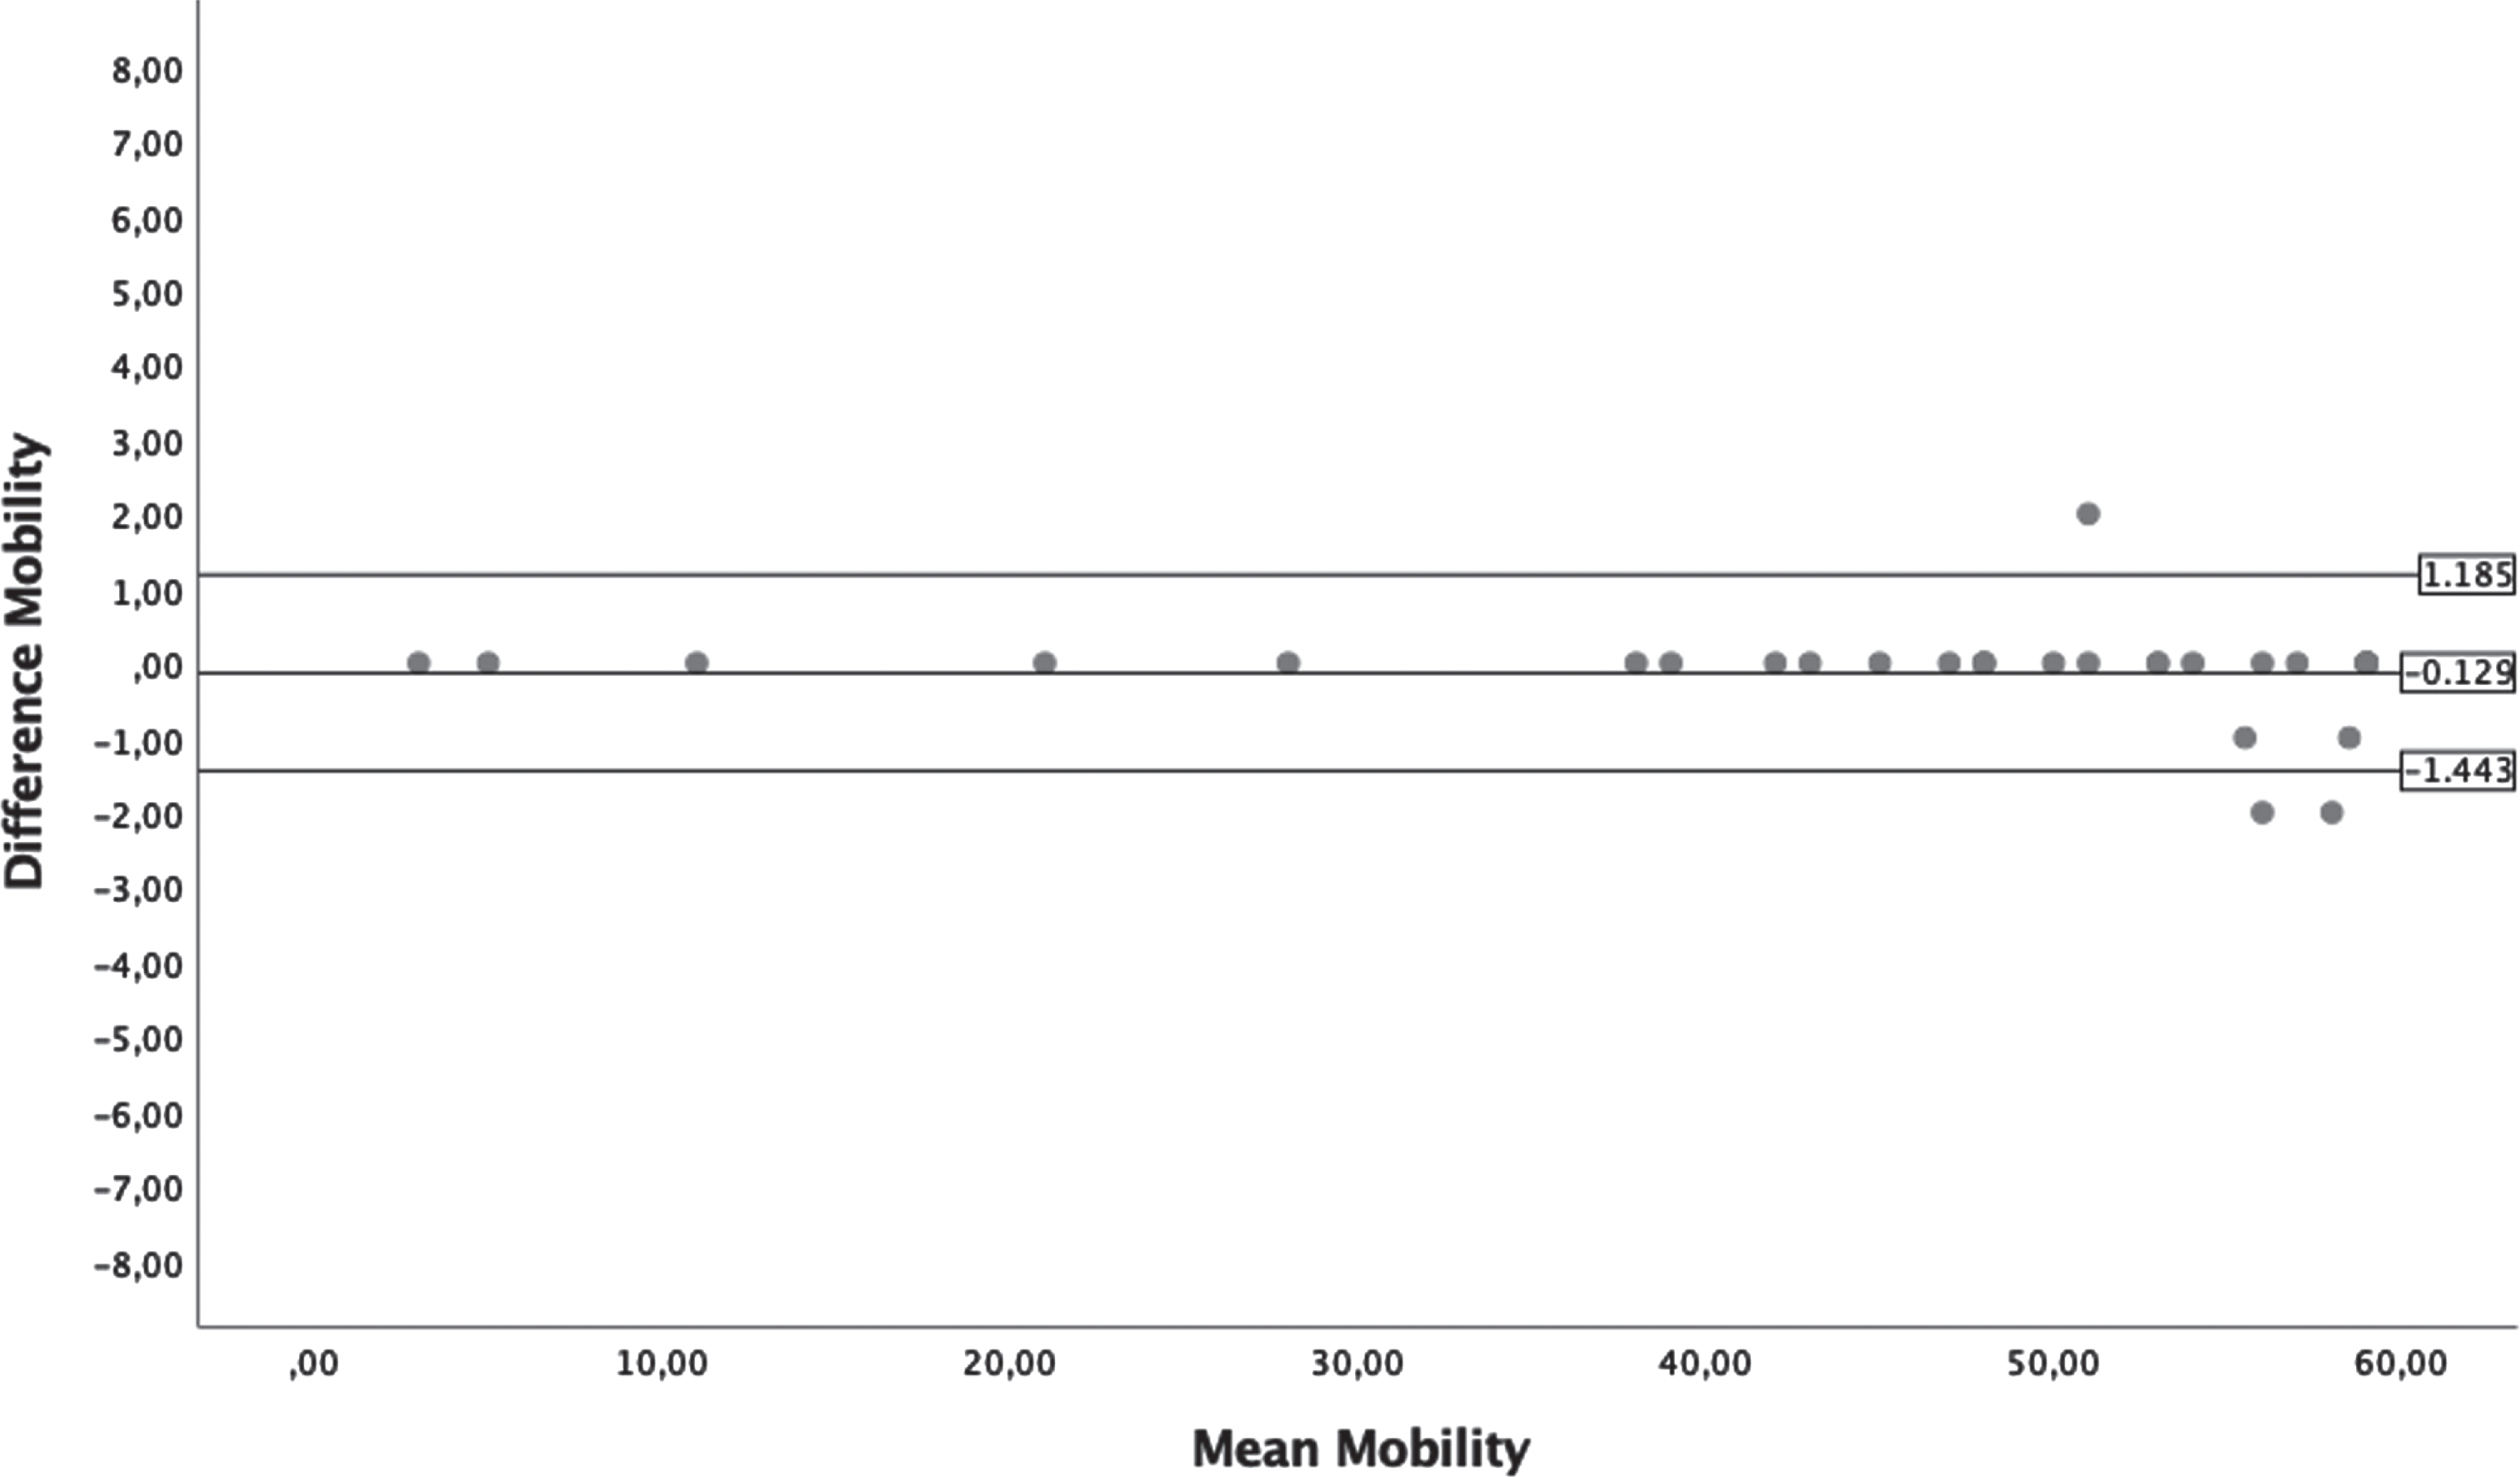
Bland-Altman plots from Mobility section of Functional Skill Scale.
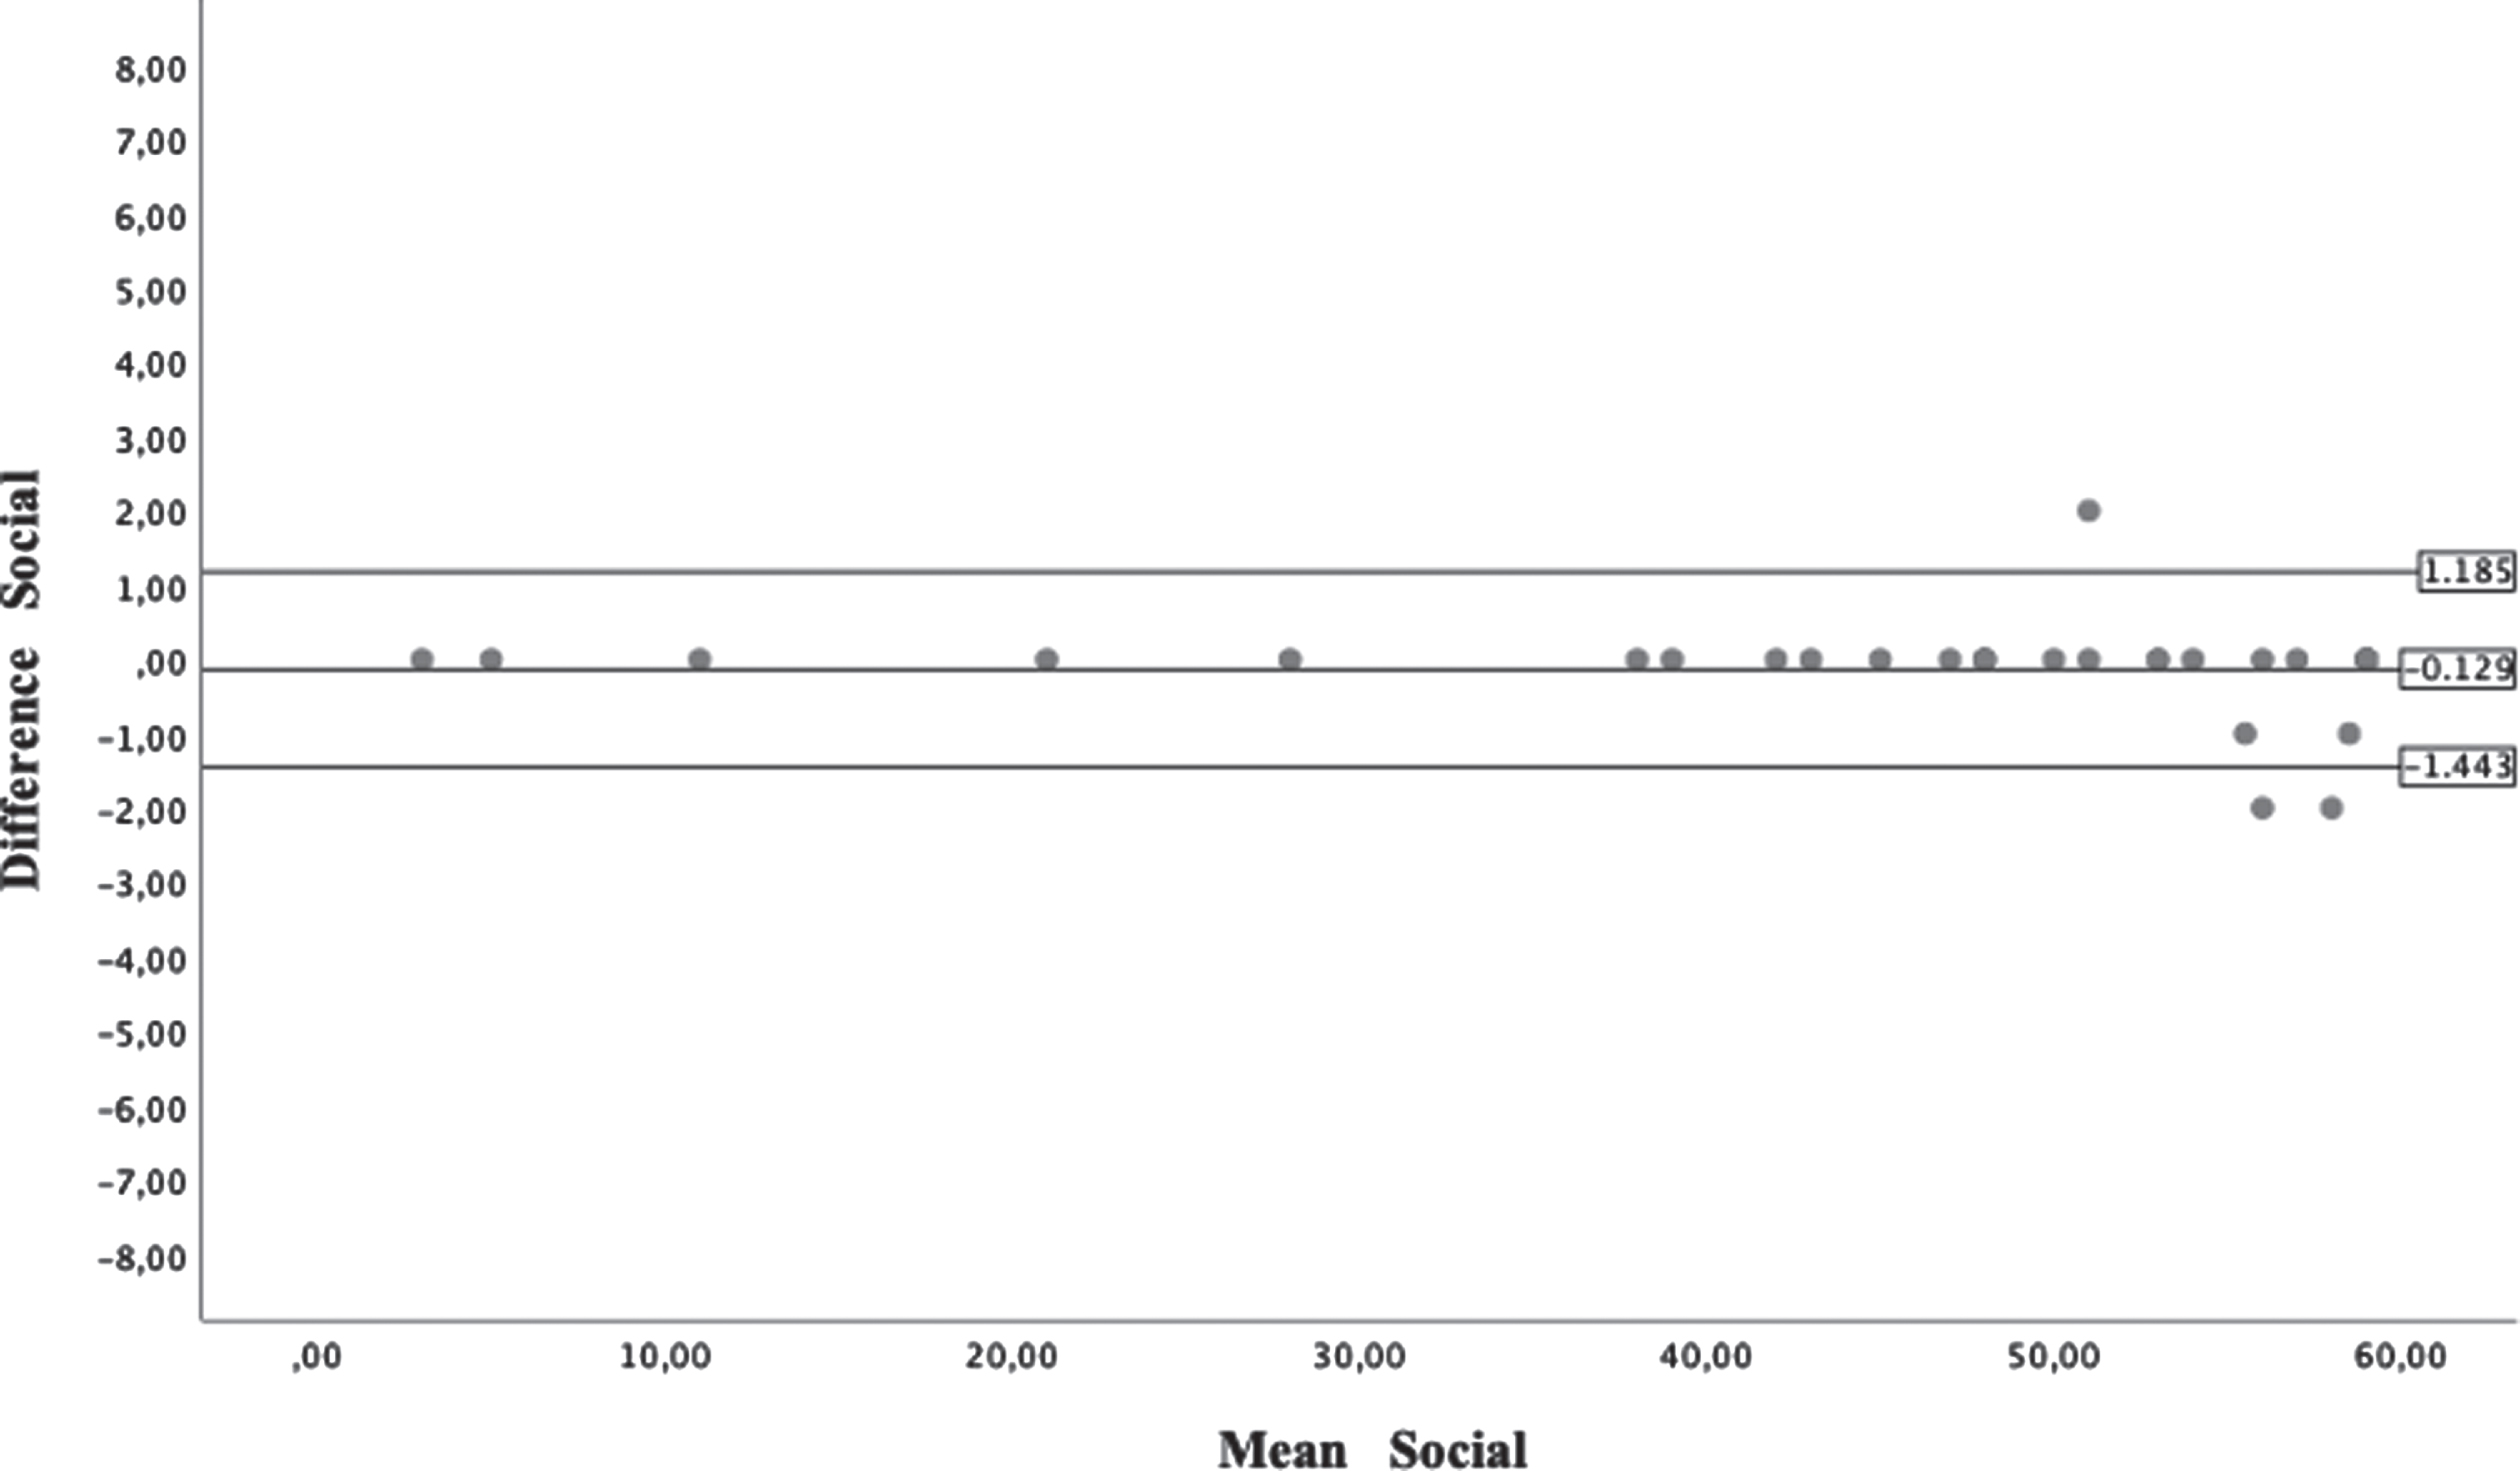
Bland-Altman plots from Social section of Functional Skill Scale.
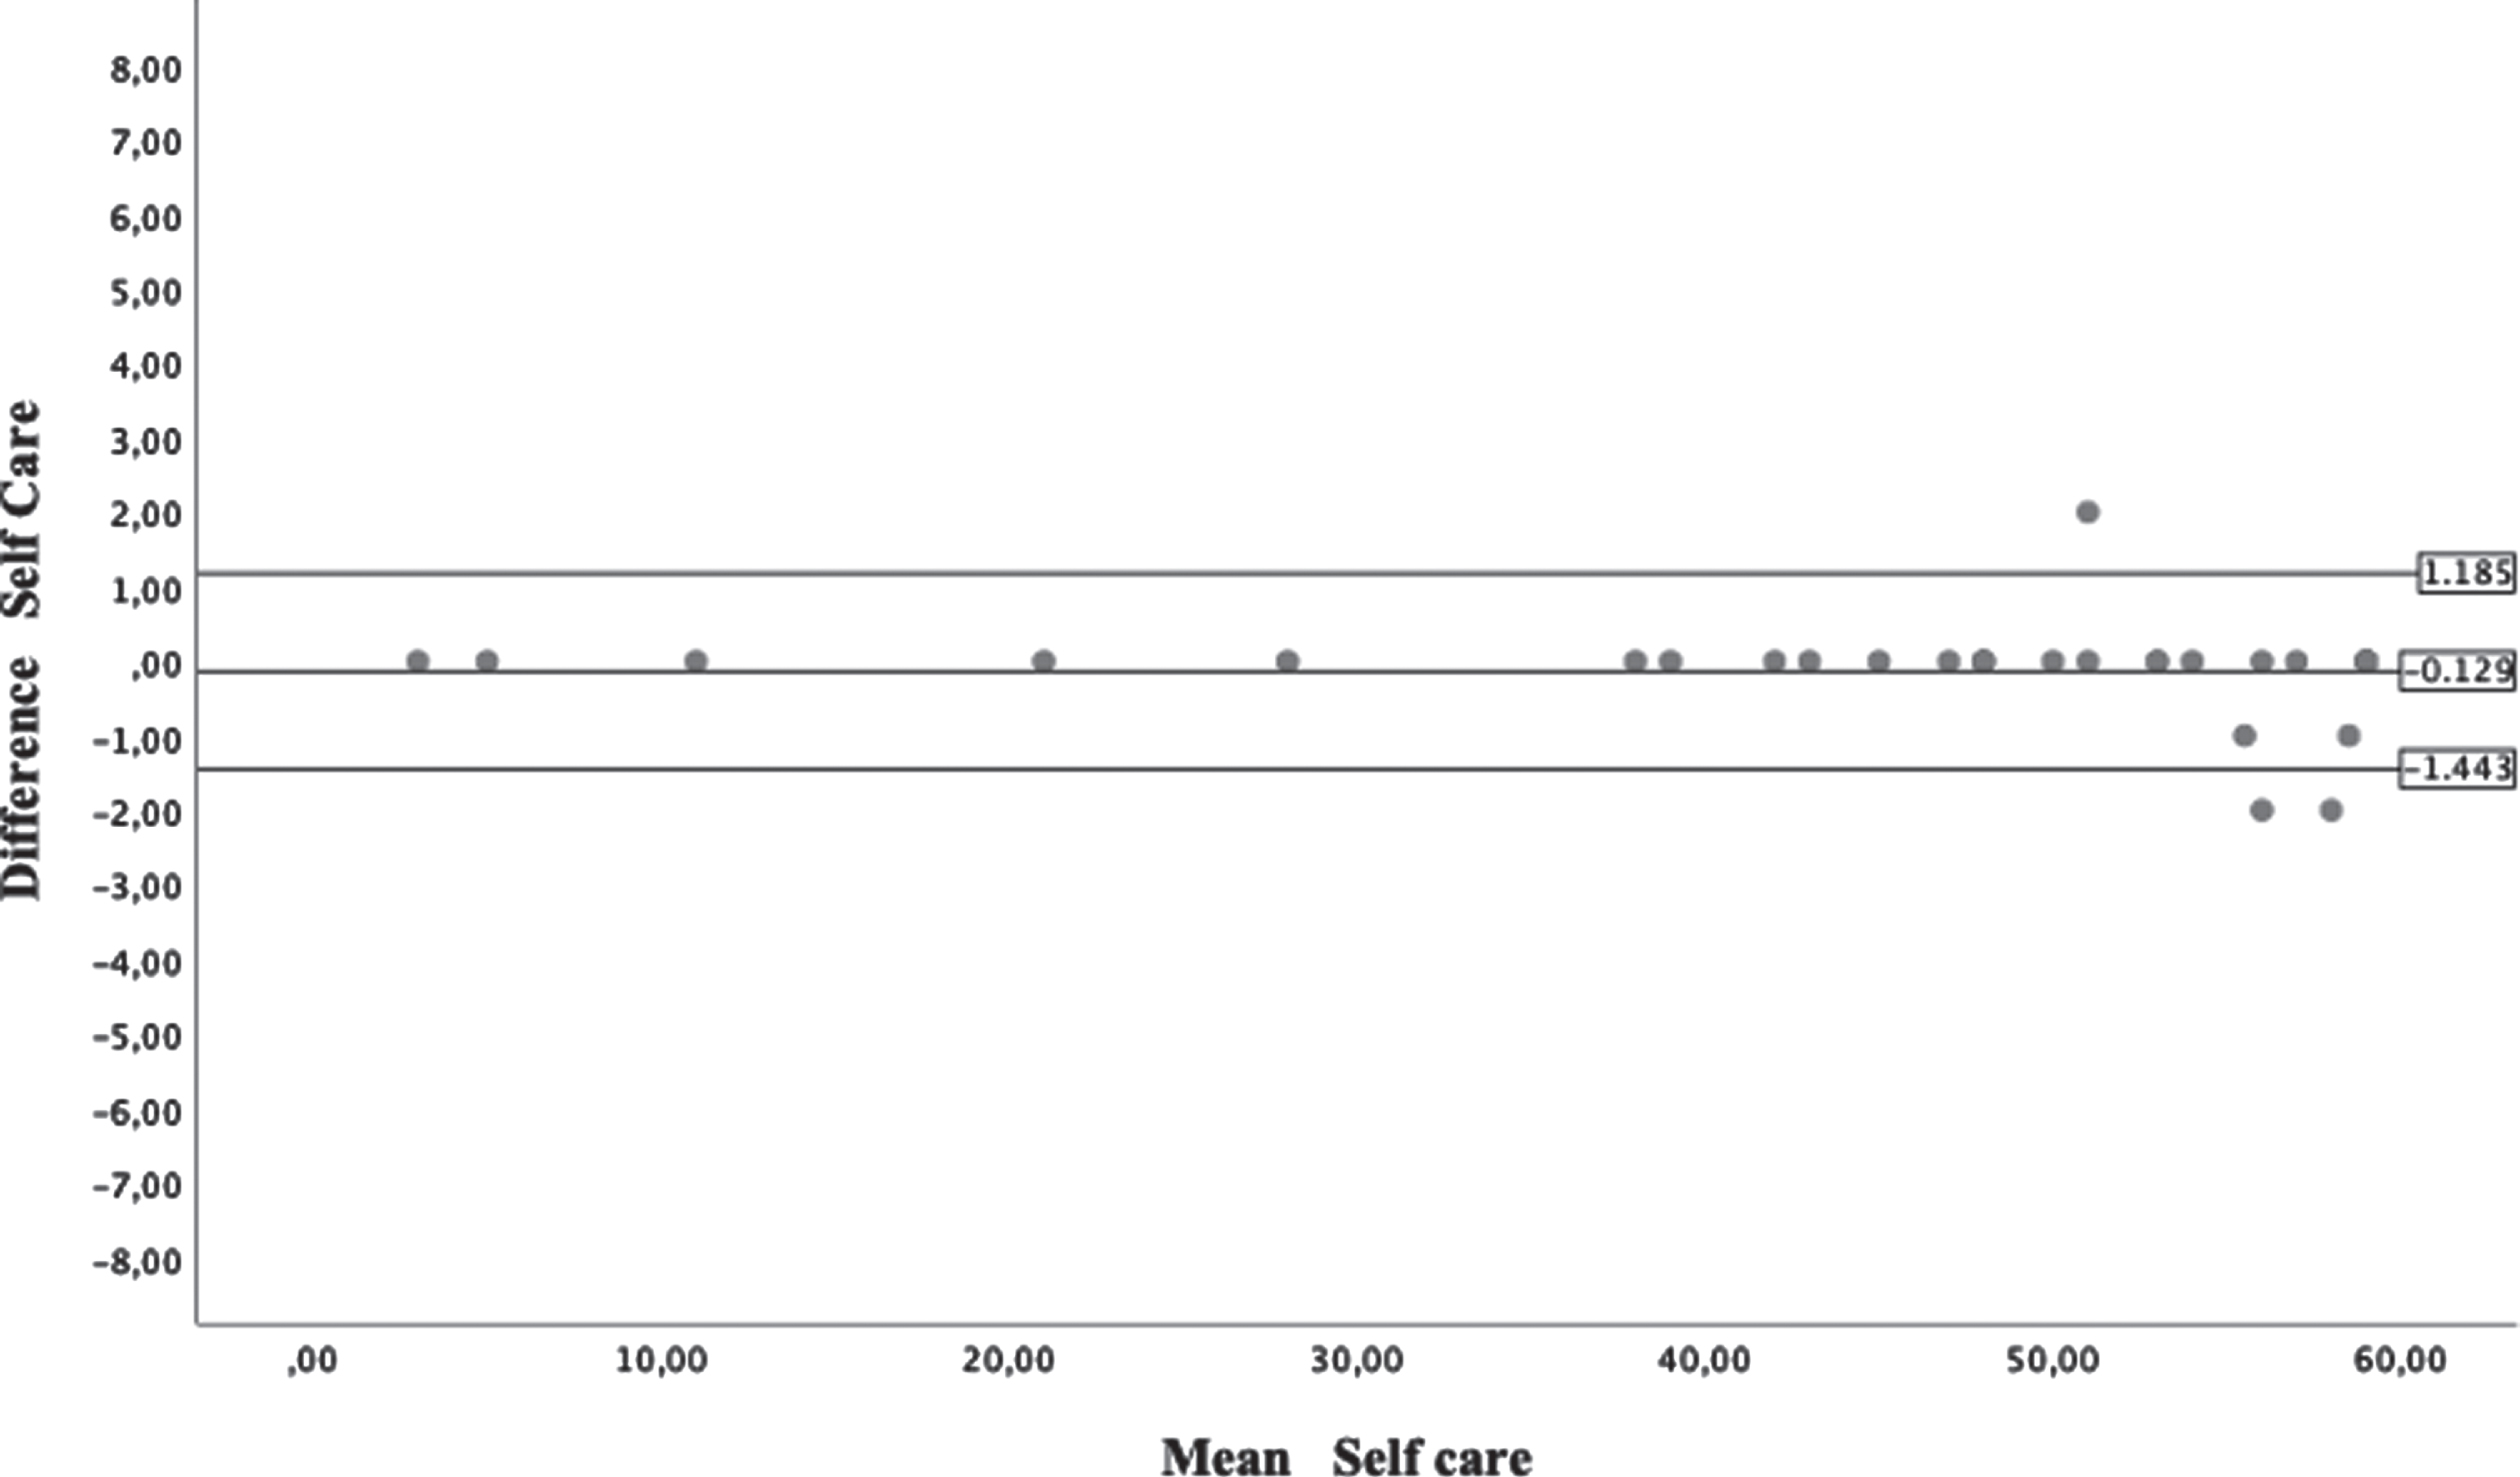
Bland-Altman plots from Self-Care section of Caregiver Assistance Scale.
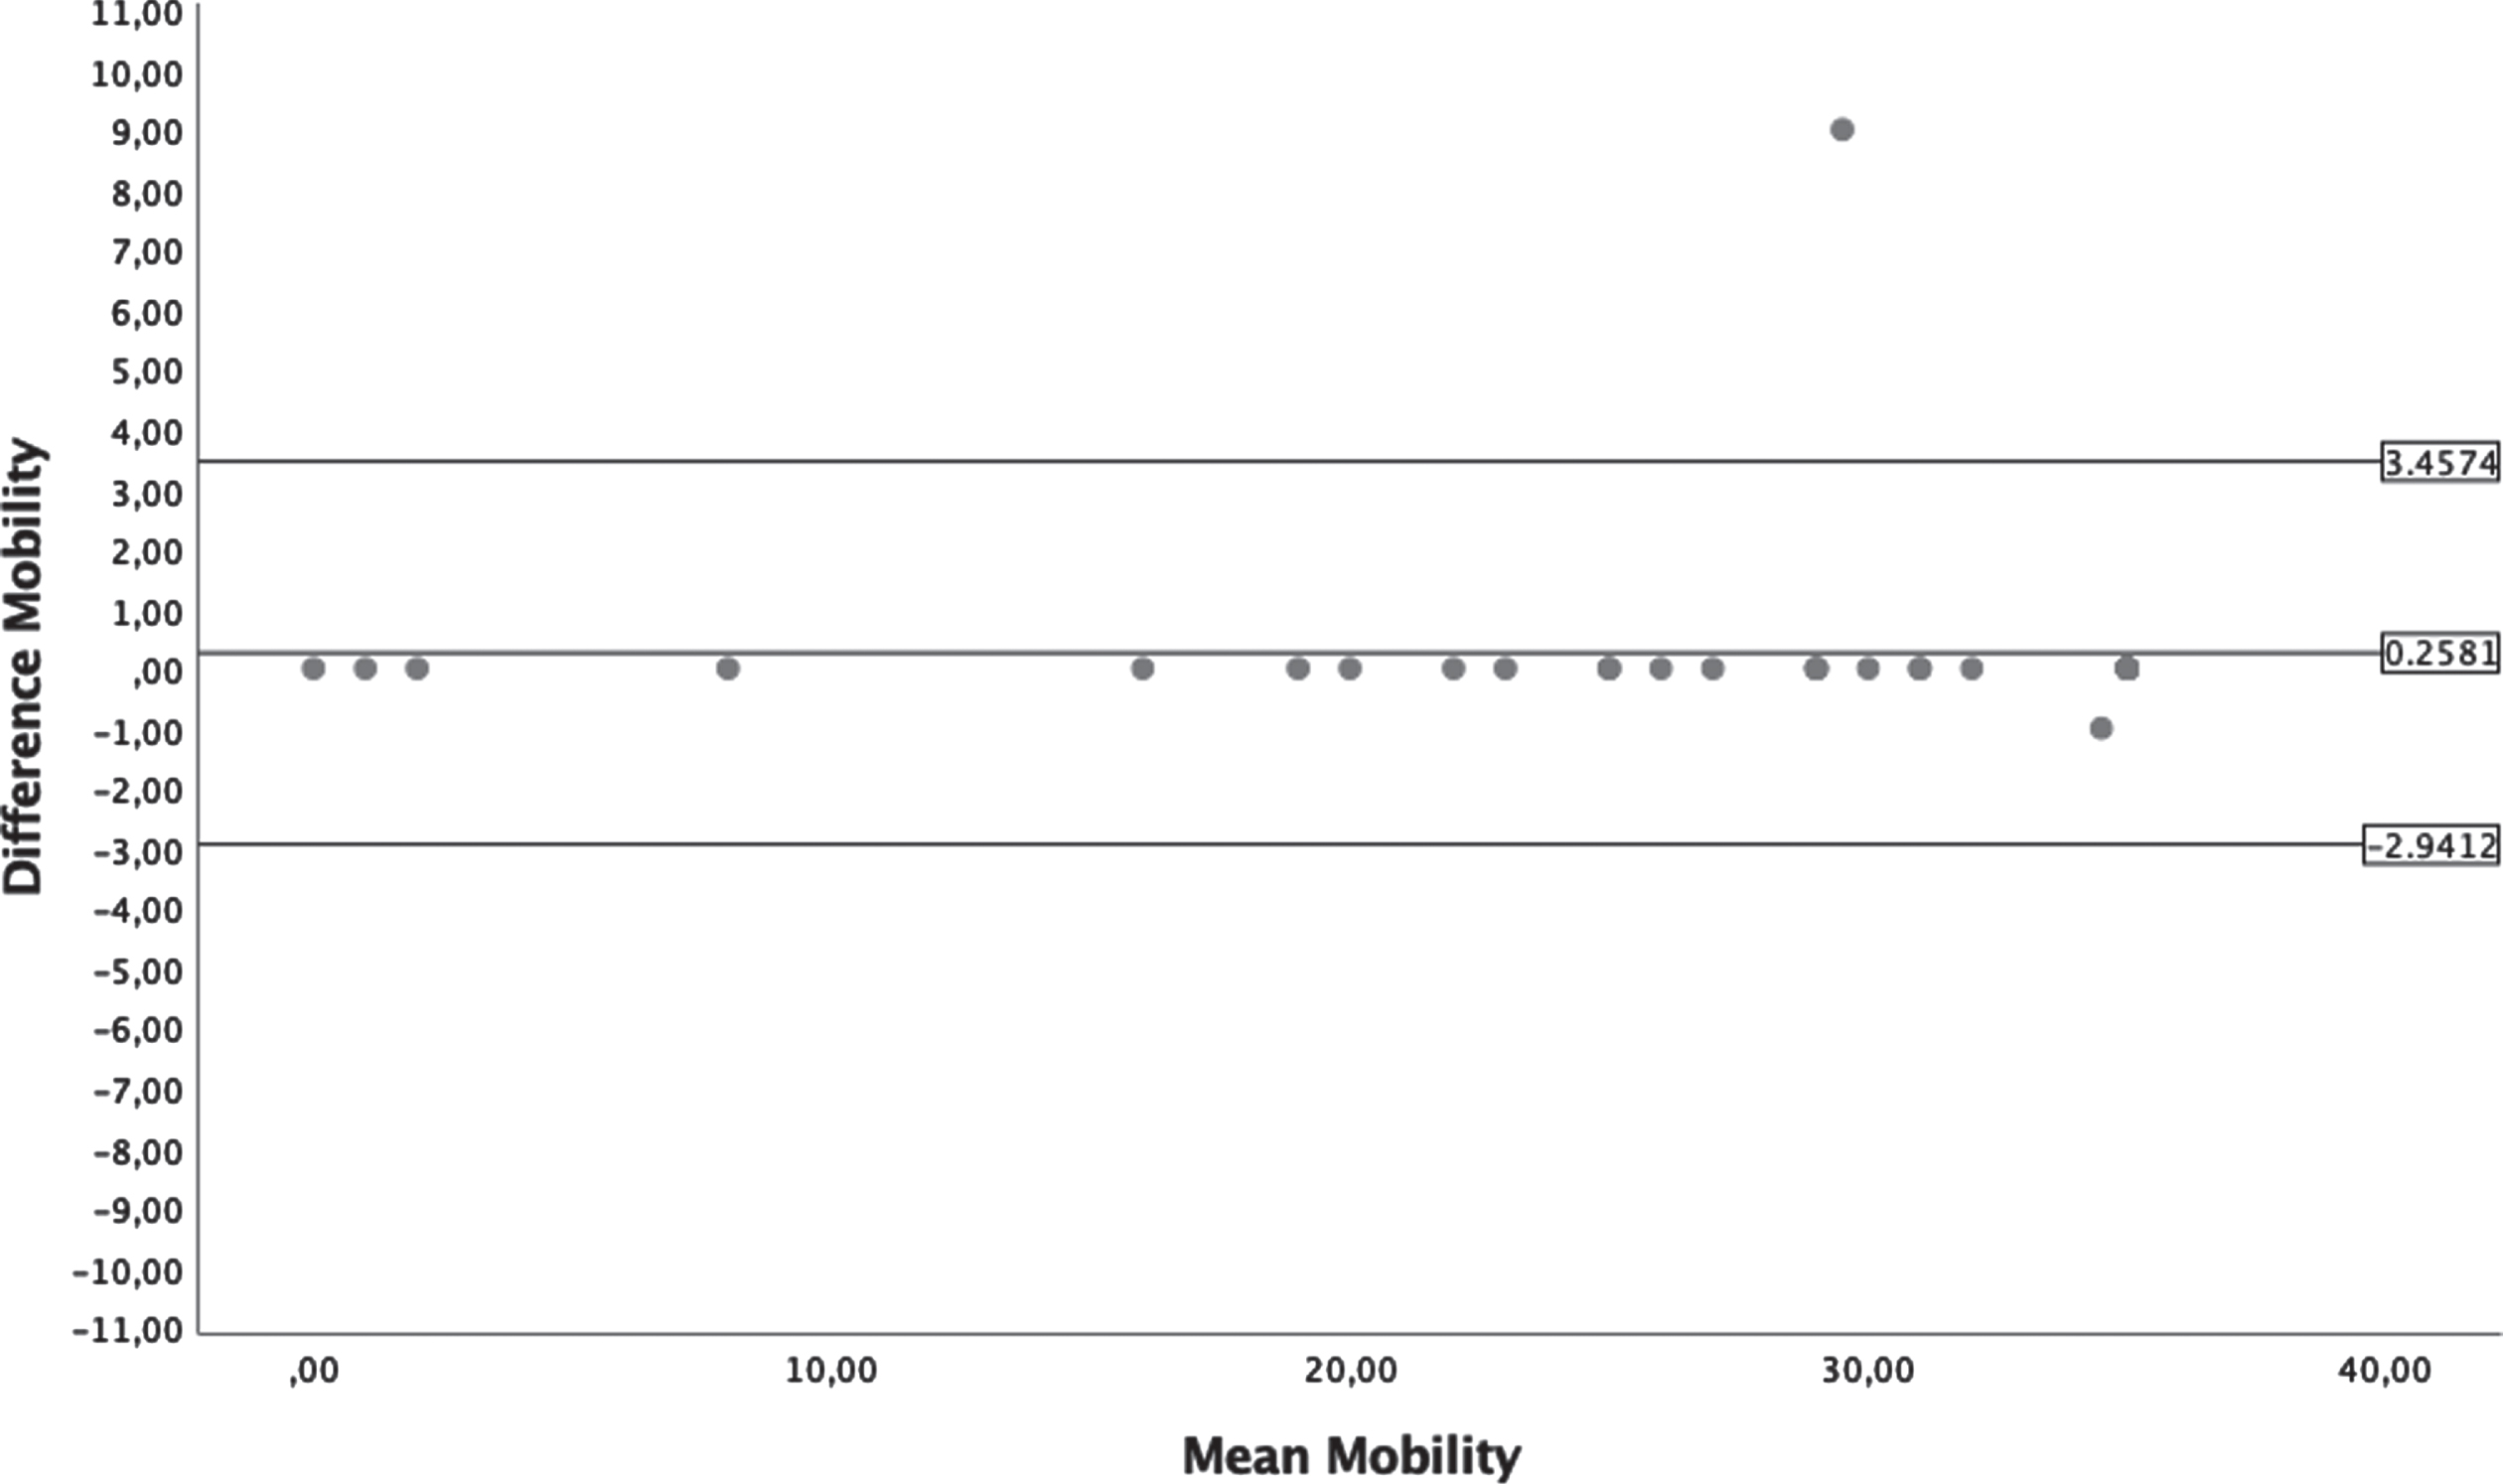
Bland-Altman plots from Mobility section of Caregiver Assistance Scale.
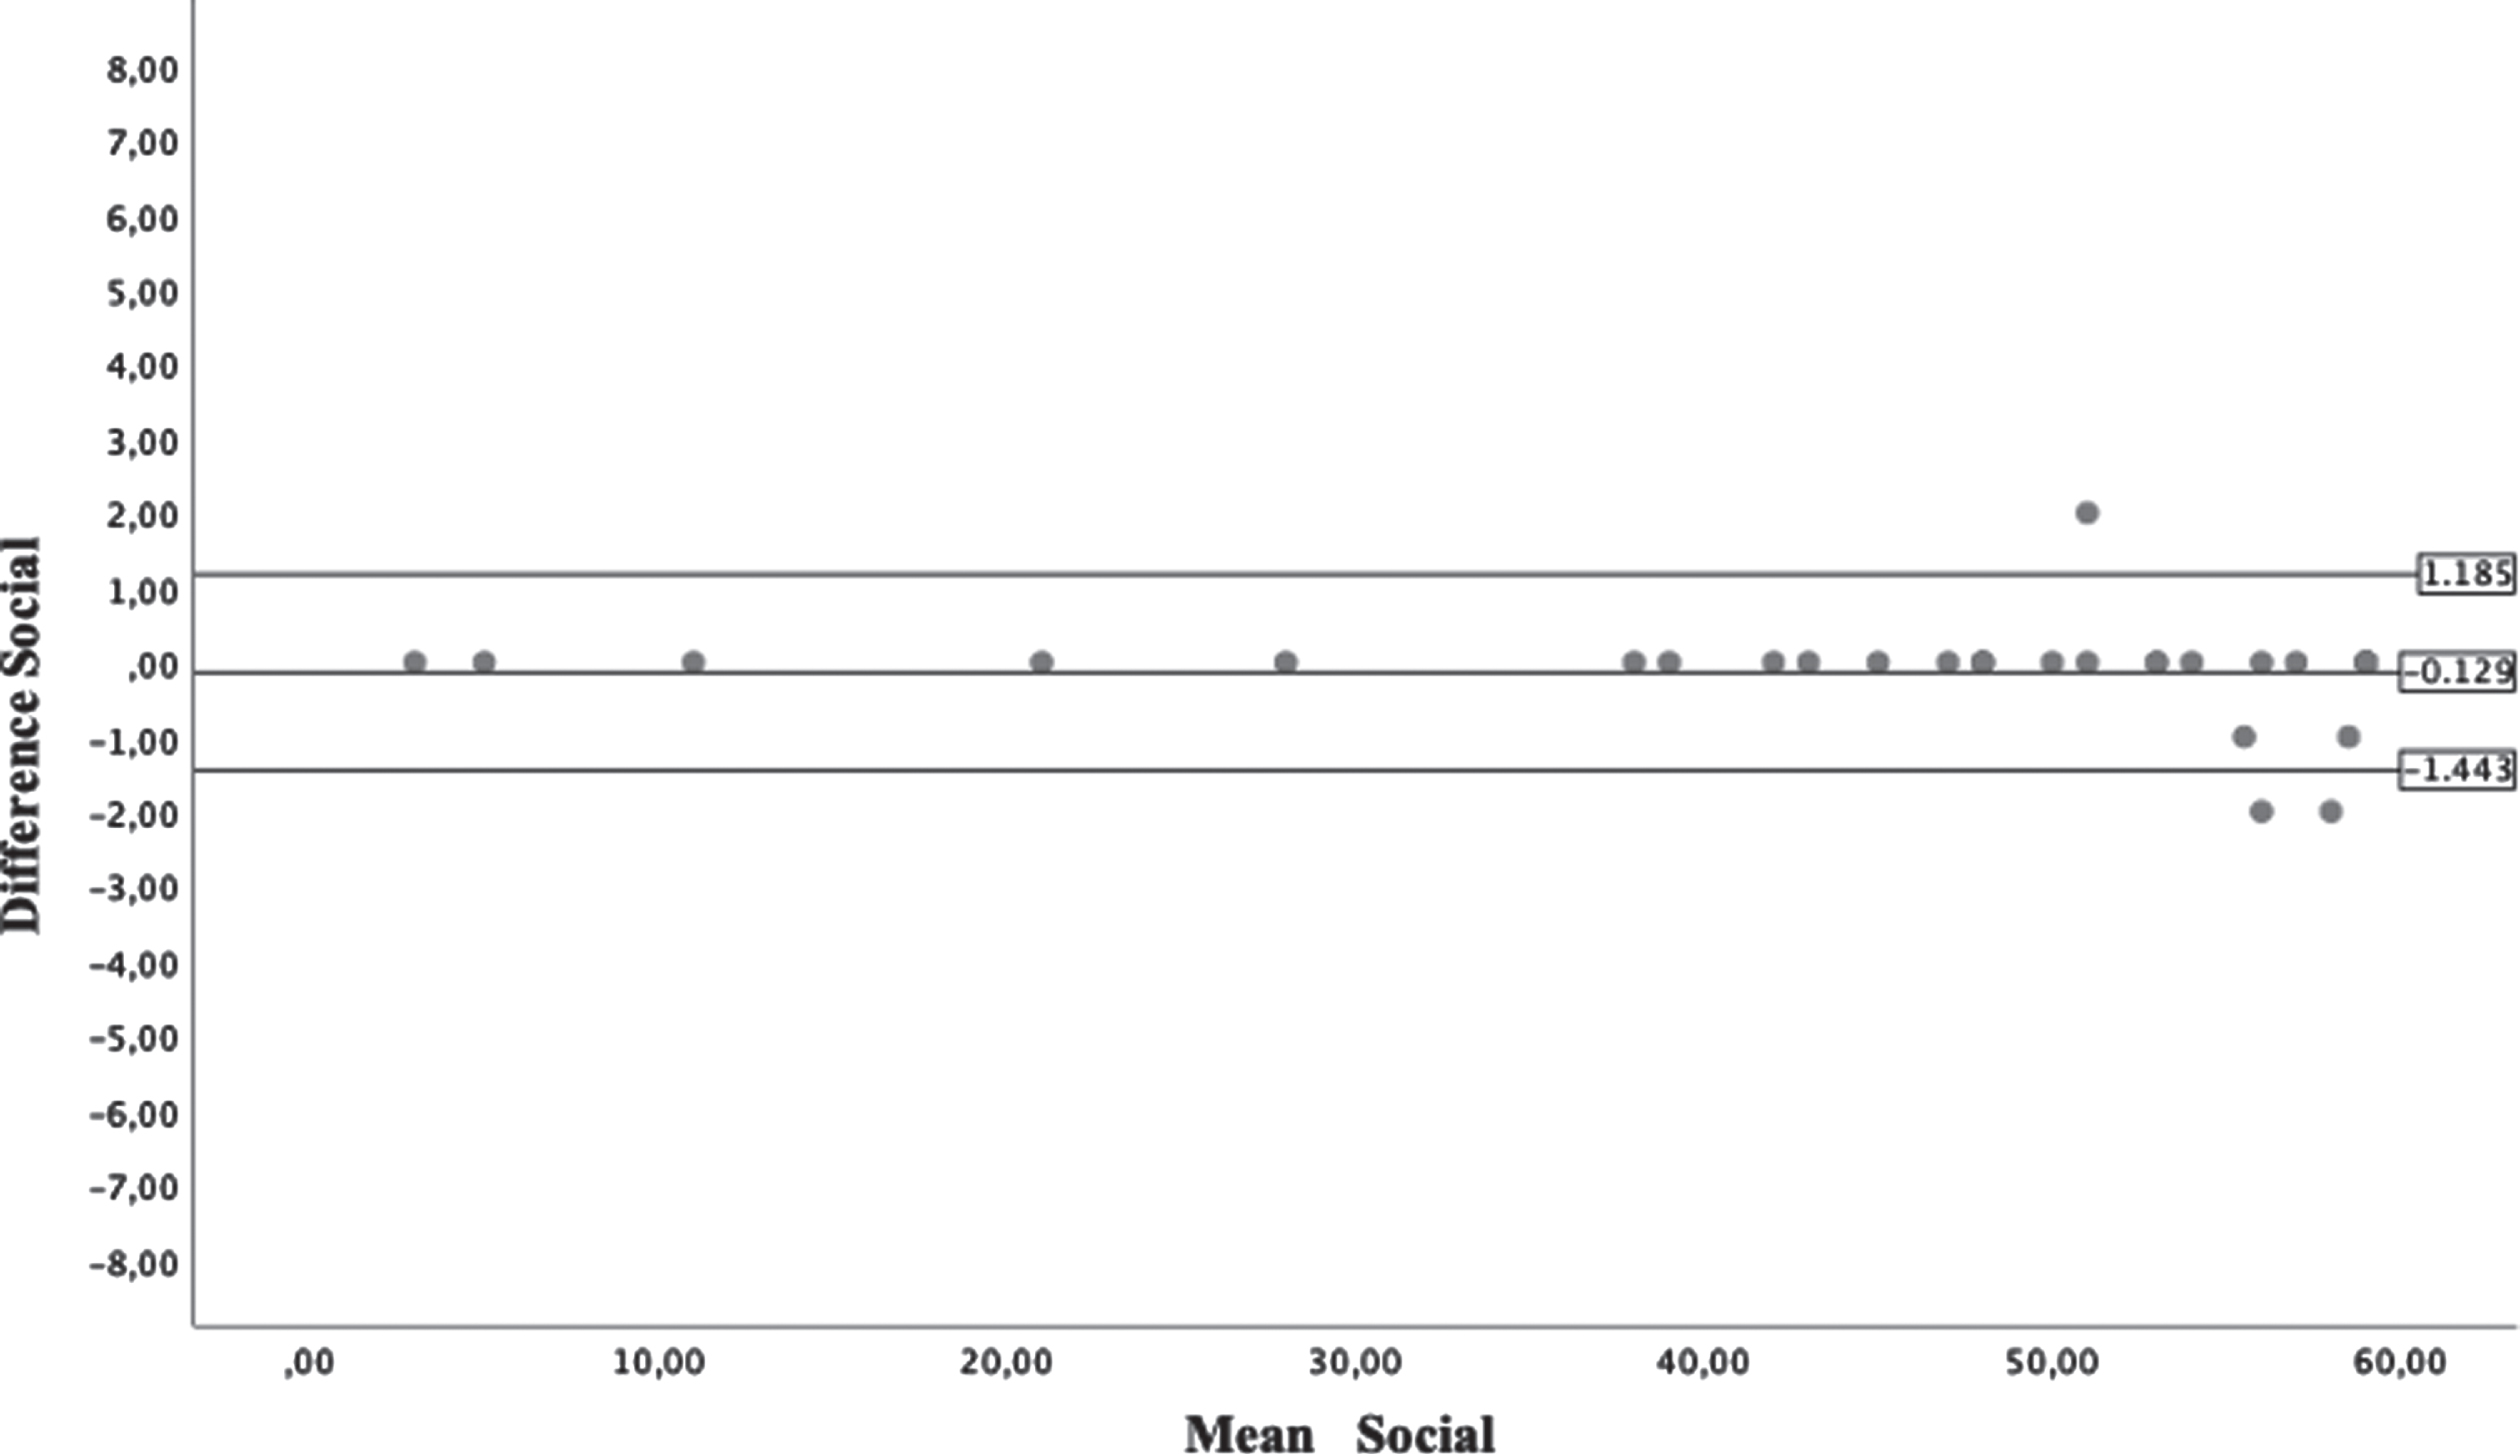
Bland-Altman plots from Social section of Caregiver Assistance Scale.
The sub-scales of the PEDI-I and the IcaBI showed high positive linear correlations (p < 0.01) for both FSS (0.804 –0.951) and CAS (0.758 –0.948), indicating that the PEDI-I has a good convergent validity. The results confirm the existence of a high correlation between PEDI-I and the IcaBI, as they measure similar constructs as previously stated. The PCC values are reported in Table 5.
Convergent Validity of the PEDI-I with IcaBI
Convergent Validity of the PEDI-I with IcaBI
Pearson Correlation Coefficients quantify validity between the PEDI-I subscales and the Italian Barthel Index (IcaBI); *p < 0.05; **p < 0.01.
It is important to assess which aspects of ADLs are delayed in children with DS in order to tailor rehabilitation appropriately. The goal is to maximize the child’s autonomy to facilitate social inclusion.
The PEDI is one of the most common tools for assessing developmental disabilities. It has been identified as a valid assessment tool to investigate treatment effectiveness. Also, it is one of the few pediatric functional measures with demonstrated sensitivity to functional changes in different developmental disabilities [51]. However, the PEDI has received some critiques: it is a long instrument, and the administration time may no longer be feasible for routine clinical use [21]; and the PEDI items are focused primarily on home-based activities, which create some difficulties for therapists to answer questions without parent input [51]. However, having a tool that measures functional abilities at home ensures the possibility of measuring changes in real life and in community settings. This aspect is crucial for measuring the effectiveness of different rehabilitation approaches, especially for children. Furthermore, the PEDI utility was also demonstrated in clinical settings: it was responsive for different developmental disorders at the discharge [52] and provided an important prognostic variable for recovery of ambulation during inpatient rehabilitation [53].
In this PEDI validation study, specific for the DS population, the Italian version of it was used, and validity and reliability were analyzed. Cronbach’s alpha values range from 0.969 to 0.986 for the domains of FSS and from 0.889 to 0.963 for domains of CAS. The findings are in line with others from the Korean [54], Chinese [55], and Dutch [21] versions. Results confirm the homogeneity of the PEDI-I and that all items positively contribute to the total score.
The present study’s findings indicate good reliability, as also reported in other similar validation studies [20–22, 55]. Excellent reliability is a fundamental prerequisite for confidence in measurement to be used for repeated assessment and follow-up. The high ICC values indicate that PEDI-I can consistently measure functional performance in children with DS. The Bland-Altman plots analysis confirms this result. The values of SDC indicate the minimal difference needed in score between two administrations to have a clinically significant change for the patient. The convergent validity of the sub-scale of the PEDI-I and items of the IcaBI show high linear positive correlation (p < 0.01), demonstrating a high relationship between the two assessment tools. Particularly, PEDI-I self-care sub-scale result correlated very highly with IcaBI items 4, 5 and 6 (Dressing, Bladder control and Bowel control) and PEDI-I mobility sub-scale resulted highly correlated with IcaBI items 7, 8, 9 and 10 (toilet used, transfer, mobility on level surfaces and stairs).
Despite the length of time it takes to administer PEDI, the authors believe that it is the most comprehensive evaluative tool currently available in the literature to assess disability in pediatrics. It is extremely important to have validated evaluation tools in different cultural contexts and diseases because this could facilitate data transmission. Currently this study is the first to evaluate the PEDI’s psychometric properties in children with DS. Because of this study, it will be possible to evaluate the same treatment in different populations using a comparable outcome.
The study shows robust results. Although, one major limitation is the sample size. Some may consider a sample of 54 to be small, and not large enough to examine the influences of the various clinical and sociodemographic variables (ages and different levels of impairment). Despite the limited sample size, the precision of this confidence interval was equal to that of the original version. Second, data were collected only in the metropolitan city of Rome. Thus, generalizability is compromised because it would be useful to understand how PEDI-I works in different settings and environments. Finally, the authors did not investigate reliability and validity of the modification scale. Future research should investigate these aspects in order to confirm the high psychometric properties of the scale (responsiveness).
Conclusions
Based on the results, this study provides preliminary evidence of the scale’s strong internal consistency, test-retest reliability, and convergent validity in children with DS. However, to better understand how the PEDI-I works in clinical practice, further research with a larger sample is recommended. A larger sample one will allow analysis of responsiveness and minimal clinically important differences.
Footnotes
Acknowledgments
Authors acknowledge Sara Tinsley, Managing Editor, and Dr. Elaine Pico, Editor-in-Chief.
Conflict of interest
The authors have no conflict of interest or funding to report.