
Abstract
PURPOSE:
Psychometric data are reported for a new Global Family Quality of Life Scale (G-FQOLS) (3-items) evaluating family members, parents and adolescent/young adults (AYA).
METHODS:
Families (
RESULTS:
A single factor with an eigenvalue greater than 1 was identified. Factor loadings were
0.79–0.94. Internal reliabilities were strong (
CONCLUSION:
This study provides preliminary support for the G-FQOLS. This global appraisal of Family Quality of Life (FQOL) reflects a participant’s personal weighting of domains important to him/her.
Background
An emerging concept, Family Quality of Life (FQOL), is useful to understand adaptation outcomes of families. Appraising the family, extends the meaning of individual quality of life as defined by the WHO (1997) “an individual’s perception of the position in life in the context of the culture and value systems in which they live, and in relation to their goals, expectations, and concerns” [1, p. 1]. Similar to individual quality of life (QOL) which captures the lived experience of the individual, FQOL can be multidimensional or an overall global perception of FQOL. The aim of this article is to detail psychometric data from parent and adolescent/young adult (AYA) in a report for a new Global Family Quality of Life Scale (G-FQOLS), specifically, construct validity and internal reliability. This scale measures FQOL, which has emerged from the perspective of families with children.
Three authors have conceptually defined FQOL. The earliest definition proposed by Poston [2] is:
Family quality of life can be defined as the conditions, consistent with the family’s
values where the family’s needs are met (i.e., daily family life, emotional well-being,
financial well-being, physical environment, health, parenting, advocacy); family members
enjoy their life together as a family (i.e., family interaction); and family members
have the opportunities to do things that are important to them (i.e., social well-being
and productivity) [2, p. 346].
Brown et al. conceptualize FQOL as “…the degree to which family quality of life is enjoyable, meaningful, and supported by the types of resources that are important to family members, as well as the struggles faced by families [3, p. 3]. Thereafter, Zuna et al. defined FQOL as “a dynamic sense of well-being of the family, collectively and subjectively defined and informed by its members, in which individual and family-level needs interact” [4, p. 262].
Two of these definitions [2, 3] suggest a multi-dimensional concept, such as an individual’s perspective of components of family life while the third proposed by Zuna et al. is defined as a collective overall wellbeing [4]. The two multi-dimensional definitions have similar domains including (a) family life that is meaningful or consistent with family values, (b) enjoyment, and (c) resources. A reflection of family struggle is a unique aspect of Brown et al.’s conceptualization [3]. These multi-dimensional definitions are limited by the a-priori delineation of specific domains that are important to the family. In contrast, Zuna et al.’s approach is a collective conceptualization based on family needs; however, this conceptualization may or may not be reflective of the beliefs in a variety of families [4]. Important aspects of family life may vary between members. A common limitation of all these definitions is that none includes the family member’s ability to differentially prioritize domains of FQOL important to him/her. These multiple conceptualizations of FQOL have led to several measures of the construct.
It is important to differentiate FQOL, which focuses on a sense of well-being of
the family, from a related concept of family functioning. Family functioning is defined as
the attributes of a family system that characterize how they operate or behave [5]. It includes attributes such as family
cohesiveness, satisfaction, mastery, hardiness, or resourcefulness. While family functioning
and FQOL are related empirically (
In addition, resilience or protective factors in AYA with SB such as communication self-efficacy (confidence in communication), future expectations, and coping support may themselves be modifiable and were also related to family factors [10]. Certain family factors may be important correlates to FQOL while protective factors in AYA may relate to family factors and/or to FQOL. Therefore, FQOL becomes an important construct to be able to assess.
For this study, FQOL was defined as an appraisal of the domains of life important to the family [11]. The construct FQOL can be operationalized as a family outcome or result of the efforts of families to balance those interactions and relationships to stabilize the family and environment on a continuum which is dynamic and salient to the family. The items of the FQOL Scale (rate your; your teen’s/parent’s; or your family’s QOL) were expected to load on a single factor due to their strong interrelationships in a previous study [10].
Overview of FQOL measurement
In the individual and FQOL literature, there are two approaches to measurement. One is domain-specific and the other is overall QOL. The first uses established measures based on domains found important to the population of individuals at large or with certain conditions at large. The second obtains a summative overall score influenced by the domains and priorities of the respondent. In this latter approach, follow-up questions are needed to understand which domains are pertinent to the respondent. Many instruments measure both domain-specific and overall QOL. An overview of existing domain-specific and overall measures is described to provide a review of the current measurement of FQOL. See Table 1 for summary of measures of FQOL.
Domain-specific measures
Beach FQOL Scale
The Beach FQOL Scale was developed in 2006 to assess family outcomes in families of children with developmental or intellectual disabilities, birth to age 21. The Beach overall FQOL value is a mean score of the total number of items [12]. Hoffman et al. [12] found evidence of validity using confirmatory factor ana- lysis and convergent validity for two of five subscales
Summary of Domain-Specific and Overall measures of FQOL
Summary of Domain-Specific and Overall measures of FQOL
Summary of studies using FQOL measure
Note. AYA
(Physical/material well-being and the Family Interaction subscales)
(see Table 1). Internal reliability for the total
and five subscales was
The FQOL-2006 Survey [3]
measures FQOL in families who have a member with intellectual or developmental
disability. Mean scale scores are calculated for each domain. The survey contains two
sections for each domain, (1) quantitative and qualitative items about characteristics
of the domain, and (2) six items for each dimension and one open ended question for each
domain, “What things do you think could improve your family quality of
life?”. Additionally, two global items were included which are described
below. Isaacs et al. tested the factor structure of the FQOL-2006 Survey in a large
sample across four countries (Nigeria, Australia, Canada, US) in families with a member
with an intellectual disability (
Global measures of overall FQOL
Single item individual QOL measures have been validated and supported [10, 18]. Some researchers feel that the overall global perception of QOL that reflects the individual’s emphasis on important domains may be useful as an outcome [10, 19, 20]. Similarly, a global concept of a family member’s perception of FQOL can include the domains important to the family.
Two global items at the end of the FQOL-2006 Survey address FQOL: “Overall, how would you describe your family’s quality of life?” and “Overall, how satisfied are you with your family’s quality of life?” [3]. Response pattern for the overall global item was 5 (excellent) to 1 (poor). Response pattern for the satisfaction question was 5 (very satisfied) to 1 (very dissatisfied). Only the global satisfaction item has been reported in the literature. In addition to the two global measures of overall FQOL described, a single item measure, “How would you rate your family’s quality of life?” was used by Sawin, Brei, Buran, and Fastenau to capture FQOL in families who had an adolescent with SB [10]. The response pattern was zero (poor) to 100 (excellent).
Summary of studies using FQOL measures
A small number of studies have reported measurement of FQOL in a variety of ways, mostly in correlational descriptive studies. While assessment of FQOL has been conducted since 2002, 12 studies have examined FQOL in families with children with either chronic health conditions or intellectual and developmental disabilities [11]. Only two studies examined families with children with and without chronic health conditions (CHC) [6] and without disabilities [15]. A majority of studies were conducted in families of children with intellectual and developmental disabilities. See Table 2 for a summary of studies using FQOL measures.
Methods
This psychometric analysis used data from a larger study on secondary conditions and adaptation in adolescents with SB. This study included 209 families who had an AYA with and without SB. Participants (parents and AYA) were asked to rate their own, their parent (or AYA) and their family’s QOL.
Items for Global Family Quality of Life Scale parent version. For teen version, items
are reordered: (1) Your quality of life; (2) Your family’s quality of life; (3) Your
parent’s quality of life.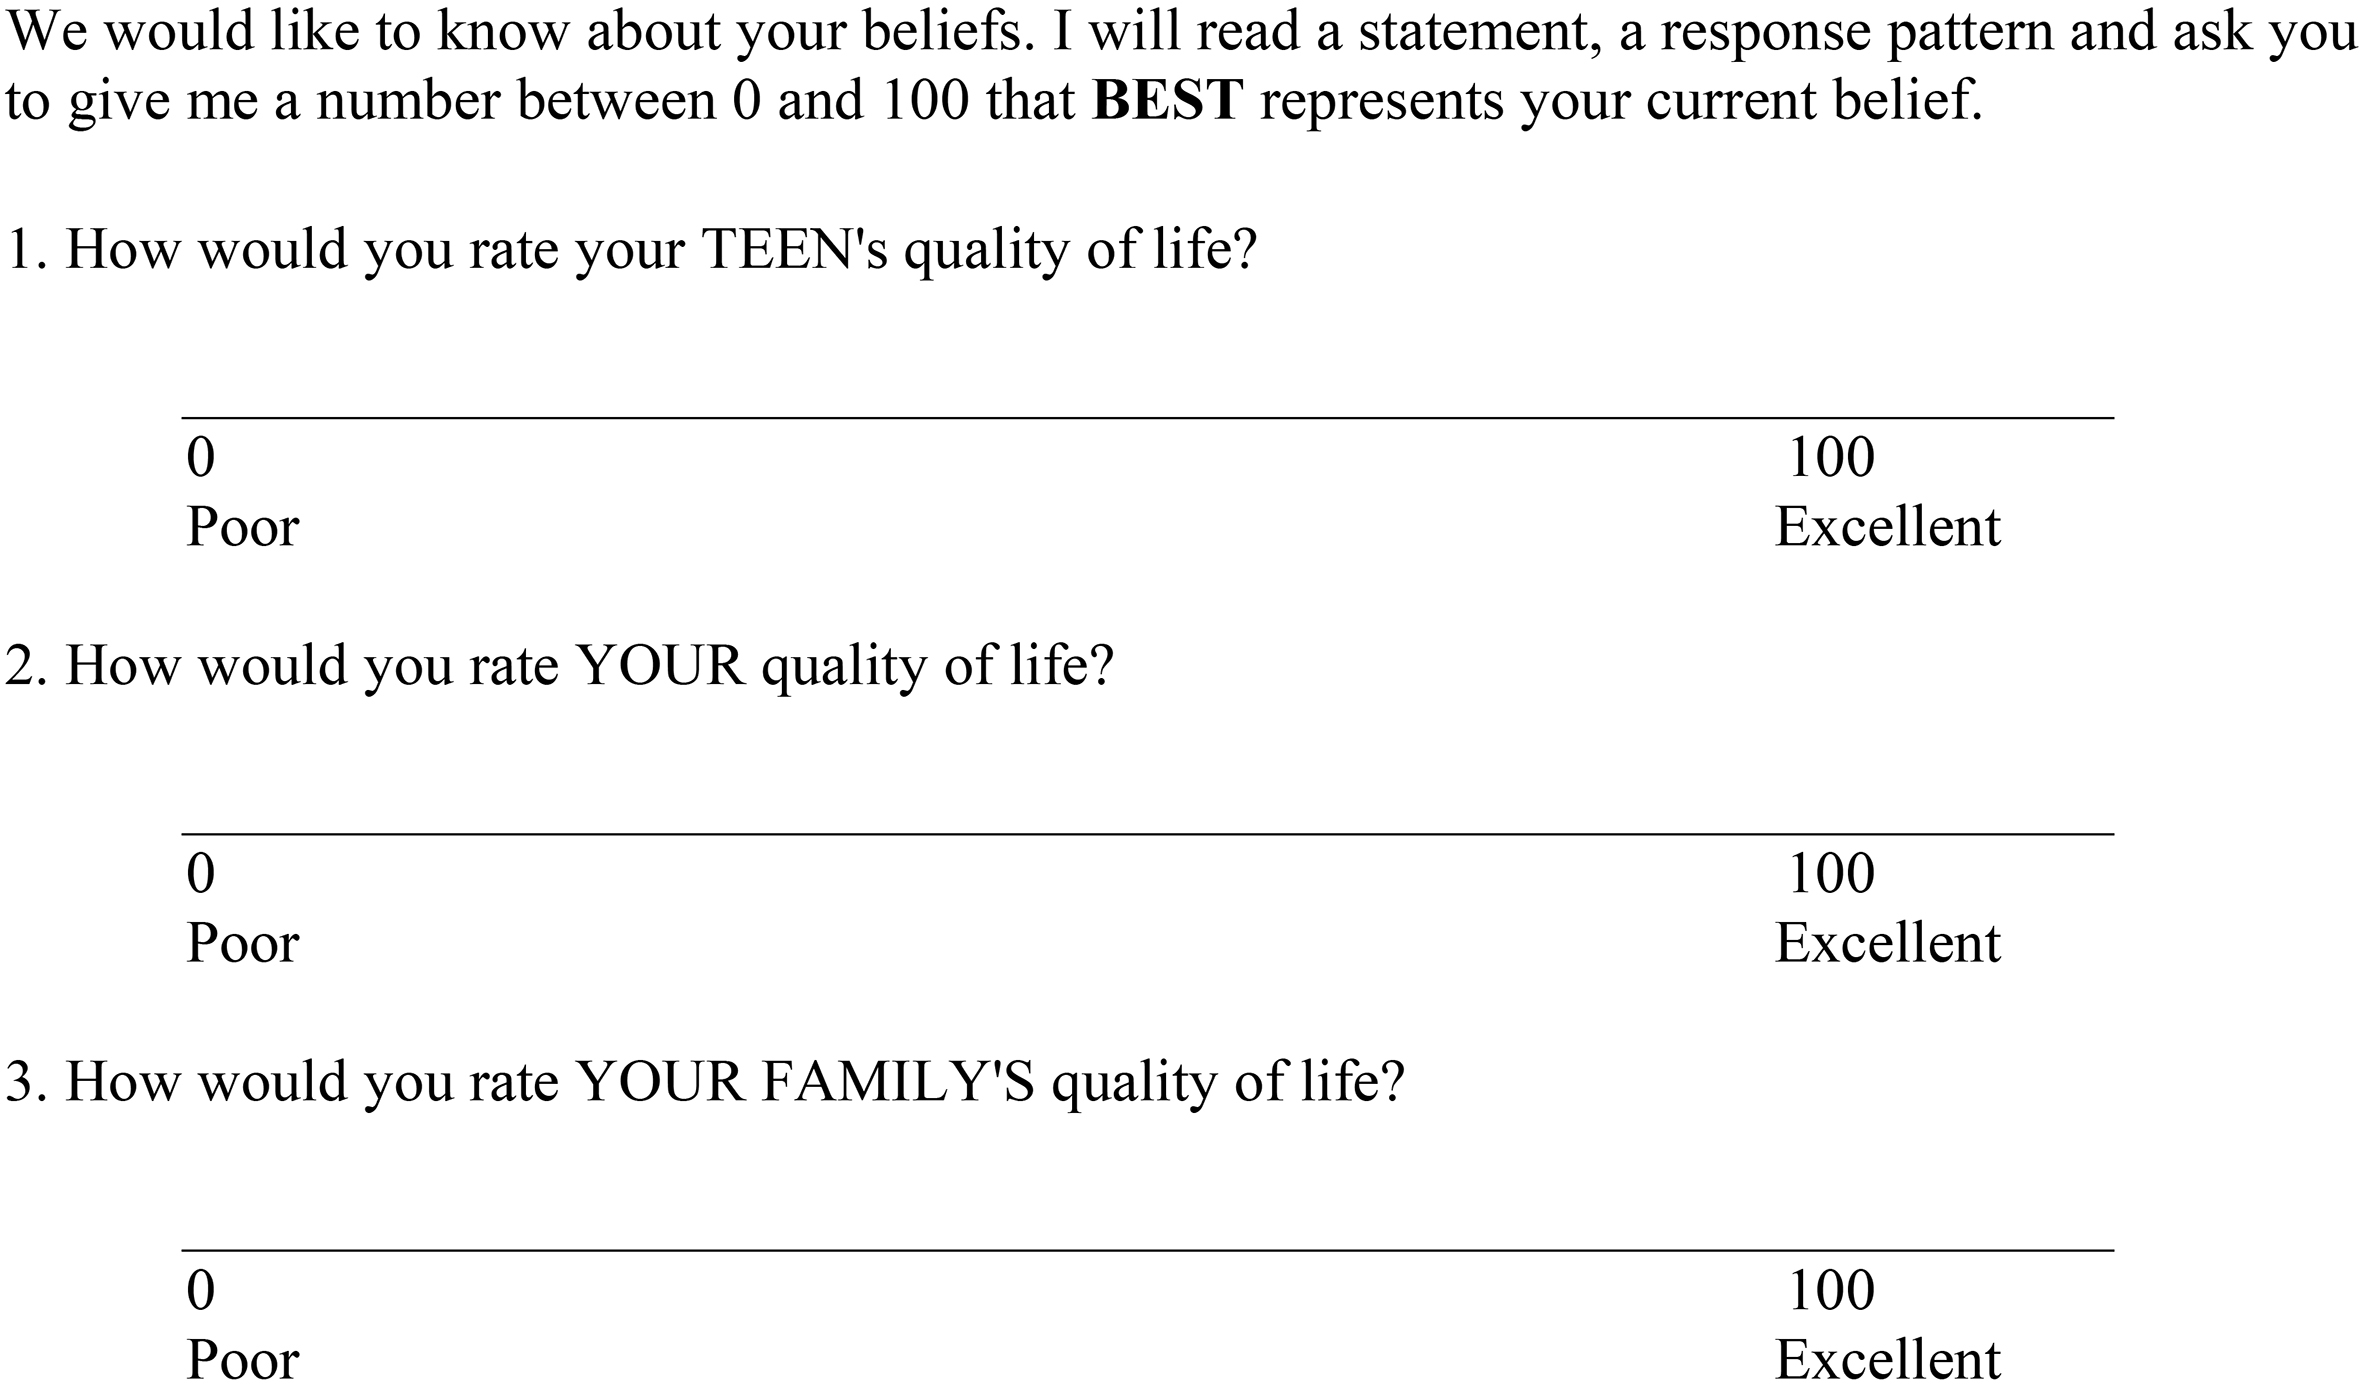
Characteristics of the sample
Note. Demographic variables were tested for significant differences
between subsamples using Chi Square statistic. Income significantly different by
subsample.
Participants were 209 parents of AYA (112 SB group; 97 comparison) and 197 AYA (103 SB group; 94 comparison) from a total of 209 families. Parents and AYA were recruited for a larger study of secondary conditions and adaptation in AYA with SB from four childrens’ hospital spina bifida programs in the Midwest and the Eastern United States (US). Comparison families were recruited by referral from participants with SB, primary care providers, and advertisement in each hospital. Inclusion criteria were English speaking families with AYA 12 to 25 years of age and without diagnoses of moderate or severe intellectual disabilities. AYA had no major medical conditions unrelated to their SB. Parents and AYA with complete data on the FQOL measure were included in the psychometric evaluation. IRB approval was obtained for both the original AYA adaptation study and secondary analysis. Data were collected by telephone interviews [6, 7].
Instrument
Three global items, your, your teen’s/parent’s, or your family’s quality of life were rated on a scale from zero (poor) to 100 (excellent) (see Fig. 1). Depending upon who is responding, either AYA or parent, FQOL reflect the respondents’ report of their family’s and/or their family member’s quality of life. The three items measure individual’s perceptions and when combined by respondent measures FQOL.
Summary of Factor Analysis, Reliability, and Parent-AYA Agreement for 3-item FQOL
Scale
Summary of Factor Analysis, Reliability, and Parent-AYA Agreement for 3-item FQOL Scale
Note. Principal Component Analysis with Varimax Rotation;
Principal component analysis using Varimax rotation was conducted. A significant Bartlett test and KMO statistic above 0.60 were used to determine if the analysis supported factorability. Eigenvalues greater than 1 and scree plot patterns were used to identify the number of factors. Intraclass correlation coefficients (ICC) were computed. Guidelines for interpretation of ICC are 0.90 excellent, 0.80 very good, and 0.70 adequate [21, p. 92]. Further, two additional measures of family functioning, the Family APGAR [22] (family satisfaction) and the Family Mastery and Health subscale of the Family Inventory of Resources for Management [23] (family resources) were used for concurrent validity analysis. Family APGAR reflects the parent or AYA satisfaction with family adaptation, partnership, growth, affection, and resolve [22]. Family resources, reported by the parent, were an indicator of mastery over family events, family support resources, family esteem, and communication [5]. For all scales, higher scores reflect greater family satisfaction and family support resources. Data from each respondent (parent and AYA) were analyzed separately using total samples with and without SB and then by subsamples. Principal component factor analysis using Varimax rotation was conducted to assess factor structure. Cronbach alpha was used to assess internal reliability. Frequencies were used to describe the scale scores for all measures. T-tests evaluated the differences in FQOL between parent groups (e.g., parents with and without an AYA with SB) and AYA groups (e.g., those with and without SB). The relationships of FQOL to measures of family function were evaluated using Pearson Correlations. FQOL scores between parents and AYA pairs were evaluated using ICC.
Results
Parents were primarily female (94%), Caucasian (86%), well-educated either attending or completed college/vocational training/graduate program (71%) and married (74%) (see Table 3 for sample characteristics). Combined family income was significantly lower for families with AYA with SB, 18% earned less than $20,000 and 50% earned greater than $50,000. In comparison group, 4% earned less than $20,000 and 73% earned greater than $50,000. About half of the AYA were female (54%) with a mean age of 15 years (range 12–25). Eighty-four percent of AYA with SB had a shunt and half used a wheelchair (50%). AYA with SB had a broad range of functional motor levels, high lumbar (19%), mid lumbar (33%), low lumbar (35%) and sacral (8%).
Principal component analysis of these parent and AYA data and subsamples (with or without SB) with Varimax rotation of the 3-item scale of FQOL items identified that the items load on one factor. In the total and subsamples with parent or AYA ratings (with and without SB), the Bartlett tests were significant and KMOs were 0.654–0.692 indicating factorability. In each analysis, the scree plot test suggested 1 factor and the loading on to a single factor ranged from 0.79–0.94. The amount of variance explained by a single factor ranged from 78–83% (see Table 4).
Descriptive statistics for QOL and overall FQOL
Descriptive statistics for QOL and overall FQOL
Note. Total parent sample
Parents reported high FQOL (parent report SB group
Parent report of FQOL was moderately correlated with their report of family
satisfaction and resources (
The relationship of FQOL in parent and AYA pairs was poor to moderate with wide confidence intervals indicating poor agreement and variability between parent and AYA report of FQOL scale scores for the total and sub-samples: ICC 0.41, 95% CI [0.22–0.56] for total sample; ICC 0.38, 95% CI [0.10–0.58], for SB group; ICC 0.48, 95% CI [0.22–0.65] for comparison group. Agreement between parents and AYA was highest in the group without SB.
Two approaches to FQOL measurement have been used in the literature: first, measures that tap domain-specific aspects of family life; and second measures that assess overall perspective of FQOL. The G-FQOLS, an example of the second, is a weighted perception of the domains important to the reporter about the family as a whole, which in this case is, an average of a family member’s perspectives of the individual, the child or parent, and their family’s quality of life. The nature of FQOL is a dynamic approach which facilitates parents’ and AYA’s report of important domains of life which can vary across time. A strength of the G-FQOLS is its focus on perception versus function.
In the current overall G-FQOLS instrument, perception of individual, other
family members (either parent or child) and FQOL loaded onto one factor. Investigators might
wonder about the close relationship of the three items. However, strong relationship between
these items (
In one study that used the FQOL-2006 Survey with both overall and
domain-specific measures, the global single FQOL item was related (
Poor agreement between parent and AYA report of FQOL indicates measure is sensitive to differences in perspectives by reporter. Findings support importance of obtaining AYA appraisal from AYA, rather than by parent proxy. This instrument offers the capacity to assess discrepancies between family members which may identify a meaningful target for intervention. Further assessment of the meaning of FQOL for both parents and AYA can determine if family members have the same meaning of FQOL or prioritize the domains similarly. If AYA had moderate to severe intellectual disabilities, they may not have the capacity to appraise their own FQOL. In this instance, ratings by parent proxy might be used to assess FQOL.
Differences between groups with and without SB were evident in parents, but not in AYA data. Although differences were detected in parent report, those differences were small. The lack of difference by group with and without SB in AYA may indicate that the meaning of FQOL for AYA differs from that of parents. Parents may place more weight on aspects of life related to their experiences as caregivers. In families of children with moderate to severe intellectual disabilities, parents’ appraisal of FQOL may be influenced by continued responsibility for care as their AYA transitions to adulthood.
Another explanation for the lack of difference between the report of FQOL in AYA’s with and without SB may be due to the “disability paradox” seen when adults with disabilities report a high QOL despite limitations in activities of daily living, difficulty in social roles, and experience with persistent discrimination [25]. The perception of AYA with SB may be based on meaning and values different from individuals without disability. While professionals might expect lower QOL in youth with SB, there is conflicting evidence about QOL in youth with SB in other than the physical domain [10, 26]. The universal finding of lower physical QOL is based on tools that use function such as items about walking or running to assess QOL/health-related QOL(HRQOL). Murray et al. acknowledge their findings of lower HRQOL could be a result of the measure they used where physical domain was measured by function [27]. Among QOL/HRQOL researchers studying individuals with disabilities, there is strong support for measurement of HRQOL based on perception (the WHO definition) rather than function.
Either a comprehensive FQOL instrument, which addresses domain-specific issues
in a family who has a member with a disability, or a brief measure of overall perception can
be useful in different research or clinical settings, depending on the purpose of the
project. Future research may use rigorous mixed methods to develop/refine an item pool and
test content validity for a domain-specific measure of FQOL in SB. This would help
researchers/clinicians identify domain-specific targets for intervention. Additionally, item
response theory may be applied to extend our measure of FQOL to predict expected ratings
given specified parameters or our measure may be converted to a Patient-Reported Outcomes
Measurement Information System (PROMIS
Limitations
As a self-report measure, there is potential for social desirability response bias. Previous research using similar items in the SB population found scores of QOL/FQOL single item means between 72–77 [10], slightly lower than our current findings. The G-FQOLS items were administered in a set of 10 single-items including measures of stress, health and responsibility for care which might have facilitated a response bias. However, all items had a broad response range, supporting respondents’ ability to determine differences between items. For example, the mean stress of everyday life for parents of AYA with and without SB specifically was 53.33 (SD 26.32) [6]. However, in future testing, to protect against any response bias, FQOL items should be interspersed with items using a different response pattern. Test-retest reliability and sensitivity to change have not been determined and are needed prior to use in intervention studies. Another limitation is the lack of diversity in the sample tested. This sample was mostly Caucasian and resided primarily in Midwest (Wisconsin, Indiana, Ohio, and Virginia). Evaluation in a more diverse sample is indicated.
Implications for practice and research
This measure may be useful in primary or specialty care settings to identify families at-risk who need further assessment and intervention. Evaluation of families can begin with a preliminary screening of G-FQOLS. Although there is not enough evidence to determine cut points using the G-FQOLS, clinicians can either use the tool as a screening tool or as an entry to discussion. Further assessment and discussion might be indicated when the G-FQOLS score is 2.0 standard deviations below the mean of the evidence to date (e.g. values of 56.84–59.16 using data from this study). Alternatively, when used primarily as an entry to discussion, probes used could include: “What does FQOL mean to you? What are the barriers to achieving your FQOL goals? What would make your FQOL better?”. Additional evaluation could follow with a standardized assessment for area(s) of concern such as depressive symptoms, pain, or other issues.
Measuring FQOL over time would enable clinicians and researchers to understand developmental influences on FQOL. While most positive appraisals may occur in the younger years when discrepancies for development between themselves and peers are smallest, parents’ future expectations for their family members may influence their FQOL. Families with difficulty in typical tasks of family life in the context of chronic illness may be identified with a substantial decrease in score or low G-FQOLS score. This should lead to follow-up assessment. FQOL measurement may be particularly helpful during times of transition when additional independence is expected (e.g., transitioning to adolescence or emerging adulthood). Changes in G-FQOLS scores over time, when experiencing acute illnesses, secondary complications, or hospitalizations would be indications for specific assessment. Understanding perceptions of FQOL may help develop targeted family interventions over the life course.
Further research is needed to establish G-FQOL test-retest reliability and sensitivity to change. If established, the instrument can be used to monitor and evaluate future family-centered interventions in research and practice. Research to date has used the measure to quantify FQOL from a family member’s perspective. Future research should also address the use of the instrument with multiple family members.
Conclusion
This study provides preliminary evidence that supports use of a simple 3-item global measure of FQOL in research and practice. The G-FQOLS rating may be used for additional assessment of the components of FQOL in parents and AYA. If G-FQOLS is low, it may prompt referral to support services or screening for mental health concerns in both pediatric and specialty care settings.
Footnotes
Acknowledgments
The original study was supported by a grant from the Association of University Centers on Disabilities (AUCD) in cooperative agreement with the Centers for Disease Control and Prevention (CDC)’s National Center on Birth Defects and Developmental Disabilities (NCBDDD). In addition, the authors thank the families for participation.
Conflict of interest
The authors have no conflict of interest to report.